Abstract
In this paper we propose a computational model of bottom–up visual attention based on a pulsed principal component analysis (PCA) transform, which simply exploits the signs of the PCA coefficients to generate spatial and motional saliency. We further extend the pulsed PCA transform to a pulsed cosine transform that is not only data-independent but also very fast in computation. The proposed model has the following biological plausibilities. First, the PCA projection vectors in the model can be obtained by using the Hebbian rule in neural networks. Second, the outputs of the pulsed PCA transform, which are inherently binary, simulate the neuronal pulses in the human brain. Third, like many Fourier transform-based approaches, our model also accomplishes the cortical center-surround suppression in frequency domain. Experimental results on psychophysical patterns and natural images show that the proposed model is more effective in saliency detection and predict human eye fixations better than the state-of-the-art attention models.
Keywords: Visual attention, Saliency map, Fast algorithm, Discrete cosine transform, Principal component analysis
Introduction
There exists an information bottleneck along our visual pathway since the human brain has limited neural resources (Itti and Koch 2001). Accordingly, a visual mechanism referred to as attention selection has evolved, which rapidly shifts across the scene under view and selects a small area for further cortical processing (Treisman and Gelade 1980; Koch and Ullman 1985; Desimone and Duncan 1995; Crick and Koch 1998; Bundesen and Habekost 2008; Gu and Liljenstrom 2007; Haab et al. 2011). Typically, attention selection is either driven in bottom–up manner or controlled by top-down cues (Itti and Koch 2001; Treisman and Gelade 1980; Koch and Ullman 1985). Top-down attention is largely task-dependent, whereas bottom–up attention is scene-dependent, i.e., it only depends on the salience of the scene under view.
This paper is primarily concerned with the computational modeling of bottom–up attention, which has already attracted intensive investigations in the area of computer vision in relation to robotics, cognitive science and neuroscience. One of the most influential computational models of bottom–up attention was proposed by Itti et al. (1998), which is designed according to the neural architecture of the human early visual system and thereby has biological plausibility. Itti’s model (ITTI) has been shown to be successful in detecting salient objects and predicting human fixations. However, the model is ad-hoc designed and suffers from over-parameterization.
Some recent works addressed the question of “what attracts human visual attention” in an information theoretic way, and proposed a series of attention models based on information theory. Bruce and Tsotsos (2005, 2009) proposed an Attention model based on Information Maximization (AIM) which projects the input image into the independent component analysis (ICA) space and uses Shannon’s self-information to measure saliency. Other attention models based on information theory include the graph-based visual saliency approach proposed by Harel et al. (2006), and the discriminant center-surround approach proposed by Gao et al. (2007). While these models offer good consistency with psychophysical and physiological data, they are more computationally expensive than ITTI, and difficult to implement in real-time systems.
Another kind of attention approaches are implemented in the Fourier transform domain. These approaches are not at all biologically motivated, but they have fast computational speed and good consistency with psychophysics. These Fourier transform-based approaches include spectral residual (SR), proposed by Hou and Zhang (2007), and phase spectrum of quaternion Fourier transform (PQFT), proposed by Guo and Zhang (2010). Following SR and PQFT, a later work proposed by Bian and Zhang (2010) asserted that the operation of whitening the Fourier amplitude spectrum is almost equivalent to the center-surround operation in the spatial domain, and hence provided a link between biologically based spatial domain models and Fourier transform-based approaches.
In this paper we propose a bottom–up attention model based on principal component analysis (PCA). Our attention model, referred to as pulsed PCA (P2CA), simply projects the whole image into the PCA space and exploits the signs of the PCA coefficients to generate the saliency information of the visual space. This reduces computational complexity because unlike the spatial domain models based on Gabor filters or ICA basis functions (e.g., ITTI and AIM), our model does not need to decompose the input image into numerous feature maps separated in orientation and scale. Compared with Fourier transform-based approaches, our model has more neurobiological and developmental implications in that PCA projection vectors can be obtained by some typical neural networks with Hebbian rule (Haykin 2001). Moreover, the outputs of a pulsed PCA transform, i.e., the signs of the PCA coefficients, have the same binary fashion with the neuronal pulses in the human brain. Essentially, the Fourier amplitude spectrum describes the principal components of natural scenes. Therefore, normalization of the PCA coefficients is equivalent to the operation of whitening the Fourier amplitude in many Fourier transform-based approaches. Toward this end, our model also accomplishes the center-surround operation in biologically based spatial domain models and thereby is capable of producing visual saliency of the input scene.
While P2CA is neurobiologically motivated, projection of the whole image into the PCA space is performed in a relatively high dimensionality. Such an operation may be quick for the massively parallel connections of the human brain, but is slow for computer processors. Moreover, PCA is a data-dependent technique, and therefore we can hardly find a set of fixed transform vectors that are suitable for all saliency search tasks. In order to overcome this disadvantage, we propose a very simple and data-independent model by employing a discrete cosine transform (DCT) to replace the PCA. This DCT-based attention model is referred to as pulsed cosine transform (PCT) in this paper. It can be shown that DCT is asymptotically equivalent to the PCA for signals coming from a first-order Markov model, which is a reasonable model for digital images (Hamidi and Pearl 1976; Oja 1992; Rao and Yip 1990). Therefore, PCT may offer better performance than P2CA in saliency detection.
The remainder of this paper is organized as follows. Section “Model architecture” gives an overview of the proposed computational model of bottom–up attention as well as its neurobiological and developmental plausibilities. Section “Psychophysical consistency” shows the consistency of our model with psychophysics. Section “Experimental validation for natural images” quantifies the consistency of our model with eye fixation data. Section “Motion saliency” shows our model’s capability of detecting motion saliency. Section “Discussions” gives some discussions about the proposed model, and finally a conclusion is drawn in section “Conclusion”.
Model architecture
PCA computes the eigenvectors of the covariance matrix of the observed data, and the dominant eigenvectors account for the greatest part of the covariance (Haykin 2001). Many studies (e.g., Oja 1982; Foldiak 1989; Sanger 1989; Weng et al. 2003) suggested that Hebbian learning in neural networks can find the principal components of incoming sensory data. In this section we begin by introducing a bottom–up attention model based on PCA transform, and then extend the model to a DCT-based framework.
Pulsed PCA model
Li (2002, 2006) hypothesized that the computation of salience is conducted in the neural dynamics arising from some type of intra-cortical center-surround interactions between V1 simple cells. Her spiking neuron model is capable of saliency detection. Simoncelli and Schwartz (1998) used divisive normalization to model center-surround suppression of cortical cells. Their experimental results were consistent with recordings from macaque V1 simple cells from Cavanaugh et al. (1997). Recently, Bian and Zhang (2010) suggested that divisive normalization can be performed in frequency domain. They showed that whitening the Fourier amplitude spectrum in frequency domain is equivalent to the center-surround operation in the spatial domain.
On the other hand, Field (1989, 1993, 1994) showed that the Fourier amplitude spectrum describes the principal components of a natural scene when the principal axes in the data space are determined by a population of images with stationary statistics. Inspired by this relation between the principal components and the amplitude spectra of natural images, we believe that the computation of salience can be conducted in the PCA space. Notice that Fourier transform-based approaches conduct the center-surround operation by whitening the Fourier amplitude spectrum. Accordingly, we normalize the principal components to accomplish this center-surround operation in spatial domain.
In practical applications, the PCA projection vectors can be easily obtained by some efficient numerical methods such as eigenvalue decomposition or the QR algorithm, given a large set of image samples (Golub and van Loan 1996). After all PCA projection vectors are obtained, we reshape the n-pixel input image X into an n-dimensional vector x. Then, the lexicographically ordered vector x is projected into the PCA space. Next, we normalize the PCA coefficients of x by use of a signum function. This PCA projection followed by a normalization process can be simply formulated as
 |
1 |
where C denotes an n × n orthonormal basis matrix with its rows as PCA projection vectors. The notation “sign(·)” denotes the signum function. Equation 1 is called pulsed PCA (P2CA) transform because it only retains the signs of the principal components. Its output vector p are expressed in binary codes (i.e., 1s and –1s), which incidentally mimic the neuronal pulses in the human brain. Specifically, 1s and –1s correspond to the firing and non-firing states of neurons, respectively. The network architecture of Eq. 1 is illustrated in Fig. 1. Note that the signum function, which normalizes the PCA coefficients, corresponds to the center-surround operation in spatial domain. Therefore, by using Eq. (1), we accomplish the computation of salience in the PCA space.
Fig. 1.
The network architecture for the computation of salience. Feedforward connections are represented by the PCA transform with image sequences as visual input. The outputs, normalized by a signum function, become binary codes (1s and –1s) that mimic the neuronal pulses
To recover the saliency information in the visual space, we conduct an inverse PCA transform on the binary vector p, which can be formulated as
 |
2 |
where C−1 denotes the inverse PCA transformation matrix, and the notation “abs(·)” is an absolute value function. Afterward, we reshape the obtained vector f into a matrix F that has the same size as the input image. Normally F is post-processed by convolution with a Gaussian filter for smoothing, which is formulated as
 |
3 |
where G denotes a 2-dimensional Gaussian function, and S is the corresponding saliency map of the input image X. Note that F is squared for visibility.
It has been shown that early visual features such as color, intensity and orientation are processed in parallel at a pre-attentive stage (Treisman and Gelade 1980). Accordingly, we decompose an input image into primitive feature maps before computing the saliency map. With r, g, and b being the red, green, and blue channels of the input image, an intensity map XI is computed as XI = (r + g + b)/3. Similar to Itti et al. (1998), three broadly-tuned color maps for red, green, and blue are created as follows: XR = r – (g + b)/2 for red, XG = g - (r + b)/2 for green, and XB = b − (r + g)/2 for blue (negative values are set to zero).
In order to avoid large fluctuations of the color values at low luminance, we first calculate a weighting factor for each feature map as follows: wI = max(XI) for intensity, wR = max(XR) for red, wG = max(XG) for green, and wB = max(XB) for blue. Then the overall saliency information is calculated as
 |
4 |
where FR, FG, FB, and FI are the reshaped maps generated by Eqs. 1 and 2 using feature maps XR, XG, XB, and XI, respectively. Finally, the saliency map is obtained by Eq. 3.
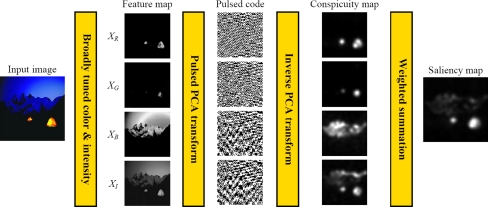
The complete flow of the proposed algorithm is illustrated in Fig. 2. The input image is initially decomposed into four biologically motivated channels: three color maps and an intensity map. Each of the four feature maps is then subjected to a pulsed PCA transformation, which produces a binary representation (i.e., pulsed code) for each channel by use of a normalization operation. Afterward, we conduct an inverse PCA transformation on each binary representation to obtain a conspicuity map for each channel. Finally, a saliency map is obtained by a weighted summation of the four conspicuity maps. Note that the saliency map is a topographically arranged map that represents visual saliency of a corresponding visual scene. The objects or locations with high saliency values can stand out or pop out relative to their surroundings, and thus attract our attention. From Fig. 2, it can be seen that the salient objects are the mountain tents, which pop out from the background.
Fig. 2.
The pulsed PCA algorithm from original image (left) to saliency map (right). Note that the conspicuity maps and the saliency map are normalized in the same range between 0 and 255 for visibility
Extending to pulsed cosine transform
In the previous subsection we proposed a bottom–up attention model based on the PCA transform. However, the computational complexity of a PCA transformation could be rather high for real-time saliency detection. This is because the dimensionality of the PCA space is equal to the number of pixels of the whole image. Although we can employ a down-sampled image (e.g., resized to 64 × 64 px) instead of using a full-size image (usually containing several mega pixels) to calculate the saliency map, a 4096-dimensional PCA transformation is still computationally expensive for a real-time system. Moreover, PCA is a data-dependent technique, and therefore the performance of our PCA-based attention model could be affected by the choice of the training data. To overcome this disadvantage, we propose a data-independent attention model, which is more suitable for most visual search tasks, based on the principle of the P2CA model.
Ahmed et al. (1974) proposed a discrete cosine transform (DCT) and compared its performance with the Karhunen–Loeve transform (also known as PCA) in image processing applications. After that, a number of studies (e.g., Shanmugam 1975; Hamidi and Pearl 1976; Clarke 1981; Uenohara and Kanade 1998) have mathematically proved the asymptotic equivalence between the DCT and the PCA for Markov-1 processes, which is commonly used to approximate image data. This means that PCA for Markov-1 signals approaches the DCT as the number of training samples tends to infinity. Therefore, DCT can be considered as a fully trained PCA for image data. To this end, we replace the PCA transform by a 2-dimensional DCT and thereby derive a data-independent attention model, which is referred to as pulsed cosine transform (PCT) in this paper. Besides the advantage of data-independency, DCT has many fast algorithms for its calculation. The 2-dimensional DCT transformation is performed in a separable decomposition in rows and columns, and therefore its computational complexity is significantly lower than a PCA transformation.
Note that the PCT model is similar to the pulsed PCA model except that it uses DCT instead of PCA. Thus, the PCT model can be briefly summarized as follows. First, the input image is decomposed into four biologically motivated channels: three color maps and an intensity map. Then, each of the four maps is subjected to a DCT transformation. Next, the DCT coefficients are normalized by setting all positive coefficients to a value of 1 and all negative coefficients to a value of –1. Afterward, we conduct an inverse DCT transformation on each binary representation to obtain a conspicuity map for each channel. Finally, a saliency map is obtained by a weighted summation of the four conspicuity maps.
It should be noted that, in the two versions of our model, if the PCA or the DCT coefficients were not normalized, the inverse PCA or DCT transformation would have reconstructed the initial map on the channel; but due to the normalization, the inverse PCA or DCT transformation produces a conspicuity map instead of the initial map.
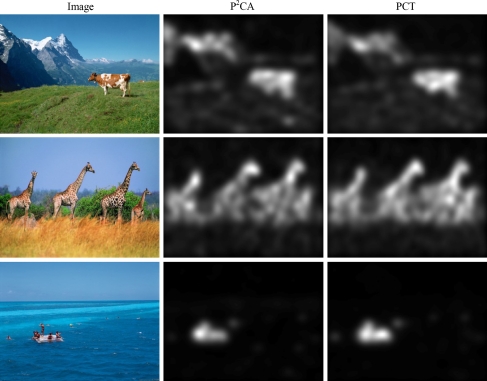
Figure 3 gives the model responses to three natural images. As can be seen, the animals and swimmers, which are perceptually salient, pop out relative to the backgrounds. Moreover, the saliency maps generated by P2CA and PCT are significantly similar. Note that we resize the image to a width of 64 px and keep its aspect ratio before calculating the saliency map. This spatial scale is chosen according to the heuristics of Itti and Koch (2000) and Fourier transform-based approaches (Hou and Zhang 2007; Guo and Zhang 2010). Accordingly, we estimate the PCA projection vectors using one million image patches that are gathered from 340 training images. This collection of training images contains 100 images used in Guo and Zhang (2010) and 240 images downloaded from the Internet. All 340 images have a resolution of 800 × 600.
Fig. 3.
Responses to three natural images
Psychophysical consistency
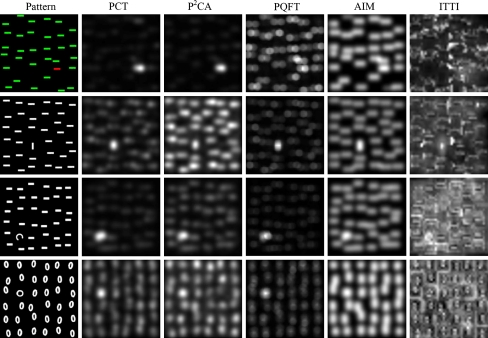
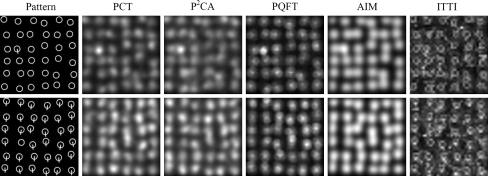
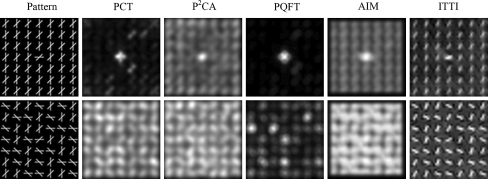
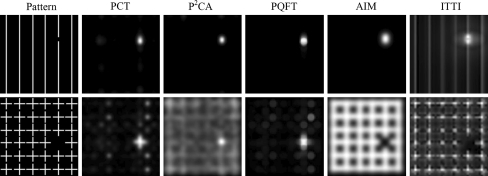
In this section we show the consistency of PCT and P2CA with some well-known properties of psychophysics, including feature pop-out, search asymmetry, conjunction search and missing items. For each psychophysical pattern, we calculate the saliency maps for PCT, P2CA and 3 state-of-the-art attention models: PQFT from Guo and Zhang (2010), AIM from Bruce and Tsotsos (2009), and ITTI from Itti et al. (1998). The results are shown in Figs. 4, 5, 6 and 7.
Fig. 4.
Responses to color pop-out and orientation pop-out
Fig. 5.
Responses to search asymmetry
Fig. 6.
Responses to conjunction search
Fig. 7.
Responses to missing items
Figure 4 shows four psychophysical patterns of color pop-out and orientation pop-out. In each pattern, one salient object is present. The first pattern is an example of color pop-out. The pop-out locations for PCT and P2CA are consistent with perception, but for PQFT, AIM and ITTI, the disparity between saliency values of target and distracters are not as clear. The second pattern is an orientation pop-out, where the target possessing a vertical bar pops out from distracters of uniformly horizontal bars. PCT, PQFT, AIM highlight the salient location successfully, but P2CA and ITTI fail in this case. In the third pattern, a target curve among distracter bars is perceptually salient. The pop-out locations for all 5 models are consistent with perception, but for ITTI the disparity between saliency value of target and distracters is unclear. In the fourth pattern, a target “O” among distracters “0” is salient object. PCT, P2CA and PQFT identify the target, but AIM and ITTI fail in this case.
Search asymmetry is a psychophysical phenomenon in human visual behavior (Treisman and Souther 1985; Treisman and Gormican 1988). Figure 5 gives an example of such search asymmetry. A unique target “Q” in the top row pops out from distracters “O”. However, when the target and distracters become switched as in the bottom row, the target “O” among distracters “Q” does not pop out. In general, targets with an added feature are perceptually salient, whereas targets with a missing feature do not pop out (Treisman and Gelade 1980). PCT, P2CA, PQFT, and AIM have such pop-out asymmetry like human beings, but ITTI fails in this test.
A target with a unique feature from its distracters pops out, but a target does not pop out when it contains no single unique feature but a unique conjunction of two or more features, which makes the visual search a difficult task (Li 2006; Treisman and Sato 1990). An example of such conjunction search is shown in Fig. 6, where the target is located in the center of each pattern. The target in the top row has a horizontal bar, a feature which is unique in the visual space. Therefore, the target is perceptually salient. In the bottom row, the horizontal bar is no longer unique to the target. Rather, the target is unique in that it consists of a unique conjunction of the two oriented bars, and in this case the target does not pop out. The responses to these visual stimuli of PCT, P2CA, AIM and ITTI agree with human behavior. For PQFT, there exist large disparities between saliency values amongst distracters even when there is no pop-out.
Missing items in regularly placed distracters are also perceptually salient. Two such psychophysical patterns are shown in Fig. 7. PCT, P2CA and PQFT can locate the missing items, which agree with human behavior. AIM and ITTI fail in the second pattern.
To sum up, it can be seen that PCT is the best performer, which is highly consistent with human perception in these psychophysical patterns. P2CA and AIM miss some salient targets, and PQFT sometimes finds salient locations in patterns where there is no pop-out. ITTI offers a relatively poor performance.
Experimental validation for natural images
In this section we quantify the consistency of PCT and P2CA with fixation locations for human subjects during free viewing. For this experiment we use the dataset of 120 color images from an urban environment and corresponding eye fixations from 20 subjects, which is provided by Bruce and Tsotsos (2005). For PCT and P2CA, we resize the image to a with of 64 px and keep its aspect ratio. Once again, this spatial scale for saliency calculation is chosen following the heuristics of Itti and Koch (2000) and Fourier transform-based approaches including PQFT (Guo and Zhang 2010), which uses the same scale for this dataset.
Eye fixation prediction for natural images
A number of recent papers (e.g., Bruce and Tsotsos 2005; Harel et al. 2006; Gao et al. 2007; Tatler et al. 2005) used receiver operating characteristic (ROC) curve to evaluate a saliency map’s ability to predict human eye fixations. Given a threshold value, a saliency map can be divided into the target region and background region. According to the eye fixations from all subjects, each image can be divided into the fixation points and non-fixation points. Thus the fixation points that fall into the target region are regarded as true positive points, and the non-fixation points that fall into the target region are regarded as false positive points. The percentage of true positive points out of all fixation points is called a true positive rate (TPR), and the percentage of false positive points out of all non-fixation points is called a false positive rate (FPR). Then the ROC curve of TPR vs. FPR is generated by varying the threshold. The area under the curve is called ROC area.
We plot the ROC curve for each image using fixation data as ground truth, and then calculate average ROC area over 120 images for PCT, P2CA and 3 other state-of-the-art models: PQFT, AIM and ITTI. The results are given in Table 1. Note that larger ROC area denotes better capability of eye fixation prediction. AIM parameters for this image set are optimized by its authors to produce the best results. For ITTI, we tune the parameters to obtain as good results as possible. Results show that PCT provides the best performance, and P2CA is the second with better performance than PQFT, AIM and ITTI.
Table 1.
ROC area for state-of the art attention models according to human fixations
| Model | PCT | P2CA | PQFT | AIM | ITTI |
|---|---|---|---|---|---|
| ROC area | 0.7982 | 0.7897 | 0.7846 | 0.7816 | 0.7599 |
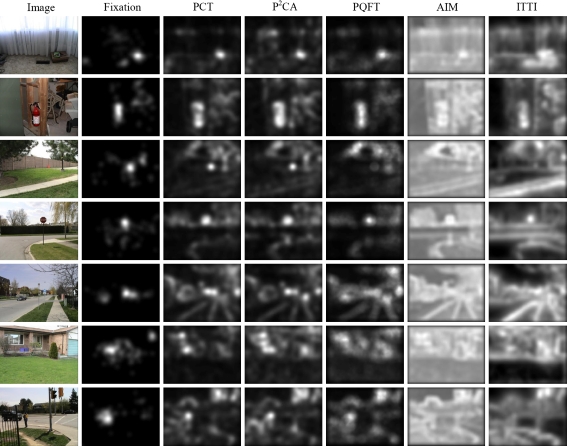
We also provide a visual comparison of saliency maps for 7 selected images in Fig. 8. A fixation density map, generated for each image by convolution of the fixation map for all subjects with a Gaussian filter, serves as ground truth (Bruce and Tsotsos 2005). It can be seen that PCT and P2CA offer better performance in both easy predictions (first 4 images) and difficult tasks (last 3 images). Good performance with respect to color pop-out is also observed with PCT and P2CA compared to the other models. For example, PCT and P2CA are able to locate a small pop-out in the 3rd image, which other models fail to detect. Besides, they find salient objects in the 5th and 6th images, whereas other models offer poor performance on these complex scenes. Note that due to top-down influences, human fixations often focus on certain objects or locations that are not as salient in a bottom–up manner. This would cause some disparities between eye fixation data and the saliency maps (the 7th image).
Fig. 8.
Test on natural images. From left: natural images from Bruce and Tsotsos (2005), corresponding fixation density maps, saliency maps generated using P2CA, PCT, PQFT, AIM and ITTI
Computational cost
An authoritative method for evaluating the computational cost of an attention model is to analyze its computational complexity. In this subsection, we initially analyze the computational complexity of our model, and then compare the time cost for 5 attention models that are implemented within the same computer platform.
Our PCT model primarily concerns a DCT transformation and an inverse DCT transformation. One classical algorithm for DCT employs the fast Fourier transform (FFT) and has the same computational complexity as FFT, i.e., O(MN log2(MN)), where the M and N denote the size of the image. Therefore, our PCT model has a computational complexity of O(MN log2(MN)). Note that PQFT also uses FFT as its basic computation and thereby has a computational complexity of approximately O(MN log2(MN)) (see Guo and Zhang 2010). For our P2CA model, we need to reshape an input image into a vector before performing a PCA transformation. Therefore, our P2CA model has a computational complexity of O((MN)2). The computational procedures of AIM and ITTI are comparatively complex (see Bruce and Tsotsos 2009; Itti et al. 1998), and some computational details were not shown in literature, but in their toolboxes that are coded in Matlab. Therefore, it is difficult for us to give a precise computational complexity of these two models.
Note that the toolboxes of PQFT, AIM and ITTI, which are employed in our experiments, are optimized by their respective authors. We compare the time cost for 5 attention models in the eye fixation prediction experiment. All 5 models are implemented using Matlab 7.0 in such computer environment as Intel 2.53 GHz CPU with 2 GB of memory. We calculate the time cost per image for each model averaged over the 120 images. The results are given in Table 2. As can be seen, PCT performs nearly three times faster than PQFT, and hundreds of times faster than ITTI and AIM. Note that P2CA is slower than PCT and PQFT due to its high computational dimensionality. However, it is still considerably faster than AIM and ITTI.
Table 2.
Average time cost per image for state-of the art attention models
| Model | PCT | P2CA | PQFT | AIM | ITTI |
|---|---|---|---|---|---|
| Time (s) | 0.0124 | 0.5509 | 0.0356 | 11.9371 | 2.7845 |
Motion saliency
Motion saliency is another important visual feature that attracts our attention (Cavanagh 1992; Treue and Trujillo 1999). It has been shown that visual motion perception is closely related to the cortical activities in the MT area (V5) (Nowlan and Sejnowski 1995). In this section we start by introducing two calculation schemes that are capable of generating motion-based saliency maps, and then continue with the description and analysis of the test results on video sequences.
Calculation schemes
Scheme 1: Practically motion-based saliency maps can be easily obtained by an attention model with the differences between consecutive frames (i.e., inter-frame differences) as input quantities. This way has already been pursued by many attention models (e.g., the PQFT model from Guo and Zhang (2010)). Given two consecutive frames X(t) and X(t – 1) at sampling time t and t – 1, a motion-based inter-frame difference is calculated as
 |
5 |
With the inter-frame difference Xmotion(t) as input quantities, Eqs. 1–3 can calculate a corresponding motion-based saliency map.
Scheme 2: On the basis of the aforementioned attention model, we propose a new scheme that is able to detect motion-based saliency. Given two consecutive frames X(t) and X(t – 1), their respective binary vectors p(t) and p(t – 1) are first calculated by Eq. 1. Then a motion-based difference vector can be calculated as
 |
6 |
Finally, a motion-based saliency map is obtained by Eqs. 2 and 3, with the vector pmotion(t) as input quantities. It should be noted that a hypothetical neural mechanism for motion-based saliency is based on Scheme 2, which will be discussed in section “Discussions”.
Test on video sequence
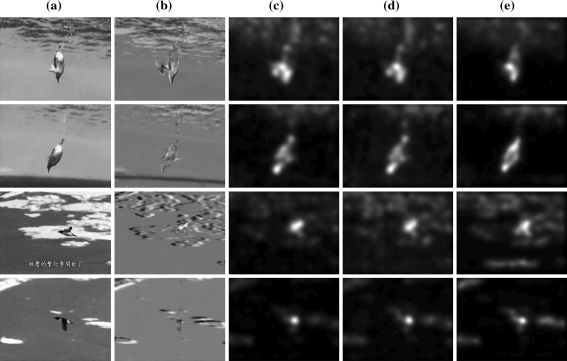
Detection of motion saliency is very important for various computer vision applications. Usually, motion saliency can be obtained by use of the differences between consecutive frames. However, motion saliency is not trivial to detect when there is ego-motion. If a camera is moving itself, the moving objects (relative to the background) is easily confounded with background variation due to the camera’s motion. This is illustrated in Fig. 9, which shows several frames from a video sequence captured with a moving camera. The camera motion introduces significant variation in the background, which makes the detection of foreground motion (the auk) a difficult task. The saliency maps produced by motion-based PCT with Schemes 1 and 2 are shown in columns (c) and (d), respectively. As can be seen, our methods are able to disregard the background variation and concentrate nearly all saliency on the animal’s body. This example shows that motion-based PCT is very robust to the presence of ego-motion. Note that the results produced by Schemes 1 and 2 are very similar. This means that the difference vectors obtained by Eq. 6 contain adequate information about motion saliency. For comparison, column (e) gives the spatiotemporal saliency maps generated by PQFT.
Fig. 9.
Test on video sequence. a Representative frames from a video sequence. b Corresponding inter-frame differences showing the presence of ego-motion. c Motion saliency maps obtained by PCT + Scheme 1. d Motion saliency maps obtained by PCT + Scheme 2. e Spatiotemporal saliency maps obtained by PQFT
Discussions
In this section we give some discussions about the proposed model and show a hypothetical neural mechanism for saliency generation.
Estimating the PCA projection vectors
PCA is a popular statistical approach, and its projection vectors can be estimated by using a collection of data samples. Theoretically, one can obtain a set of optimal or nearly optimal PCA projection vectors from far more natural images than the number of image pixels. However, a digital image may contain more than one mega pixels, and it is therefore difficult to collect sufficient image samples for an accurate estimation of the PCA projection vectors. While we down-sample the image to 64 × 64 px conforming to the heuristics described by Guo and Zhang (2010), it is still difficult for us to collect enough natural images relative to a 4096-dimensional space.
An alternative method is to employ a collection of sub-images (image patches) to estimate the PCA projection vectors. In this work we collected one million 64 × 64 sub-images that were gathered by sampling from 340 natural images. Many studies have investigated the scale invariance with respect to the statistics of natural scenes, which shows that the large-scale down-sampled images and the small-scale sub-images have the same principal components (Field 1987; Ruderman 1997). Therefore, the principal components of the sub-images can describe the down-sampled images as well.
PCT is better than P2CA
As has been mentioned before, PCA projection vectors can be obtained by some Hebbian-based neural networks. Therefore, our PCA-based model has some biological and developmental implications. Moreover, saliency information in our model can be expressed in a binary form, which mimics the firing pattern of neurons.
While our PCA-based model is biologically motivated, how well it performs depends on the choice of the training dataset. Due to data-dependency, the PCA is not suitable for all saliency detection tasks when it is obtained from finite image samples. As has been mentioned, there exists an asymptotic equivalence between DCT and the PCA for Markov-1 signals (Hamidi and Pearl 1976; Rao and Yip 1990). This means that the PCA for digital images approaches the DCT as the number of training samples tends to infinity. Thus, DCT can be considered as a PCA basis estimated from infinite image samples. Apart from data-independency, the DCT can be implemented using a fast algorithm. Therefore, in our experiments PCT is superior to P2CA in terms of both computational speed and capability of saliency detection.
Difference from DCT-based image compression
DCT has been widely used in image compression (Gonzalez and Woods 2002). Conventionally, after acquisition of an image, DCT is performed on the image using the pixel values. Afterward, many DCT coefficients that contain negligible energy are discarded before quantization and entropy coding. By this means, most digital images can be heavily compressed without much loss in perceptual quality. This technique of image compression is derived from PCA, which is optimal to retain the principal information of the original image using few components.
For our PCT model, we normalize the DCT coefficients (either positive or negative) by use of a signum function. Thus, the normalized coefficients are either –1s or 1s. Afterward, an inverse DCT is performed on these binary coefficients so as to produce the saliency information rather than the principal information of the original image. Therefore, our PCT is distinctly different from a DCT-based image compression.
A hypothetical neural mechanism
Li (2002, 2006) suggested that salience is strongly tied to primary cortical activities, and that the output firing rate of V1 neurons represents the salience of the visual input. Her spiking neuron model, which mimics lateral interactions between V1 simple cells by a recurrent network of excitatory and inhibitory weights, is capable of saliency detection. Furthermore, Li and Dayan (2006) argued that the influence of higher cortical areas on pre-attentive selection is as yet unclear. To this end, our work provides a heuristic model of saliency detection.
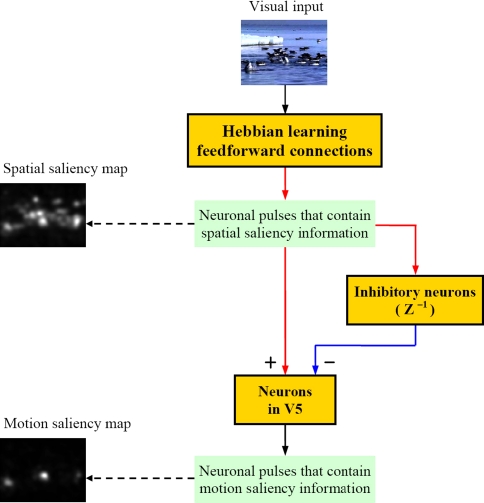
In this work we proposed a novel scheme (i.e., Scheme 2 in section “Motion saliency”) to calculate motion-based saliency maps. Can such a process as Eq. 6 be implemented in the human brain? We have no enough biological evidence. Nevertheless, we propose a hypothetical neural mechanism that is able to generate both spatial and motional saliency. A schematic depiction of this neural mechanism is shown in Fig. 10. As can be seen, the computation of salience can be accomplished in existing neural mechanism of the human brain. Equation 6 can be conducted by the interactions between inhibitory and exhibitory neurons that are connected forwardly to neurons in V5. Note that the minus sign and time delay in Eq. 6 can be produced when the neuronal pulses come through a group of inhibitory neurons. We expect that our work has a heuristic implication for future investigations on motion detection.
Fig. 10.
A hypothetical neural mechanism for saliency generation
Conclusion
In this paper we manifested that the saliency map of an image can be calculated by using the signs of the PCA coefficients. Thus, we proposed a bottom–up attention model called P2CA, which has more neurobiological and developmental plausibilities than the Fourier transform-based approaches but offers similar performance. The discovery of the PCA coefficients’ effect on visual saliency provides us with an easy way to extend the P2CA model to the PCT model, which employs the DCT coefficients of an image to obtain the saliency map. The PCT model is very simple and fast in computation, and can be potentially used in real-time saliency detection. Experimental results showed that our PCT model outperforms the state-of-the-art approaches in terms of both saliency detection and computational speed.
This paper only investigates the computational modeling of bottom–up visual attention. It has not considered a top-down influence. Future research will focus on a task-dependent attention system. It is possible to add top-down influences for developing more intelligent robot vision systems so as to accomplish various visual search tasks in engineering applications.
Note that some attention models aim at detecting salient proto-objects (e.g., Bundesen 1990; Wischnewski et al. 2010). In these models, the salient units are proto-objects rather than the image pixels, and the implementation of saliency computation is based on the medium-level visual features of proto-objects. Our work does not consider proto-objects as the elements of saliency computation. In our future works, we may modify our attention model to detect salient proto-objects that can be used for accurate image segmentation.
Acknowledgments
This work was supported in part by the National Natural Science Foundation of China under Grants 61071134 and 60672116, and in part by the National High Technology Research and Development Program of China (863 Program) under Grant 2009AA12Z115.
Contributor Information
Ying Yu, Email: yuying.mail@163.com.
Bin Wang, Email: wangbin@fudan.edu.cn.
Liming Zhang, Email: lmzhang@fudan.edu.cn.
References
- Ahmed N, Natarajan T, Rao K. Discrete cosine transform. IEEE Trans comput. 1974;23:90–93. doi: 10.1109/T-C.1974.223784. [DOI] [Google Scholar]
- Bian P, Zhang L. Visual saliency: a biologically plausible contourlet-like frequency domain approach. Cogn Neurodyn. 2010;4(3):189–198. doi: 10.1007/s11571-010-9122-0. [DOI] [PMC free article] [PubMed] [Google Scholar]
- Bruce ND, Tsotsos JK (2005) Saliency based on information maximization. In: Proceedings of NIPS 2005
- Bruce ND, Tsotsos JK. Saliency, attention, and visual search: an information theoretic approach. J Vis. 2009;9(3:5):1–24. doi: 10.1167/9.3.5. [DOI] [PubMed] [Google Scholar]
- Bundesen C. A theory of visual attention. Psychol Rev. 1990;97(4):523–547. doi: 10.1037/0033-295X.97.4.523. [DOI] [PubMed] [Google Scholar]
- Bundesen C, Habekost T. Principles of visual attention: linking mind and brain. Oxford: Oxford University Press; 2008. [Google Scholar]
- Cavanagh P. Attention-based motion perception. Science. 1992;257(5076):1563–1565. doi: 10.1126/science.1523411. [DOI] [PubMed] [Google Scholar]
- Cavanaugh JR, Bair W, Movshon JA. Orientation-selective setting of contrast gain by the surrounds of macaque striate cortex neurons. Neurosci Abstr. 1997;23:227.2. [Google Scholar]
- Clarke RJ (1981) Relation between the Karhunen Loeve and cosine transforms. In: IEE Proceedings F on communications, radar and signal processing, 128(6):359–360
- Crick F, Koch C. Constraints on cortical and thalamic projections: the no-strong-loops hypothesis. Nature. 1998;391:245–250. doi: 10.1038/34584. [DOI] [PubMed] [Google Scholar]
- Desimone R, Duncan J. Neural mechanisms of selective visual attention. Annu Rev Neurosci. 1995;18:193–222. doi: 10.1146/annurev.ne.18.030195.001205. [DOI] [PubMed] [Google Scholar]
- Field DJ. Relations between the statistics of natural images and the response properties of cortical cells. J Opt Soc Am A. 1987;4(12):2379–2394. doi: 10.1364/JOSAA.4.002379. [DOI] [PubMed] [Google Scholar]
- Field DJ (1989) What the statistics of natural images tell us about visual coding. In: Proceedings of SPIE, vol 1077, pp 269–276
- Field DJ (1993) Scale-invariance and self-similar ‘wavelet’ transform: an analysis of natural scenes and mammalian visual systems. In: wavelets, fractals and fourier transforms, Oxford University Press, Oxford
- Field DJ. What is the goal of sensory coding? Neural Comput. 1994;6:559–601. doi: 10.1162/neco.1994.6.4.559. [DOI] [Google Scholar]
- Foldiak P (1989) Adaptive network for optimal linear feature extraction. In: Proceedings of the IEEE/INNS international joint conference on neural networks, vol 1, pp 401–440
- Gao D, Mahadevan V, Vasconcelos N (2007) The discriminant center-surround hypothesis for bottom–up saliency. In: Proceedings of NIPS 2007 [DOI] [PubMed]
- Golub GH, Loan CF. Matrix computation. 3. Baltimore: John Hopkins University Press; 1996. [Google Scholar]
- Gonzalez RC, Woods RE. Digital image processing. 2. Upper saddle River: Prentice Hall; 2002. [Google Scholar]
- Gu Y, Liljenstrom H. A neural network model of attention-modulated neurodynamics. Cogn Neurodyn. 2007;1:275–285. doi: 10.1007/s11571-007-9028-7. [DOI] [PMC free article] [PubMed] [Google Scholar]
- Guo C, Zhang L. A novel multiresolution spatiotemporal saliency detection model and its applications in image and video compression. IEEE Trans Imag Process. 2010;19(1):185–198. doi: 10.1109/TIP.2009.2030969. [DOI] [PubMed] [Google Scholar]
- Haab L, Trenado C, Mariam M, Strauss DJ. Neurofunctional model of large-scale correlates of selective attention governed by stimulus-novelty. Cogn Neurodyn. 2011;5:103–111. doi: 10.1007/s11571-010-9150-9. [DOI] [PMC free article] [PubMed] [Google Scholar]
- Hamidi M, Pearl J. Comparison of the cosine and fourier transforms of Markov-1 signals. IEEE Trans Acoust Speech Signal Process. Assp. 1976;24(5):428–429. doi: 10.1109/TASSP.1976.1162839. [DOI] [Google Scholar]
- Harel J, Koch C, Perona P (2006) Graph-based visual saliency. In: Proceedings of NIPS 2006
- Haykin S. Neural networks: a comprehensive foundation. 2. Upper saddle River: Prentice Hall; 2001. [Google Scholar]
- Hou X, Zhang L (2007) Saliency detection: a spectral residual approach. In: Proceedings of CVPR 2007
- Itti L, Koch C. A saliency-based search mechanism for overt and covert shifts of visual attention. V Res. 2000;40:1489–1506. doi: 10.1016/s0042-6989(99)00163-7. [DOI] [PubMed] [Google Scholar]
- Itti L, Koch C. Computational modeling of visual attention. Nature Rev Neurosci. 2001;2:194–203. doi: 10.1038/35058500. [DOI] [PubMed] [Google Scholar]
- Itti L, Koch C, Niebur E. A model of saliency-based visual attention for rapid scene analysis. IEEE Trans Pattern Anal Mach Intell. 1998;20(11):1254–1259. doi: 10.1109/34.730558. [DOI] [Google Scholar]
- Koch C, Ullman S. Shifts in selective visual attention: towards the underlying neural circuitry. Hum Neurobiol. 1985;4(4):219–227. [PubMed] [Google Scholar]
- Li Z. A saliency map in primary visual cortex. Trends Cognit Sci. 2002;6(1):9–16. doi: 10.1016/S1364-6613(00)01817-9. [DOI] [PubMed] [Google Scholar]
- Li Z. Theoretical understanding of the early visual processes by data compression and data selection. Netw Comput Neural Syst. 2006;17(4):301–334. doi: 10.1080/09548980600931995. [DOI] [PubMed] [Google Scholar]
- Li Z, Dayan P. Pre-attentive visual selection. Neural Netw. 2006;19:1437–1439. doi: 10.1016/j.neunet.2006.09.003. [DOI] [PubMed] [Google Scholar]
- Nowlan SJ, Sejnowski TJ. A selection model for motion processing in area MT of primates. J Neurosci. 1995;15(2):1195–1214. doi: 10.1523/JNEUROSCI.15-02-01195.1995. [DOI] [PMC free article] [PubMed] [Google Scholar]
- Oja E. A simplified neuron model as a principal component analyzer. J Math Bio. 1982;15:267–273. doi: 10.1007/BF00275687. [DOI] [PubMed] [Google Scholar]
- Oja E. Principal components, minor components, and linear neural networks. Neural Netw. 1992;5:927–935. doi: 10.1016/S0893-6080(05)80089-9. [DOI] [Google Scholar]
- Rao K, Yip P. Discrete cosine transform: algorithm, advantages. San Diego: applications. Academic Press; 1990. [Google Scholar]
- Ruderman DL. Origins of scaling in natural images. Vis Res. 1997;37(23):3385–3398. doi: 10.1016/S0042-6989(97)00008-4. [DOI] [PubMed] [Google Scholar]
- Sanger TD. Optimal unsupervised learning in a single-layer linear feedforward neural network. IEEE Trans Neural Netw. 1989;2:459–473. [Google Scholar]
- Shanmugam KS. Comments on discrete cosine transform. IEEE Trans Comput C. 1975;24(7):759. doi: 10.1109/T-C.1975.224301. [DOI] [Google Scholar]
- Simoncelli EP, Schwartz O (1998) Modeling surround suppression in V1 neurons with a statistically-derived normalization model. In: Proceedings of NIPS 1998
- Tatler BW, Baddeley RJ, Gilchrist ID. Visual correlates of fixation selection: effects of scale and time. V Res. 2005;45:643–659. doi: 10.1016/j.visres.2004.09.017. [DOI] [PubMed] [Google Scholar]
- Treisman AM, Gelade G. A feature-integration theory of attention. Cogn Psychol. 1980;12:97–136. doi: 10.1016/0010-0285(80)90005-5. [DOI] [PubMed] [Google Scholar]
- Treisman AM, Gormican S. Feature analysis in early vision: evidence from search asymmetries. Psychol Rev. 1988;95:14–58. doi: 10.1037/0033-295X.95.1.15. [DOI] [PubMed] [Google Scholar]
- Treisman AM, Sato S. Conjunction search revisited. J Exp Psychol Hum Percept Perform. 1990;16(3):459–478. doi: 10.1037/0096-1523.16.3.459. [DOI] [PubMed] [Google Scholar]
- Treisman AM, Souther J. Search asymmetry: a diagnostic for pre-attentive processing of separable features. J Exp Psychol Gen. 1985;114:285–310. doi: 10.1037/0096-3445.114.3.285. [DOI] [PubMed] [Google Scholar]
- Treue S, Trujillo JCM. Feature-based attention influences motion processing gain in macaque visual cortex. Nature. 1999;399:575–579. doi: 10.1038/21176. [DOI] [PubMed] [Google Scholar]
- Uenohara M, Kanade T. Optimal approximation of uniformly rotated images: relationship between Karhunen-Loeve expansion and discrete cosine transform. IEEE Trans Imag Process. 1998;7(1):116–119. doi: 10.1109/83.650856. [DOI] [PubMed] [Google Scholar]
- Weng J, Zhang Y, Hwang WS. Candid covariance-free incremental principal component analysis. IEEE Trans Patt Anal Mach Intell. 2003;25(8):1034–1040. doi: 10.1109/TPAMI.2003.1217609. [DOI] [Google Scholar]
- Wischnewski M, Belardinelli A, Schneider WX, Steil JJ. Where to look next? Combining static and dynamic proto-objects in a TVA-based model of visual attention. Cogn Comput. 2010;2:326–343. doi: 10.1007/s12559-010-9080-1. [DOI] [Google Scholar]


