

Abstract
Many clinical situations necessitate highly sensitive and reliable molecular assays; however, the achievement of such assays remains a challenge due to the inherent limitations of molecular testing methods. Here, we describe a simple and inexpensive enrichment technique that we call mutant enrichment with 3′-modified oligonucleotides (MEMO). The method is based on the use of a 3′-modified oligonucleotide primer that blocks extension of the normal allele but enables extension of the mutated allele. The performance of the technique was evaluated with respect to its ability to detect common cancer mutations in the EGFR, KRAS, BRAF, TP53, JAK2, and NPM1 genes. We achieved sensitivities of 10−2 to 10−6 using downstream Sanger sequencing, depending on the concentrations and thermodynamics of the primers. MEMO may be applicable to the quantitative real-time PCR platform and other downstream assays. This technique may be practically applicable to various medical situations.
Molecular characterization of disease-associated alleles has become an essential part of medicine and serves as a powerful tool for early or confirmatory diagnoses, therapeutic decisions, disease monitoring, and prognostic stratification, as exemplified in the case of epidermal growth factor (EGFR) mutations in lung cancers.1,2 The strength of this methodology lies in the sensitive and confident detection of trace mutant alleles among an excess of normal alleles. Many clinical situations necessitate high levels of selectivity in diagnostic assays; however, this remains challenging as a result of the dilemma of balancing high sensitivity with reliability and practicality of use. Sanger sequencing, the robust standard method, can only detect approximately 20% of mutant alleles in a background of normal alleles, whereas other, more sensitive, PCR-based assays such as restriction fragment length polymorphism, amplification refractory mutation system PCR, denaturing high-performance liquid chromatography, and real-time PCR are more limited, with accuracies below a certain level of allele minority.3 Amplification refractory mutation system PCR, the most widely used method, is an amplification strategy in which a PCR primer is designed to discriminate among templates that differ by a single nucleotide residue. This method is simple and time efficient but sometimes produces serious false-positive results because the mutant-specific primer may induce false sequences.4,5
There have been efforts to develop new molecular technologies aimed at overcoming the inherent drawbacks of prior methods. There has been particular interest in the innovation of PCR stages that enable nondestructive selection and enrichment of mutant alleles, as this can improve sensitivity and credibility of downstream assays, such as standard sequencing analysis. These recent enrichment PCR techniques include thermostable restriction endonuclease–mediated selective PCR,6 PCR clamping mediated by peptide nucleic acid (PNA)7,8 or locked nucleic acid (LNA),9 and co-amplification at lower denaturation temperature PCR.10 Each technique has its own strengths and limitations in regard to the cost, availability, or enrichment efficiency.
In the present study, we describe a simple and practical enrichment technique, mutant enrichment with 3′-modified oligonucleotides (MEMO), and we evaluate its use for detection of cancer mutations in medical specimens. The concept of this technique is similar to that of PNA/LNA-mediated PCR clamping, but the PNA or LNA is replaced by 3′-modified oligonucleotides that are much less expensive and are easy to design. Briefly, two generic primers and one blocking primer constitute the PCR reaction mixture. On the 3′-end of the blocking primer, an extension-inhibiting compound such as a C3 spacer, a C6 amine, or a phosphate is attached so that PCR cannot extend the DNA via the primer. The blocking primer encompasses the target mutation site and is complementary to the wild-type sequences. One of the two generic primers overlaps with the blocking primer by several bases, neighboring the target mutation site, and thus is in competition with the blocking primer (Figure 1A). The DNA binding of the blocking primer, which is designed to have a higher annealing temperature and to be used in a higher concentration in the reaction mixture, dominates for wild-type sequences, whereas its affinity for mutant sequences is markedly reduced due to mismatches. The loss of competition of the blocking primer enables selective amplification of mutant sequences by the generic primer pair (Figure 1B).
Figure 1.
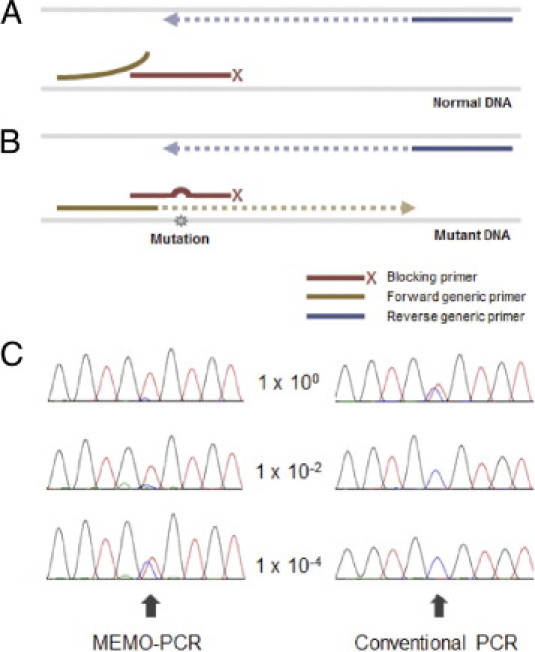
The concept of MEMO-PCR and an example of the resulting enrichment. A: The 3′-end of a blocking primer, which perfectly matches the wild-type sequence and encompasses the target mutation site, is modified with extension-inhibiting compounds such as a C3 spacer, a C6 amine, or a phosphate. The overlapping generic primer (forward primer in the figure) neighbors the mutation site and is in competition with the blocking primer for DNA binding. For normal sequences, the DNA binding of the blocking primer, which has a higher Tm and a higher concentration, dominates that of the generic primer. B: For mutant sequences, the mismatches between the blocking primer and the target sequence result in reduced affinity and increase the chance for annealing of overlapping generic primers, enabling the enrichment of mutant sequences. C: Sanger sequencing can be performed using the nonoverlapping (reverse) primer, and the example of TP53 R273C (c.817C>T) shows a typical pattern; the absence of wild-type peaks (C peak indicated with arrow) in nondiluted or modestly diluted specimens (1 × 100 and 1 × 10⁻² in the figure) due to the near-complete blockage of wild-type sequences and the presence of heterozygous peaks in more highly diluted specimens (1 × 10⁻⁴).
The performance of MEMO was evaluated based on its ability to detect common cancer mutations in the EGFR, KRAS, BRAF, TP53, JAK2, and NPM1 genes. We observed 10−2 to 10−6 orders of sensitivity by combining MEMO-PCR with downstream sequencing analysis. The sensitivity depends on the properties of the primers and the experimental conditions, as well as the nature of the mutation and its surrounding sequences.
Materials and Methods
Sample Preparation and DNA Extraction
Genomic DNA was extracted from cancer-derived cell lines containing EGFR, BRAF, JAK2, TP53, or KRAS mutations and from a bone marrow sample obtained from a patient with acute myeloid leukemia (blast count >98%) who harbored an NPM1 mutation (Table 1). All cell lines were purchased from the American Type Culture Collection or the Korean Cell Line Bank, except for an unpublished cell line with an EGFR T790M mutation, which was obtained from the Division of Hematology–Oncology, Department of Medicine at Samsung Medical Center. We isolated genomic DNA using the Wizard Genomic DNA Purification kit (Promega, Madison, WI). The concentration of extracted DNA was set to 200 ng/μL, and each cancer DNA sample was serially diluted into normal DNA at dilution factors ranging from 2 × 100 to 1 × 10⁻⁶. Normal DNA was also tested in each batch, and 230 controls were also tested with an example primer set for the BRAF mutation.
Table 1.
Common Cancer Mutations and the Best Sensitivities Achieved via MEMO-PCR and Sequencing Analysis
| Gene | Mutation | Specimen (cell line) | Best sensitivity⁎ |
|---|---|---|---|
| EGFR | L858R | H1975 | 1.0 × 10⁻³ |
| T790M | UC† | 1.0 × 10⁻⁶ | |
| Exon 19 Del15 | PC9 | 2.0 × 10⁻⁶ | |
| BRAF | V600E | SNU-790 | 1.0 × 10⁻³ |
| TP53 | R175H | CCRF-CEM | 5.0 × 10⁻⁴ |
| R248Q | Kasumi-1 | 1.0 × 10⁻³ | |
| R248W | MIA PaCa-2 | 5.0 × 10⁻⁵ | |
| R273H | H1975 | 2.0 × 10⁻⁴ | |
| R273C | SNU-1196 | 5.0 × 10⁻⁵ | |
| KRAS | G12S | A549 | 5.0 × 10⁻⁴ |
| G12C | MIA PaCa-2 | 2.0 × 10⁻⁴ | |
| G12D | CCRF-CEM | 5.0 × 10⁻⁴ | |
| G12V | Capan-1 | 2.0 × 10⁻³ | |
| G12A | SW1116 | 2.0 × 10⁻³ | |
| G13D | DLD-1 | 2.0 × 10⁻⁴ | |
| JAK2 | V617F | HEL | 2.0 × 10⁻⁵ |
| NPM1 | Exon 12 Ins4 | Patient sample | 1.0 × 10⁻⁵ |
Best sensitivity that could be obtained upon testing different sets of primers.
Unpublished cell line.
Primer Design and 3′-Modification
PCR amplification was performed using two generic primers and one blocking primer designed to encompass the target mutation site and to overlap with one of the generic primers (Tables 2, 3, 4, and 5). The 3′-ends of the four blocking primers, T790M-B1, V600E-B1, V617F-B1, and KRAS-B1, were modified by the addition of a C3 spacer, a phosphate, or an C6 amine, and each modification was tested for blocking efficiency. No differences in sensitivity were observed among the three modifications in five replicates; therefore, the C3 spacer modification was used in subsequent experiments. The melting temperature (Tm) and the Tm of the heteroduplexes from mismatched normal and mutant sequences (Tm-mismatch) of the blocking primers were calculated using the neighbor joining algorithm of SantaLucia.11
Table 2.
Primers Used in the Detection of EGFR, BRAF, and JAK2 Mutations and the Sensitivities Achieved Using Each Blocking Primer
| Mutation | Generic primer |
Blocking primer⁎ |
|||||
|---|---|---|---|---|---|---|---|
| Name | Direction | Sequence | Name | Direction | Sequence† | Sensitivity | |
| EGFR L858R | L858R-F | Sense | 5′-AGCCATAAGTCCTCGACGTG-3′ | L858R-B1 | Antisense | 5′-TGGCCAGCCCAAAATCTGTG3-3′ | 1.0 × 10⁻³ |
| L858R-Int‡ | Sense | 5′-GAGCTTCTTCCCATGATGATCT-3′ | L858R-B2 | Antisense | 5′-TTGGCCAGCCCAAAATCTGTG3-3′ | 1.0 × 10⁻³ | |
| L858R-R | Antisense | 5′-CCGCACCCAGCAGTTT-3′ | L858R-B3 | Antisense | 5′-TGGCCAGCCCAAAATCTGTGA3-3′ | 1.0 × 10⁻³ | |
| L858R-B4 | Antisense | 5′-TTGGCCAGCCCAAAATCTGTGA3-3′ | 2.0 × 10⁻³ | ||||
| EGFR T790 mol/L | T790M-F | Sense | 5′-CTCCACCGTGCAGCTCAT-3′ | T790M-B1 | Sense | 5′-TCATCACGCAGCTCATGC3-3′ | 1.0 × 10⁻² |
| T790M-R | Antisense | 5′-TTATCTCCCCTCCCCGTATC-3′ | T790M-B2 | Sense | 5′-CTCATCACGCAGCTCATGC3-3′ | 1.0 × 10⁻² | |
| T790M-Int | Antisense | 5′-CATATCCCCATGGCAAACTC-3′ | T790M-B3 | Sense | 5′-AGCTCATCACGCAGCTCAT3-3′ | 2.0 × 10⁻³ | |
| T790M-B4 | Sense | 5′-CAGCTCATCACGCAGCTCAT3-3′ | 5.0 × 10⁻⁵ | ||||
| T790M-B5 | Sense | 5′-CCACCGTGCAGCTCATCAC3-3′ | 2.0 × 10⁻³ | ||||
| T790M-B6 | Sense | 5′-GCAGCTCATCACGCAGCTC3-3′ | 1.0 × 10⁻⁶ | ||||
| T790M-B7 | Sense | 5′-GCTCATCACGCAGCTCATGC3-3′ | 2.0 × 10⁻⁶ | ||||
| T790M-B8 | Sense | 5′-GTGCAGCTCATCACGCAGCTCAT3-3′ | 1.0 × 10⁻⁶ | ||||
| BRAF V600E | V600E-F | Sense | 5′-CAGTAAAAATAGGTGATTTTGGTCTAGC-3′ | V600E-B1 | Sense | 5′-AGCTACAGTGAAATCTCGATGG3-3′ | 2.0 × 10⁻² |
| V600E-R | Antisense | 5′-CTGATTTTTGTGAATACTGGGAACT-3′ | V600E-B2 | Sense | 5′-TGGTCTAGCTACAGTGAAATCTCG3-3′ | 5.0 × 10⁻³ | |
| V600E-Int | Antisense | 5′-TTTCTAGTAACTCAGCAGCATCTCA-3′ | V600E-B3 | Sense | 5′-TCTAGCTACAGTGAAATCTCGATGG3-3′ | 1.0 × 10⁻² | |
| V600E-B4 | Sense | 5′-TTGGTCTAGCTACAGTGAAATCTCG3-3′ | 1.0 × 10⁻² | ||||
| V600E-B5 | Sense | 5′-GGTGATTTTGGTCTAGCTACAGTGA3-3′ | 1.0 × 10⁻³ | ||||
| V600E-B6 | Sense | 5′-TTTGGTCTAGCTACAGTGAAATCTCG3-3′ | 5.0 × 10⁻³ | ||||
| V600E-B7 | Sense | 5′-GTCTAGCTACAGTGAAATCTCGATGG3-3′ | 1.0 × 10⁻² | ||||
| V600E-B8 | Sense | 5′-TTTTGGTCTAGCTACAGTGAAATCTCG3-3′ | 2.0 × 10⁻³ | ||||
| V600E-B9 | Sense | 5′-GGTCTAGCTACAGTGAAATCTCGATGG3-3′ | 1.0 × 10⁻³ | ||||
| V600E-B10 | Sense | 5′-TGGTCTAGCTACAGTGAAATCTCGATGG3-3′ | 1.0 × 10⁻³ | ||||
| V600E-B11 | Sense | 5′-TTGGTCTAGCTACAGTGAAATCTCGATGG3-3′ | 2.0 × 10⁻³ | ||||
| V600E-B12 | Sense | 5′-TTTTGGTCTAGCTACAGTGAAATCTCGATGG3-3′ | 2.0 × 10⁻³ | ||||
| V600E-aF | Sense | 5′-TTATTGACTCTAAGAGGAAAGATGAAGT-3′ | V600E-aB1 | Antisense | 5′-CATCGAGATTTCACTGTAGCTAGACC3-3′ | 2.0 × 10⁻³ | |
| V600E-aInt | Sense | 5′-CCTAAACTCTTCATAATGCTTGCTC-3′ | V600E-aB2 | Antisense | 5′-TCGAGATTTCACTGTAGCTAGACCA3-3′ | 5.0 × 10⁻³ | |
| V600E-aR | Antisense | 5′-GACCCACTCCATCGAGATTT-3′ | V600E-aB3 | Antisense | 5′-TCGAGATTTCACTGTAGCTAGACCAA3-3′ | 2.0 × 10⁻³ | |
| V600E-aB4 | Antisense | 5′-ATCGAGATTTCACTGTAGCTAGACCAA3-3′ | 2.0 × 10⁻³ | ||||
| V600E-aB5 | Antisense | 5′-CATCGAGATTTCACTGTAGCTAGACCA3-3′ | 1.0 × 10⁻³ | ||||
| V600E-aB6 | Antisense | 5′-CCATCGAGATTTCACTGTAGCTAGACC3-3′ | 1.0 × 10⁻³ | ||||
| V600E-aB7 | Antisense | 5′-ATTTCACTGTAGCTAGACCAAAATCACC3-3′ | 2.0 × 10⁻³ | ||||
| V600E-aB8 | Antisense | 5′-TCCATCGAGATTTCACTGTAGCTAGACC3-3′ | 1.0 × 10⁻³ | ||||
| V600E-aB9 | Antisense | 5′-CCATCGAGATTTCACTGTAGCTAGACCA3-3′ | 2.0 × 10⁻³ | ||||
| V600E-aB10 | Antisense | 5′-ACTCCATCGAGATTTCACTGTAGCTAGACC3-3′ | 2.0 × 10⁻³ | ||||
| V600E-aB11 | Antisense | 5′-TCCATCGAGATTTCACTGTAGCTAGACCA3-3′ | 5.0 × 10⁻³ | ||||
| V600E-aB12 | Antisense | 5′-CTCCATCGAGATTTCACTGTAGCTAGACCA3-3′ | 5.0 × 10⁻² | ||||
| JAK2 V617F | V617F-F | Sense | 5′-GCATTTGGTTTTAAATTATGGAGTATG-3′ | V617F-B1 | Sense | 5′-TTAAATTATGGAGTATGTGTCTGTGGA3-3′ | 5.0 × 10⁻³ |
| V617F-R | Antisense | 5′-TGAAAAGGCCAGTTATTCCAA-3′ | V617F-B2 | Sense | 5′-AATTATGGAGTATGTGTCTGTGGAGA3-3′ | 1.0 × 10⁻² | |
| V617F-Int | Antisense | 5′-TGTTTGGGCATTGTAACCTTC-3′ | V617F-B3 | Sense | 5′-GGAGTATGTGTCTGTGGAGACGA3-3′ | 5.0 × 10⁻⁵ | |
| V617F-B4 | Sense | 5′-TGGAGTATGTGTCTGTGGAGACG3-3′ | 2.0 × 10⁻⁵ | ||||
| V617F-B5 | Sense | 5′-GAGTATGTGTCTGTGGAGACGAGA3-3′ | 1.0 × 10⁻⁴ | ||||
| V617F-B6 | Sense | 5′-TGTGTCTGTGGAGACGAGAGTAAG3-3′ | 5.0 × 10⁻³ | ||||
| V617F-B7 | Sense | 5′-GGAGTATGTGTCTGTGGAGACGAG3-3′ | 2.0 × 10⁻⁵ | ||||
| V617F-B8 | Sense | 5′-TTATGGAGTATGTGTCTGTGGAGACG3-3′ | 2.0 × 10⁻⁵ | ||||
| V617F-B9 | Sense | 5′-TGGAGTATGTGTCTGTGGAGACGA3-3′ | 5.0 × 10⁻⁵ | ||||
| V617F-B10 | Sense | 5′-AGTATGTGTCTGTGGAGACGAGAGTA3-3′ | 1.0 × 10⁻³ | ||||
| V617F-B11 | Sense | 5′-TTATGGAGTATGTGTCTGTGGAGACGA3-3′ | 5.0 × 10⁻⁵ | ||||
| V617F-B12 | Sense | 5′-GAGTATGTGTCTGTGGAGACGAGAGT3-3′ | 5.0 × 10⁻⁵ | ||||
| V617F-B13 | Sense | 5′-TGGAGTATGTGTCTGTGGAGACGAGA3-3′ | 5.0 × 10⁻⁵ | ||||
| V617F-B14 | Sense | 5′-TGGAGTATGTGTCTGTGGAGACGAGAG3-3′ | 2.0 × 10⁻⁴ | ||||
| V617F-B15 | Sense | 5′-TGGAGTATGTGTCTGTGGAGACGAGAGTAAGTAA3-3′ | 2.0 × 10⁻³ | ||||
The 3′-end of the blocking primer was modified with a C3 spacer (represented as 3′ in the primer sequence), a phosphate, or an amine.
The target mutation site is designated with underlines.
Int primers can be used for seminested PCR or downstream sequencing analysis.
Table 3.
Primers Used in the Detection of TP53 Mutations and the Sensitivities Achieved with Each Blocking Primer
| Mutation | Generic primer |
Blocking primer⁎ |
||||||
|---|---|---|---|---|---|---|---|---|
| Name | Direction | Sequence | Name | Direction | Sequence† | Sensitivity | ||
| R175H | ||||||||
| TP53 R175H | R75H-F | Sense | 5′-CACATGACGGAGGTTGTGAG-3′ | R75H-B1 | Sense | 5′-AGGCGCTGCCCCCACCA3-3′ | 2.0 × 10⁻³ | |
| R75H-R | Antisense | 5′-CATAGGGCACCACCACACTA-3′ | R75H-B2 | Sense | 5′-AGGCGCTGCCCCCACCAT3-3′ | 5.0 × 10⁻⁴ | ||
| R75H-Int | Antisense | 5′-ACACGCAAATTTCCTTCCAC-3′ | ||||||
| R248Q | R248W | |||||||
| TP53 R248Q | Int48Q-F | Sense | 5′-CATGGGCGGCATGAA-3′ | R248Q-B1 | Sense | 5′-GAACCGGAGGCCCATC3-3′ | 5.0 × 10⁻² | 1.0 × 10⁻² |
| /R248W | Int48Q-R | Antisense | 5′-TCCCAAAGCCAGAGAAAAGA-3′ | R248Q-B2 | Sense | 5′-ATGAACCGGAGGCCCATC3-3′ | 1.0 × 10⁻³ | 5.0 × 10⁻⁴ |
| Int48Q-Int | Antisense | 5′-GGGATGTGATGAGAGGTGGA-3′ | R248Q-B3 | Sense | 5′-AACCGGAGGCCCATCCT3-3′ | 2.0 × 10⁻³ | 1.0 × 10⁻³ | |
| R248Q-B4 | Sense | 5′-GAACCGGAGGCCCATCCT3-3′ | 1.0 × 10⁻³ | 1.0 × 10⁻⁴ | ||||
| R248Q-B7 | Sense | 5′-CATGAACCGGAGGCCCATC3-3′ | 1.0 × 10⁻³ | 2.0 × 10⁻⁴ | ||||
| R248Q-B8 | Sense | 5′-ATGAACCGGAGGCCCATCCT3-3′ | 2.0 × 10⁻³ | 1.0 × 10⁻⁴ | ||||
| R248Q-B9 | Sense | 5′-GCATGAACCGGAGGCCCATC3-3′ | 1.0 × 10⁻² | 5.0 × 10⁻⁵ | ||||
| R273H | R273C | |||||||
| TP53 R273H | Int73H-F | Sense | 5′-GGGACGGAACAGCTTTGAG-3′ | R273H-B1 | Sense | 5′-CTTTGAGGTGCGTGTTTGTG3-3′ | 5.0 × 10⁻² | 5.0 × 10⁻² |
| /R273C | Int73H-R | Antisense | 5′-TGCTAGGAAAGAGGCAAGGA-3′ | R273H-B2 | Sense | 5′-TTGAGGTGCGTGTTTGTGC3-3′ | 5.0 × 10⁻² | 5.0 × 10⁻² |
| Int73H-Int | Antisense | 5′-TAACTGCACCCTTGGTCTCC-3′ | R273H-B3 | Sense | 5′-CAGCTTTGAGGTGCGTGTTT3-3′ | 5.0 × 10⁻² | 5.0 × 10⁻² | |
| R273H-B4 | Sense | 5′-GCTTTGAGGTGCGTGTTTGT3-3′ | 5.0 × 10⁻² | 5.0 × 10⁻² | ||||
| R273H-B5 | Sense | 5′-TTTGAGGTGCGTGTTTGTGC3-3′ | 2.0 × 10⁻² | 2.0 × 10⁻² | ||||
| R273H-B6 | Sense | 5′-CAGCTTTGAGGTGCGTGTTTG3-3′ | 1.0 × 10⁻² | 1.0 × 10⁻² | ||||
| R273H-B7 | Sense | 5′-GCTTTGAGGTGCGTGTTTGTG3-3′ | 1.0 × 10⁻² | 2.0 × 10⁻² | ||||
| R273H-B8 | Sense | 5′-AGCTTTGAGGTGCGTGTTTGT3-3′ | 5.0 × 10⁻² | 5.0 × 10⁻² | ||||
| R273H-B9 | Sense | 5′-GCTTTGAGGTGCGTGTTTGTGC3-3′ | 1.0 × 10⁻³ | 5.0 × 10⁻⁴ | ||||
| R273H-B10 | Sense | 5′-ACAGCTTTGAGGTGCGTGTTTGT3-3′ | 2.0 × 10⁻³ | 2.0 × 10⁻³ | ||||
| R273H-B11 | Sense | 5′-AGCTTTGAGGTGCGTGTTTGTGC3-3′ | 2.0 × 10⁻⁴ | 5.0 × 10⁻⁵ | ||||
| R273H-B12 | Sense | 5′-TTGAGGTGCGTGTTTGTGCCTGT3-3′ | 5.0 × 10⁻⁴ | 1.0 × 10⁻⁴ | ||||
The 3′-end of the blocking primer was modified with a C3 spacer (represented as 3 in the primer sequence), a phosphate, or an amine.
The target mutation site is designated with underlines.
Table 4.
Primers Used in the Detection of KRAS Mutations and the Sensitivities Achieved with Each Blocking Primer
| Mutation | Generic primer⁎ |
Blocking primer† |
Sensitivity |
|||||||||
|---|---|---|---|---|---|---|---|---|---|---|---|---|
| Name | Direction | Sequence | Name | Direction | Sequence‡ | G12S | G12C | G12D | G12V | G12A | G13D | |
| KRAS | KRAS-F | Sense | 5′-CTGAATATAAACTTGTGGTAGTTGGAG-3′ | KRAS-B1 | Sense | 5′-GGAGCTGGTGGCGTAGG3-3′ | 1.0 × 10⁻³ | 5.0 × 10⁻⁴ | 5.0 × 10⁻³ | 1.0 × 10⁻² | 5.0 × 10⁻³ | 5.0 × 10⁻⁴ |
| G12S | KRAS-R | Antisense | 5′-TTGAAACCCAAGGTACATTTCA-3′ | KRAS-B2 | Sense | 5′-GTTGGAGCTGGTGGCGTA3-3′ | 5.0 × 10⁻⁴ | 5.0 × 10⁻⁴ | 1.0 × 10⁻³ | 5.0 × 10⁻³ | 2.0 × 10⁻³ | 1.0 × 10⁻³ |
| /G12C | KRAS-Int | Antisense | 5′-AGAATGGTCCTGCACCAGTAA-3′ | KRAS-B3 | Sense | 5′-TTGTGGTAGTTGGAGCTGGT3-3′ | 5.0 × 10⁻⁴ | 2.0 × 10⁻⁴ | 5.0 × 10⁻⁴ | 2.0 × 10⁻³ | 2.0 × 10⁻³ | NA |
| /G12D | KRAS-B4 | Sense | 5′-AGTTGGAGCTGGTGGCGTA3-3′ | 2.0 × 10⁻³ | 5.0 × 10⁻⁴ | 2.0 × 10⁻³ | 5.0 × 10⁻³ | 5.0 × 10⁻³ | 2.0 × 10⁻⁴ | |||
| /G12A | KRAS-B5 | Sense | 5′-AGCTGGTGGCGTAGGCAAG3-3′ | 1.0 × 10⁻² | 5.0 × 10⁻² | 2.0 × 10⁻² | 5.0 × 10⁻² | 1.0 × 10⁻² | 2.0 × 10⁻² | |||
| /G13D | KRAS-B6 | Sense | 5′-AGTTGGAGCTGGTGGCGTAG3-3′ | 1.0 × 10⁻³ | 5.0 × 10⁻⁴ | 5.0 × 10⁻³ | 5.0 × 10⁻³ | 1.0 × 10⁻² | 1.0 × 10⁻³ | |||
| KRAS-B7 | Sense | 5′-GTTGGAGCTGGTGGCGTAGG3-3′ | 1.0 × 10⁻³ | 5.0 × 10⁻⁴ | 5.0 × 10⁻³ | 1.0 × 10⁻² | 1.0 × 10⁻² | 1.0 × 10⁻³ | ||||
| KRAS-B8 | Sense | 5′-GTAGTTGGAGCTGGTGGCGTAG3-3′ | 1.0 × 10⁻³ | 2.0 × 10⁻⁴ | 5.0 × 10⁻³ | 2.0 × 10⁻² | 2.0 × 10⁻² | 1.0 × 10⁻³ | ||||
| KRAS-B9 | Sense | 5′-GGTAGTTGGAGCTGGTGGCGTA3-3′ | 2.0 × 10⁻³ | 5.0 × 10⁻⁴ | 1.0 × 10⁻² | 1.0 × 10⁻² | 2.0 × 10⁻² | 5.0 × 10⁻³ | ||||
| KRAS-B10 | Sense | 5′-TGGTAGTTGGAGCTGGTGGCGTAG3-3′ | 2.0 × 10⁻² | 5.0 × 10⁻³ | 2.0 × 10⁻² | 1.0 × 10⁻² | 2.0 × 10⁻² | 2.0 × 10⁻² | ||||
NA, Not applicable because the target mutation site is outside of the coverage area of the blocking primer.
For pyrosequencing, the following generic primers were used: KRAS-PYRO-F, 5′-TATAAACTTGTGGTAGTTGGAGCT-3′; KRAS-PYRO-R, 5′-Biotin-TCGTCCACAAAATGATTCTGA-3′; KRAS-PYRO-Int, 5′-CTTGTGGTAGTTGGAGC-3′).
The 3′-end of the blocking primer was modified with a C3 spacer (represented as 3 in the primer sequence), a phosphate, or an amine.
The target mutation site is designated with underlines.
Table 5.
Primers Used in the Detection of Insertion or Deletion Mutations in EGFR and NPM1 and the Sensitivities Achieved with Each Blocking Primer
| Mutation | Generic primer |
Blocking primer⁎ |
|||||
|---|---|---|---|---|---|---|---|
| Name | Direction | Sequence | Name | Direction | Sequence† | Sensitivity | |
| EGFR Del15 | DEL15-F | Sense | 5′-AAAATTCCCGTCGCTATCAA-3′ | DEL15-B1 | Sense | 5′-TCAAGGAATTAAGAGAAGCAACATC-3′ | 2.0 × 10⁻² |
| DEL15-R | Antisense | 5′-TGTCTCTAAGGGGAGGGAGTT-3′ | DEL15-B2 | Sense | 5′-ATCAAGGAATTAAGAGAAGCAACATCT-3′ | 1.0 × 10⁻² | |
| DEL15-Int | Antisense | 5′-TGTGGAGATGAGCAGGGTCT-3′ | DEL15-B3 | Sense | 5′-CAAGGAATTAAGAGAAGCAACATCTCC-3′ | 5.0 × 10⁻⁴ | |
| DEL15-B4 | Sense | 5′-CTATCAAGGAATTAAGAGAAGCAACATCTCC-3′ | 5.0 × 10⁻⁵ | ||||
| DEL15-B5 | Sense | 5′-GTCGCTATCAAGGAATTAAGAGAAGCAACATCT-3′ | 1.0 × 10⁻⁵ | ||||
| DEL15-B6 | Sense | 5′-CTATCAAGGAATTAAGAGAAGCAACATCTCCGAAA-3′ | 5.0 × 10⁻⁶ | ||||
| DEL15-B7 | Sense | 5′-GTCGCTATCAAGGAATTAAGAGAAGCAACATCTCC-3′ | 2.0 × 10⁻⁶ | ||||
| NPM1 Ins4 | NPM1-F | Sense | 5′-TTTTTCCAGGCTATTCAAGA-3′ | NPM1-B1 | Sense | 5′-CAAGATCTCTGGCAGTGG3-3′ | 2.0 × 10⁻⁴ |
| NPM1-R1 | Antisense | 5′-TAAACAGGCATTTTGGACA-3′ | NPM1-B2 | Sense | 5′-CAAGATCTCTGGCAGTGGA3-3′ | 2.0 × 10⁻⁴ | |
| NPM1-Int | Antisense | 5′-AACACGGTAGGGAAAGTTCT-3′ | NPM1-B3 | Sense | 5′-TCAAGATCTCTGGCAGTGG3-3′ | 5.0 × 10⁻⁴ | |
| NPM1-B4 | Sense | 5′-TTCAAGATCTCTGGCAGTGG3-3′ | 2.0 × 10⁻⁴ | ||||
| NPM1-B5 | Sense | 5′-CAAGATCTCTGGCAGTGGAG3-3′ | 2.0 × 10⁻⁴ | ||||
| NPM1-B6 | Sense | 5′-TCAAGATCTCTGGCAGTGGAG3-3′ | 2.0 × 10⁻⁴ | ||||
| NPM1-B7 | Sense | 5′-CTATTCAAGATCTCTGGCAGTGG3-3′ | 2.0 × 10⁻⁴ | ||||
| NPM1-B8 | Sense | 5′-TTCAAGATCTCTGGCAGTGGAG3-3′ | 2.0 × 10⁻⁴ | ||||
| NPM1-B9 | Sense | 5′-ATTCAAGATCTCTGGCAGTGGAG3-3′ | 2.0 × 10⁻⁴ | ||||
| NPM1-B10 | Sense | 5′-CTATTCAAGATCTCTGGCAGTGGA3-3′ | 5.0 × 10⁻⁴ | ||||
| NPM1-B11 | Sense | 5′-AAGATCTCTGGCAGTGGAGGAA3-3′ | 5.0 × 10⁻⁵ | ||||
| NPM1-B12 | Sense | 5′-GATCTCTGGCAGTGGAGGAAGT3-3′ | 5.0 × 10⁻⁵ | ||||
| NPM1-B13 | Sense | 5′-CAAGATCTCTGGCAGTGGAGGA3-3′ | 2.0 × 10⁻⁴ | ||||
| NPM1-B14 | Sense | 5′-CTATTCAAGATCTCTGGCAGTGGAG3-3′ | 5.0 × 10⁻⁴ | ||||
| NPM1-B15 | Sense | 5′-ATTCAAGATCTCTGGCAGTGGAGGA3-3′ | 5.0 × 10⁻⁵ | ||||
| NPM1-B16 | Sense | 5′-TTCAAGATCTCTGGCAGTGGAGGAA3-3′ | 5.0 × 10⁻⁵ | ||||
| NPM1-B17 | Sense | 5′-TTCAAGATCTCTGGCAGTGGAGGAAG3-3′ | 5.0 × 10⁻⁵ | ||||
| NPM1-B18 | Sense | 5′-TTCAAGATCTCTGGCAGTGGAGGAAGTCT3-3′ | 1.0 × 10⁻⁵ | ||||
The 3′-end of the blocking primer was modified with a C3 spacer (represented as 3 in the primer sequence), a phosphate, or an amine.
The target mutation site is designated with underlines.
PCR Reaction
The PCR reaction was performed using the AccuPower HF PCR PreMix (Bioneer, Daejeon, Korea) containing a hot-start, high-fidelity polymerase; buffers (10× reaction mixture: 300 mmol/L of KCl, 25 mmol/L of MgCl2); and reagents [0.3 mmol/L of deoxynucleotide triphosphate (dNTP)]. The reaction mixture included 200 ng of DNA, 10 pmol of each generic primer, and 50 pmol of the blocking primer (the amount of blocking primer was experimentally optimized to 50 pmol; Figure 2A). The PCR was performed using a 9600 Thermal Cycler (Applied Biosystems, Foster City, CA), and the cycling conditions were as follows: 94°C for 5 minutes, 50 cycles of the main reaction (94°C for 30 seconds, 59°C for 30 seconds, and 72°C for 60 seconds), and 72°C for 7 minutes. For the NPM1 reactions, the annealing temperature of the main reaction was 55°C.
Figure 2.
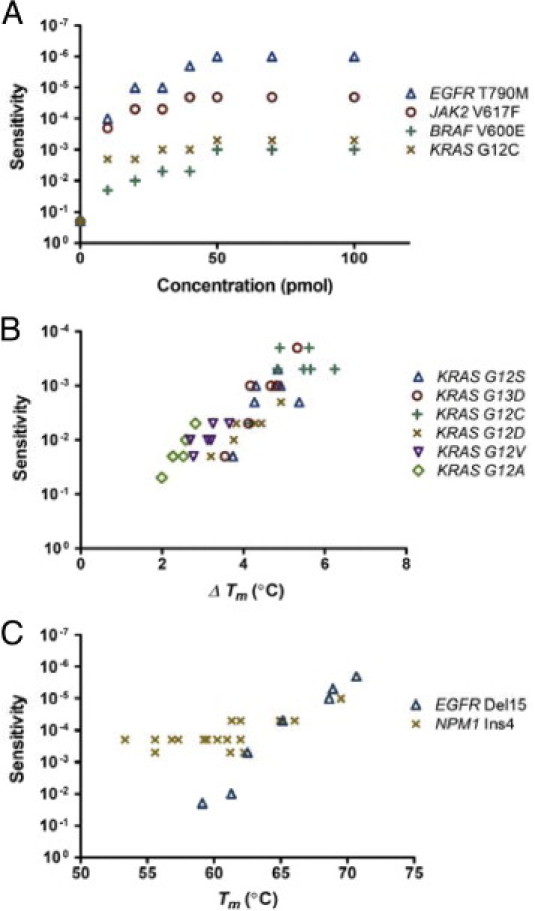
Primers and experimental conditions correlate with sensitivity. A: Sensitivity was improved when the amount of blocking primers increased in excess of the amount of generic primers, reaching a plateau around the ratio of 5:1 (50 pmol of blocking primers per 10 pmol of generic primers). B: The ΔTm correlated well with the sensitivity for detecting different mutations on the KRAS codon 12. C: For small deletion/insertion mutations, blocking primers with a higher Tm generally yielded superb sensitivities.
Sequencing Analysis and Defining Sensitivity
After the amplification reaction, the amplicons were treated with shrimp alkaline phosphatase and exonuclease I (USB Corp., Cleveland, OH). Cycle sequencing was performed on an ABI Prism 3130xl Genetic Analyzer with the BigDye Terminator Cycle Sequencing Ready Reaction kit (Applied Biosystems). The results were analyzed using the Sequencher 4.10 program (Gene Codes, Ann Arbor, MI), in which abnormal peaks, those 20% higher than normal peaks, were considered to be positive. Sensitivity was defined as the lowest proportion of mutant DNA that could be consistently detected (>20% of normal peak) in duplicated MEMO-PCR and Sanger sequencing experiments.
Other Downstream Assays
Real-time PCR and high-resolution melting analyses were conducted using the Rotor-Gene Q (Qiagen, Valencia, CA) in the presence of BEBO dye (TATAA Biocenter, Göteborg, Sweden). Serially diluted samples containing the EGFR T790M mutation were amplified with the blocking primer T790M-B6. Data were analyzed using the Corbett Rotor-Gene 6000 Application Software version 1.7 (Qiagen). Pyrosequencing was performed for diluted samples harboring KRAS mutations on an PSQ96MA (Biotage, Uppsala, Sweden) instrument using the PyroMark Gold Q96 Reagents (Qiagen). The PCR reaction used a blocking primer (KRAS-B2) and biotin-labeled generic primers (Table 4) with conditions identical to those used for Sanger sequencing except for the annealing stage (58°C for 30 seconds). Fluorescence PCR was performed for the 15-bp deletion in the EGFR exon 19 and for the 4-bp insertion in the NPM1 exon 12. The overlapping generic primers (DEL15-F and NPM1-F) were 5′-FAM labeled. The amplicon fragments were analyzed according to size on the ABI Prism 3130xl Genetic Analyzer using GeneScan Software (Applied Biosystems).
Results
Performance Optimization and Sensitivity According to Sequencing Analysis
In the first set of conditions, the blocking efficiencies of the three 3′-modifications, including a C3 spacer, a phosphate, and a C6 amine, were investigated using PCR amplification in combination with other nonoverlapping generic primers, which naturally produced no PCR products. No significant differences in sensitivity were observed among the three modifications in five replicates; therefore, the C3 spacer modification was used for the following optimization and validation processes.
The evaluation and validation of the method were conducted by defining the sensitivity using serial dilutions of DNA from tumor-derived cell lines or from patient samples containing well-established hot-spot mutations in different genes. These mutations included L858R and T790M in EGFR; R175H, R248Q, R248W, R273H, and R273C in TP53; G12C, G12D, G12S, G12A, G12V, and G13D in KRAS; V600E in BRAF; and V617F in JAK2. Microdeletion/duplication mutations, including a 15-bp deletion in EGFR exon 19 and a 4-bp insertion in NPM1 exon 12, were also examined. Two hundred nanograms of genomic DNA for each positive control were serially diluted into normal DNA. MEMO-PCR with subsequent sequencing analysis was performed, and the resulting sensitivity was defined as the minimum proportion of mutant DNA that could consistently be detected in duplicated runs. By adjusting primer concentrations and applying different sets of blocking and generic primers, we attempted to optimize conditions for the best sensitivity without compromising reliability.
As shown in Figure 1C, a typical result of MEMO-PCR and sequencing was the absence of wild-type peaks in nondiluted or modestly diluted specimens due to the near-complete blocking of wild-type sequences and the presence of heterozygous peaks in more excessively diluted specimens. Sensitivity was improved when the blocking primers where overrepresented compared to the generic primers, reaching plateaus around the ratio of 5:1 (Figure 2A). Therefore, 50 pmol of blocking primers for every 10 pmol of generic primers were used in subsequent experiments. The blocking and mutation-neighboring generic primers were recommended to overlap by 3 bp or more as only 1 or 2 bp of overlap often fails to achieve sufficient sensitivity.
Sensitivity also varied among the different primers for each mutation (Tables 2, 3, 4, and 5). As a rule, blocking primers performed better when the Tm was higher than the annealing temperature of the PCR reaction (usually 59°C in these experiments). On the other hand, there was a trend of insufficient sensitivity at very high Tm. The differences between Tm and Tm-mismatch (ΔTm) correlated well with sensitivity when blocking primers overlapping with generic primers by less than 3 bp were excluded from analysis. Low-ΔTm mutations, such as BRAF V600E, generally demonstrated only moderate degrees of sensitivity, whereas high-ΔTm mutations, such as EGFR T790M, demonstrated excellent sensitivity; this trend was more pronounced for the various mutations in KRAS codons 12 and 13 (Figures 2B). For small deletion/insertion mutations, where destabilizing effects from mismatched duplexes would be great, blocking primers with a higher Tm generally yielded excellent sensitivities (Figure 2C and Table 5). Collectively, Table 1 summarizes the cancer mutations evaluated and the best sensitivities achieved via downstream sequencing analyses.
Analytical Validation of the Assay: An Example of BRAF Mutation
We performed the assay with a negative control (normal DNA) in each batch and found no apparent false positives in any of the controls. Additionally, we performed a control study with an example set of BRAF primers using 230 normal DNAs and did not find any false positives on the target site, suggesting high specificity of this method. Very infrequently, we observed nonspecific aberrant peaks around the target site but never at the target site. Those aberrant peaks were not observed in the subsequent replication, suggesting that they may have originated from polymerase errors.
The assay was also shown to perform very well for different types of specimens. With an example primer set for BRAF mutations (V600E-F, V600E-R, and V600E-B5; predicted amplicon size of 220 bp), we tested the assay using frozen tumor tissues, thyroid aspirates fixed in ThinPrep (Cytyc Corporation, Boxborough, MA), and formalin-fixed paraffin-embedded tissues from 15 patients with papillary thyroid cancer. MEMO-PCR and sequencing were successful with all types of specimens, with mutation-positive rates of 13 of 15, 14 of 15, and 14 of 15, respectively, for the three specimen types.
Because the performance of PCR with degraded samples such as formalin-fixed paraffin-embedded tissues generally depends on the amplicon size, the generic primers should be designed to produce short PCR products (100 to 250 bp) when applied to such samples.
Because one of the generic primers is located very close to the mutation site, it is difficult to perform bidirectional Sanger sequencing using the MEMO-PCR method. To resolve this problem, we designed several alternative BRAF primer sets targeted to the opposite strand. MEMO-PCR using those primers enabled Sanger sequencing in the opposite direction and strong confirmation of the presence of a mutation (Table 2).
Using an example primer set for BRAF mutations, we tested three different commercial Taq polymerases including HS Prime Taq Premix (GeNet Bio, Nonsan, Korea), 2× TOPsimple DyeMIX-multi HOT (Enzynomics, Daejeon, Korea), and AccuPower HF PCR premix (Bioneer).
In duplicated runs for serially diluted samples, we found no differences in the sensitivities among the three polymerases.
Potential Applications for Quantification and High-Resolution Melting Analysis
MEMO may potentially be applied to quantitative real-time PCR and/or subsequent melting curve analysis. For serially diluted specimens with the EGFR T790M mutation, we performed a real-time PCR and high-resolution melting analysis using a DNA-intercalating fluorescence dye. In quadruple runs, the variation of the threshold cycle (CT) values was within 0.6, an acceptable range. The CT values in dilutions containing large amounts of mutant DNA were lower than those with smaller amounts, with the resulting standard curve demonstrating a very linear correlation (r2 = 0.991; Figure 3, A and B). This linear association was evident in dilutions ranging from 1.0 × 100 to 1.0 × 10⁻³, though not in dilutions below 1.0 × 10⁻⁴. Although MEMO-PCR and Sanger sequencing showed sensitivities up to 1.0 × 10⁻⁶, MEMO-PCR and melting curve analysis showed ambiguous patterns in samples with very low mutant concentrations (from 1.0 × 10⁻⁶ to 1.0 × 10⁻⁴). This might be attributed to the fact that the resolution of melting curve analysis is affected by many factors including template or final DNA concentrations.12–14
Figure 3.
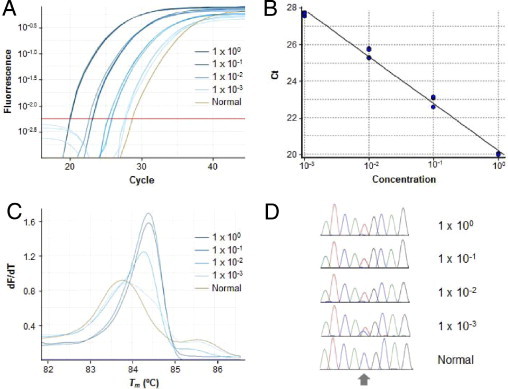
Potential applicability of MEMO to quantitative real-time PCR and/or subsequent melting curve analysis. A: An example of serially diluted specimens with EGFR T790M mutations detected through a real-time PCR assay using a DNA-intercalating fluorescence dye illustrates different fluorescence curves according to the mutant allele concentration. B: The standard curves generated in quadruplicate runs have a very linear correlation (r2 = 0.991) in dilutions ranging from 1.0 × 100 to 1.0 × 10⁻³ (PCR efficiency: 1.45). C: Subsequent high-resolution melting curve analysis demonstrates a higher Tm (84.3°C to 84.4°C) in dilutions with a high mutant allele concentration (1.0 × 100, 1.0 × 10⁻¹, and 1.0 × 10⁻²) compared to that of normal samples (83.7°C), whereas samples with low mutant allele concentrations (1.0 × 10⁻³) produce heterozygous melting curves. D: Amplicons were sequenced, and the results were in concordance with those of the high-resolution melting curve analysis (ie, homozygous mutant peaks in samples with a high mutant allele concentration and heterozygous peaks in those with a low mutant allele concentration). The target mutation site is indicated with an arrow.
An experiment using the EGFR T790M mutation illustrates that dilutions with large amounts of mutant DNA (1.0 × 100, 1.0 × 10⁻¹, and 1.0 × 10⁻²) had higher Tms (84.3–84.4°C) than normal samples (83.7°C), possibly due to the greater stabilities of the mutant homoduplexes. Samples with a low mutant DNA concentration (1.0 × 10⁻³) demonstrated heterozygous melting peaks, in agreement with the sequencing results (Figure 3, C and D).
Improved Performance of Fluorescence PCR and Fragment Analysis
Small insertion/deletion mutations can also be detected using size-based separation via fluorescence PCR and fragment analysis. The MEMO method was examined for its ability to detect two hot-spot mutations in the EGFR and NPM1 genes. The EGFR mutations, important molecular markers for targeted therapy in lung cancers, occur in exon 19 as a 15-bp deletion in approximately half of the cases.1,2 The blocking primers were designed to include virtually all known exon 19 mutations, with the best primer sets detecting a 1.0 × 10⁻⁶ proportion of minor alleles via downstream fluorescence fragment analysis, which demonstrated an abnormal peak 15 bp shorter than the normal peak. The NPM1 gene is the most commonly mutated gene in acute myeloid leukemia with a normal karyotype, and these mutations typically arise as 4-bp insertions in exon 12.15 The best primer sets could detect mutations in concentrations up to 1.0 × 10⁻⁵ of the minority using MEMO-PCR and downstream fluorescence fragment analysis (Figure 4, A and B).
Figure 4.
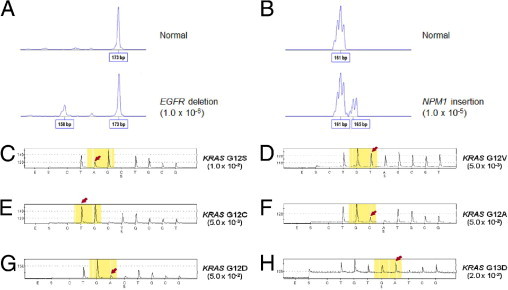
Mutations identified by MEMO-PCR. A and B: MEMO-PCR with fluorescence primers and subsequent fragment analysis identifies a 15-bp deletion in EGFR exon 19 at a 1.0 × 10⁻⁶ dilution and a 4-bp insertion in NPM1 exon 12 at a 1.0 × 10⁻⁵ dilution. MEMO-PCR and pyrosequencing demonstrates increased sensitivities in the specimens with KRAS mutations. C:KRAS c.34G>A (G12S) in 1.0 × 10⁻². D:KRAS c.35G>T (p.G12V) in 5.0 × 10⁻³. E:KRAS c.34G>T (p.G12C) in 5.0 × 10⁻³. F:KRAS c.35G>C (p.G12A) in 5.0 × 10⁻². G:KRAS c.35G>A (p.G12D) in 5.0 × 10⁻². H:KRAS c.38G>A (G13D) in 2.0 × 10⁻² of allele minorities. Arrows indicate mutant sequences enriched.
Improved Pyrosequencing Performance
For downstream assays, pyrosequencing is also a good choice for the detection of sequence variations. We tested the MEMO method for diluted DNAs harboring KRAS G12S, G12C, G12D, G12V, G12A, and G13D mutations using a blocking primer and biotin-labeled generic primers designed for pyrosequencing. The observed sensitivities were 1.0 × 10⁻², 5.0 × 10⁻³, 5.0 × 10⁻², 5.0 × 10⁻³, 5.0 × 10⁻², and 2.0 × 10⁻², respectively, and no abnormal peaks were observed in the normal DNAs tested in parallel (Figure 4, C to H).
Discussion
Selection or enrichment of minority alleles can be achieved through various techniques, most of which take advantage of differences in electrostatic forces, enzymatic recognition, or thermodynamic properties between wild-type and variant alleles. One of the more recent methods receiving great attention is based on thermodynamics, owing to the easy applicability and wide availability of downstream analysis techniques, especially the robust Sanger sequencing method. The co-amplification at lower denaturation temperature PCR technique utilizes differences in the Tms of PCR amplicons between wild-type and mutant (or mismatched) DNA sequences.10 This technique simply adjusts the denaturation temperatures during the PCR cycle and requires no additional steps or costs. An advantage of this technique is that multiple targets within the amplified region can be enriched. The amplicons are usually 60- to 200-bp long, with a resultant Tm difference of approximately 0.5°C to 1.5°C. Such subtle differences, however, may not provide clear discrimination between wild-type and mutant DNA, which is responsible for the low enrichment rate and difficulty in adequate thermal control.3
The PNA/LNA-mediated PCR clamping technique is, in a sense, a method based on thermal differentiation. PNA is a DNA mimic in which the phosphoribose backbone is replaced by a peptide-like repeat of 2-aminoethyl-glycine units. These PNA/DNA hybrids have greater thermal stabilities than those of DNA/DNA hybrids, and the PNA oligomers cannot be extended by DNA polymerases.16 LNA is a modified RNA nucleotide in which the ribose moiety is modified with an extra bridge connecting the 2′ oxygen and the 4′ carbon.17 The ΔTms between matched and mismatched PNA/DNA or LNA/DNA duplexes usually exceed 10°C, sufficient for the selection of minor variant alleles with sensitive detection.16,18 Unlike other commonplace methods, such as amplification refractory mutation system PCR, this method can enrich different base changes on the target sites using a single wild-type–specific PNA/LNA. In principle, this does not aberrantly alter the wild-type sequences and leads to much lower false-positive rates.3 The PNA/LNA-mediated clamping technique has been used for over a decade and is an attractive method that has proven to be potentially applicable to many situations, including the examination of various cancer mutations,8,19–23 identification of viral or bacterial variants,24,25 genotyping for single-base substitutions,26,27 detection of low-level somatic mosaicism28 or mitochondrial heteroplasmy,29,30 and prenatal diagnosis via maternal plasma,31 among many others. However, the high cost and limited availability have restricted its usage.
The MEMO-PCR described here operates on a principle similar to those of the PNA/LNA-mediated methods and is also found to be dependent on thermodynamics. Due to the similarity of their principles, MEMO may exhibit all of the strengths of LNA/PNA-mediated methods: the simplicity of performance, variability of downstream assays, excellent sensitivity, and a very low probability of false positives. Although the ΔTms of the modified oligonucleotides may be somewhat moderate compared to those of the PNA/DNA or LNA/DNA complexes, the optimization of experimental conditions could improve sensitivity to comparable levels. The sensitivity of the MEMO-PCR correlates well with the ΔTm, whereas a blocking primer with an excessively high Tm fails to achieve acceptable sensitivity. This phenomenon may be explained by the competition between generic and blocking primers; the blocking primer tends to bind more strongly to the normal target sequence due to its high Tm (ideally higher than the annealing temperature of PCR), whereas it loses the affinity for mismatched mutant sequences and become less competitive with the generic primer. A much lower Tm-mismatch than the original Tm (ie, a larger ΔTm) would give rise to competition loss and clear discrimination. This effect is maximized when the Tm-mismatch is lower than the annealing temperature of the PCR reaction, as most of the mismatched primer-DNA duplexes would dissociate during the annealing step. In contrast, a blocking primer with a higher Tm-mismatch will still bind to the mutant DNA at the annealing temperature, hindering the binding of the generic primers. From our data and experience, a quick and fail-safe tip for primer design may include: i) designing a generic primer pair (product size: 100 to 250 bp) with primer close to the mutation site (2∼10 bp distance); ii) designing a blocking primer to encompass the center of the mutation site with a Tm 2∼5°C higher than that of the generic primer for point mutations and 5∼10°C higher for insertion/deletion mutations; and iii) checking that the blocking primer and generic primer overlap by three or more base pairs.
Because the thermodynamics of DNA or primer binding may vary widely according to the experimental conditions, such as DNA or primer concentrations, salt or deoxynucleotide triphosphate concentrations, and ramping speed of individual PCR instruments, it is recommended that each laboratory establish individualized reaction conditions. The options for the 3′ modification may be practically unlimited since all materials that prevent the incorporation of additional bases at the primer end are candidates, including C3/C6/C12/C18 spacers, C6 amines, phosphates, biotin, di-deoxynucleotide triphosphate (ddNTP), and ethylene glycol. Because oligonucleotides with such modifications can be synthesized from many commercial services, the primers used in MEMO are more easily available and the reagent cost may be much lower (probably less than one tenth) than those of PNA/LNA methods. Nonetheless, the enrichment efficiency of MEMO will be comparable to that of PNA/LNA when conditions are optimized. Limitations of our method are that only mutations in a known target region (within the coverage of blocking primers) can be enriched, and sensitivities may vary according to different base substitutions in the same target region.
In a similar but not identical approach, the concept of using 3′-modified oligonucleotides has been suggested by Seyama et al32 who used ddNTP-modified primers. They designed blocking primers that did not overlap with generic primers; such a protocol requires a mutant Taq polymerase with no 5′-exonuclease activity and may show somewhat low efficiency. In the present study, we attempted to determine the optimal conditions that produce the optimal enrichment efficiency. The potential applications of MEMO include all situations in which minority alleles of clinical significance are present and sensitive detection is required. In addition to the application of MEMO to detect cancer mutations, it can also be used in other situations, such as variant strain identification in infectious diseases (for example, the YMDD mutation in hepatitis B virus infection and antiviral drug–resistant variants in human immunodeficiency virus infection), minor mutant allele detection in patients with low-level somatic mosaicism or mitochondrial heteroplasmy, and characterization of fetal mutations from maternal plasma samples.
Footnotes
Supported by a grant of the Korea Health Care Technology R&D Project, Ministry for Health & Welfare Affairs, Republic of Korea (A092255 and A101485).
References
- 1.Kobayashi S., Boggon T.J., Dayaram T., Janne P.A., Kocher O., Meyerson M., Johnson B.E., Eck M.J., Tenen D.G., Halmos B. EGFR mutation and resistance of non-small-cell lung cancer to gefitinib. N Engl J Med. 2005;352:786–792. doi: 10.1056/NEJMoa044238. [DOI] [PubMed] [Google Scholar]
- 2.Maheswaran S., Sequist L.V., Nagrath S., Ulkus L., Brannigan B., Collura C.V., Inserra E., Diederichs S., Iafrate A.J., Bell D.W., Digumarthy S., Muzikansky A., Irimia D., Settleman J., Tompkins R.G., Lynch T.J., Toner M., Haber D.A. Detection of mutations in EGFR in circulating lung-cancer cells. N Engl J Med. 2008;359:366–377. doi: 10.1056/NEJMoa0800668. [DOI] [PMC free article] [PubMed] [Google Scholar]
- 3.Milbury C.A., Li J., Makrigiorgos G.M. PCR-based methods for the enrichment of minority alleles and mutations. Clin Chem. 2009;55:632–640. doi: 10.1373/clinchem.2008.113035. [DOI] [PMC free article] [PubMed] [Google Scholar]
- 4.Newton C.R., Graham A., Heptinstall L.E., Powell S.J., Summers C., Kalsheker N., Smith J.C., Markham A.F. Analysis of any point mutation in DNA: The amplification refractory mutation system (ARMS) Nucleic Acids Res. 1989;17:2503–2516. doi: 10.1093/nar/17.7.2503. [DOI] [PMC free article] [PubMed] [Google Scholar]
- 5.Lo Y.M.D., Chiu R.W.K., Chan K.C.A. 2nd ed. Humana Press; Totowa, NJ: 2006. Clinical applications of PCR. [Google Scholar]
- 6.Ward R., Hawkins N., O'Grady R., Sheehan C., O'Connor T., Impey H., Roberts N., Fuery C., Todd A. Restriction endonuclease-mediated selective polymerase chain reaction: a novel assay for the detection of K-ras mutations in clinical samples. Am J Pathol. 1998;153:373–379. doi: 10.1016/S0002-9440(10)65581-2. [DOI] [PMC free article] [PubMed] [Google Scholar]
- 7.Nielsen P.E., Egholm M., Berg R.H., Buchardt O. Sequence-selective recognition of DNA by strand displacement with a thymine-substituted polyamide. Science. 1991;254:1497–1500. doi: 10.1126/science.1962210. [DOI] [PubMed] [Google Scholar]
- 8.Sun X., Hung K., Wu L., Sidransky D., Guo B. Detection of tumor mutations in the presence of excess amounts of normal DNA. Nature Biotechnol. 2002;20:186–189. doi: 10.1038/nbt0202-186. [DOI] [PubMed] [Google Scholar]
- 9.Dominguez P.L., Kolodney M.S. Wild-type blocking polymerase chain reaction for detection of single nucleotide minority mutations from clinical specimens. Oncogene. 2005;24:6830–6834. doi: 10.1038/sj.onc.1208832. [DOI] [PubMed] [Google Scholar]
- 10.Li J., Wang L., Mamon H., Kulke M.H., Berbeco R., Makrigiorgos G.M. Replacing PCR with COLD-PCR enriches variant DNA sequences and redefines the sensitivity of genetic testing. Nat Med. 2008;14:579–584. doi: 10.1038/nm1708. [DOI] [PubMed] [Google Scholar]
- 11.SantaLucia J., Jr. A unified view of polymer, dumbbell, and oligonucleotide DNA nearest-neighbor thermodynamics. Proc Natl Acad Sci U S A. 1998;95:1460–1465. doi: 10.1073/pnas.95.4.1460. [DOI] [PMC free article] [PubMed] [Google Scholar]
- 12.Schutz E., von Ahsen N. Influencing factors of dsDNA dye (high-resolution) melting curves and improved genotype call based on thermodynamic considerations. Anal Biochem. 2009;385:143–152. doi: 10.1016/j.ab.2008.10.045. [DOI] [PubMed] [Google Scholar]
- 13.Ririe K.M., Rasmussen R.P., Wittwer C.T. Product differentiation by analysis of DNA melting curves during the polymerase chain reaction. Anal Biochem. 1997;245:154–160. doi: 10.1006/abio.1996.9916. [DOI] [PubMed] [Google Scholar]
- 14.Varga A., James D. Real-time RT-PCR and SYBR Green I melting curve analysis for the identification of Plum pox virus strains C. EA, and W: effect of amplicon size, melt rate, and dye translocation. J Virol Methods. 2006;132:146–153. doi: 10.1016/j.jviromet.2005.10.004. [DOI] [PubMed] [Google Scholar]
- 15.Schlenk R.F., Dohner K., Krauter J., Frohling S., Corbacioglu A., Bullinger L., Habdank M., Spath D., Morgan M., Benner A., Schlegelberger B., Heil G., Ganser A., Dohner H. Mutations and treatment outcome in cytogenetically normal acute myeloid leukemia. N Engl J Med. 2008;358:1909–1918. doi: 10.1056/NEJMoa074306. [DOI] [PubMed] [Google Scholar]
- 16.Orum H., Nielsen P.E., Egholm M., Berg R.H., Buchardt O., Stanley C. Single base pair mutation analysis by PNA directed PCR clamping. Nucleic Acids Res. 1993;21:5332–5336. doi: 10.1093/nar/21.23.5332. [DOI] [PMC free article] [PubMed] [Google Scholar]
- 17.Kaur H., Arora A., Wengel J., Maiti S. Thermodynamic, counterion, and hydration effects for the incorporation of locked nucleic acid nucleotides into DNA duplexes. Biochemistry. 2006;45:7347–7355. doi: 10.1021/bi060307w. [DOI] [PubMed] [Google Scholar]
- 18.You Y., Moreira B.G., Behlke M.A., Owczarzy R. Design of LNA probes that improve mismatch discrimination. Nucleic Acids Res. 2006;34:e60. doi: 10.1093/nar/gkl175. [DOI] [PMC free article] [PubMed] [Google Scholar]
- 19.Shinozaki M., O'Day S.J., Kitago M., Amersi F., Kuo C., Kim J., Wang H.J., Hoon D.S. Utility of circulating B-RAF DNA mutation in serum for monitoring melanoma patients receiving biochemotherapy. Clin Cancer Res. 2007;13:2068–2074. doi: 10.1158/1078-0432.CCR-06-2120. [DOI] [PMC free article] [PubMed] [Google Scholar]
- 20.Jiang S.X., Yamashita K., Yamamoto M., Piao C.J., Umezawa A., Saegusa M., Yoshida T., Katagiri M., Masuda N., Hayakawa K., Okayasu I. EGFR genetic heterogeneity of nonsmall cell lung cancers contributing to acquired gefitinib resistance. Int J Cancer. 2008;123:2480–2486. doi: 10.1002/ijc.23868. [DOI] [PubMed] [Google Scholar]
- 21.Beau-Faller M., Legrain M., Voegeli A.C., Guerin E., Lavaux T., Ruppert A.M., Neuville A., Massard G., Wihlm J.M., Quoix E., Oudet P., Gaub M.P. Detection of K-Ras mutations in tumour samples of patients with non-small cell lung cancer using PNA-mediated PCR clamping. Br J Cancer. 2009;100:985–992. doi: 10.1038/sj.bjc.6604925. [DOI] [PMC free article] [PubMed] [Google Scholar]
- 22.Hu Y., Le Leu R.K., Young G.P. Detection of K-ras mutations in azoxymethane-induced aberrant crypt foci in mice using LNA-mediated real-time PCR clamping and mutant-specific probes. Mutat Res. 2009;677:27–32. doi: 10.1016/j.mrgentox.2009.05.003. [DOI] [PubMed] [Google Scholar]
- 23.Chen C.Y., Shiesh S.C., Wu S.J. Rapid detection of K-ras mutations in bile by peptide nucleic acid-mediated PCR clamping and melting curve analysis: comparison with restriction fragment length polymorphism analysis. Clin Chem. 2004;50:481–489. doi: 10.1373/clinchem.2003.024505. [DOI] [PubMed] [Google Scholar]
- 24.Ohishi W., Shirakawa H., Kawakami Y., Kimura S., Kamiyasu M., Tazuma S., Nakanishi T., Chayama K. Identification of rare polymerase variants of hepatitis B virus using a two-stage PCR with peptide nucleic acid clamping. J Med Virol. 2004;72:558–565. doi: 10.1002/jmv.20026. [DOI] [PubMed] [Google Scholar]
- 25.Takiya T., Horie Y., Futo S., Matsumoto Y., Kawai K., Suzuki T. Rapid selection of nonhotspot mutants among hisD+ revertants of Salmonella typhimurium TA98 in Ames test by peptide nucleic acid (PNA)-mediated PCR clamping. J Biosci Bioeng. 2003;96:588–590. doi: 10.1016/S1389-1723(04)70156-5. [DOI] [PubMed] [Google Scholar]
- 26.Behn M., Schuermann M. Simple and reliable factor V genotyping by PNA-mediated PCR clamping. Thromb Haemost. 1998;79:773–777. [PubMed] [Google Scholar]
- 27.Johnson M.P., Haupt L.M., Griffiths L.R. Locked nucleic acid (LNA) single nucleotide polymorphism (SNP) genotype analysis and validation using real-time PCR. Nucleic Acids Res. 2004;32:e55. doi: 10.1093/nar/gnh046. [DOI] [PMC free article] [PubMed] [Google Scholar]
- 28.Kalfa N., Philibert P., Audran F., Ecochard A., Hannon T., Lumbroso S., Sultan C. Searching for somatic mutations in McCune-Albright syndrome: a comparative study of the peptidic nucleic acid versus the nested PCR method based on 148 DNA samples. Eur J Endocrinol. 2006;155:839–843. doi: 10.1530/eje.1.02301. [DOI] [PubMed] [Google Scholar]
- 29.Murdock D.G., Christacos N.C., Wallace D.C. The age-related accumulation of a mitochondrial DNA control region mutation in muscle, but not brain, detected by a sensitive PNA-directed PCR clamping based method. Nucleic Acids Res. 2000;28:4350–4355. doi: 10.1093/nar/28.21.4350. [DOI] [PMC free article] [PubMed] [Google Scholar]
- 30.Hancock D.K., Schwarz F.P., Song F., Wong L.J., Levin B.C. Design and use of a peptide nucleic acid for detection of the heteroplasmic low-frequency mitochondrial encephalomyopathy, lactic acidosis, and stroke-like episodes (MELAS) mutation in human mitochondrial DNA. Clin Chem. 2002;48:2155–2163. [PubMed] [Google Scholar]
- 31.Galbiati S., Restagno G., Foglieni B., Bonalumi S., Travi M., Piga A., Sbaiz L., Chiari M., Damin F., Smid M., Valsecchi L., Pasi F., Ferrari A., Ferrari M., Cremonesi L. Different approaches for noninvasive prenatal diagnosis of genetic diseases based on PNA-mediated enriched PCR. Ann N Y Acad Sci. 2006;1075:137–143. doi: 10.1196/annals.1368.018. [DOI] [PubMed] [Google Scholar]
- 32.Seyama T., Ito T., Hayashi T., Mizuno T., Nakamura N., Akiyama M. A novel blocker-PCR method for detection of rare mutant alleles in the presence of an excess amount of normal DNA. Nucleic Acids Res. 1992;20:2493–2496. doi: 10.1093/nar/20.10.2493. [DOI] [PMC free article] [PubMed] [Google Scholar]