Abstract
PURPOSE
To evaluate the repeatability and inter-operator reproducibility of the Pascal dynamic contour tonometry (DCT), Ocular Response Analyzer (ORA) and Goldmann applanation tonometer(GAT) in a single population of normal subjects.
METHODS
The study included fifty-two eyes from 26 normal subjects. One operator measured the intraocular pressure (IOP) with each tonometer three times while two additional operators each measured the IOP with each tonometer once. Repeatability and reproducibility were assessed by the coefficient of Variation (CV) and Intraclass Correlation Coefficient (ICC). Agreement among tonometers was also assessed using Bland-Altman plots.
RESULTS
The mean age of included subjects was 31.5 ±8.8 years and 15 (58%) were female. In general, both intra-operator repeatability and inter-operator reproducibility were significantly higher for DCT compared to the other tonometers. Intra-operator DCT (CV = 3.7, ICC = 0.89), GAT (CV = 9.7, ICC = 0.79), IOPg (CV = 7.0, ICC = 0.79) and IOPcc (CV = 9.8, ICC = 0.57). Inter-operator DCT (CV=6.1, ICC = 0.73), GAT (CV=9.0, ICC=0.82) and IOPg (CV=10.8, ICC = 0.63), IOPcc (CV=11.7, ICC = 0.49)
CONCLUSION
Overall, DCT was significantly more repeatable and reproducible than GAT, IOPg and IOPcc. The better reproducibility of the DCT may result in more precise measurements for monitoring intraocular pressure changes over time compared to GAT and ORA.
Keywords: Intraocular pressure, Repeatability, Reproducibility, Goldmann applanation tonometry, dynamic contour tonometry, ocular response analyzer, waveform score
Background
Intraocular pressure (IOP) is currently the only modifiable risk factor for glaucoma development and progression. Therefore, precise IOP estimations are crucial for proper management of these patients. The ideal tonometer is expected to be accurate, repeatable, reproducible and minimally influenced by factors such as corneal properties and different examiners. Nevertheless, the gold-standard Goldmann applanation tonometer (GAT) (Haag-Streit AG, Koeniz, Switzerland) is widely known to be affected by corneal properties, which can result in considerable measurement errors.1, 2The Pascal® dynamic contour tonometer (DCT) (Ziemer Ophthalmic Systems AG, Port, Switzerland) and the Reichert® Ocular Response Analyzer (ORA) (Reichert, Delpew, NY) are two novel methods designed to be less affected by corneal biomechanical properties. With any new innovation, thorough evaluation of the technology will translate into more informed use of the medical device and thus improve patient care.
Previous studies including glaucomatous and normal eyes reported the DCT to have a better intra- and inter-operator reproducibility than the GAT, and found ORA to have a four times greater variability than GAT.2–5 However, more recent studies including glaucomatous, ocular hypertensive and normal eyes showed that the DCT, ORA and GAT had no significant differences in measurement variability.6, 7 Differences in the populations may explain the different results between these studies.
The purpose of the current study was to evaluate the repeatability and inter-operator reproducibility of DCT, ORA and GAT in a single population of normal subjects.
Methods
Subjects
Fifty-two eyes from 26 healthy subjects were included in the study. The mean age was 31.5 ±8.8 years and 15 (58%) were female. There were 14 (54%) Caucasian, 10 (39%) Asian, and 2 (7%) African-American subjects. Informed consent was obtained from all patients, and all methods adhered to the tenets of the Declaration of Helsinki.
Healthy subjects were recruited from volunteers within the Shiley Eye Center. Subjects had open angles on gonioscopy, normal appearing optic nerves, and no history of elevated IOP or any other ocular history of note. Test-retest reproducibility measures variability over time by administering the same test to the same subjects at different points in time. Variability may come from changes related to the subject being examined, to the instrument or to the operator. Our purpose was to determine some of the components of the short-term variability with each one of the tonometers. During a single visit, the IOP of each eye was measured three times by one masked operator and one time each by two additional masked operators using the GAT, DCT and ORA. The order of the tonometers was randomized for each patient with an approximate 30-second pause between each measurement taken with the same tonometer and a 2 minute pause between measurements taken by different tonometers. There was a 3-minute lapse in the measurements taken between each one of the three operators (AT, GV and SD). The tonometer operators had at least 5 years of experience with the GAT, and at least 3 years of experience with the ORA and DCT, this included 3 months of preliminary training with the relatively newer tonometers (ORA and DCT) prior to collecting any study data.
Goldmann Applanation Tonometry(GAT)
The Goldmann applanation tonometer is currently the gold standard for IOP measurements and indirectly obtains the IOP based on the Imbert-Fick principle.1 One of the drawbacks of GAT is its subjectivity, which may affect how we interpret consecutive results in a same patient. In order to reduce any bias due to prior knowledge of the IOP, we covered the tonometer dial. The dial was also reset before each measurement and a separate observer recorded the results. In addition, there may be some considerable fluctuation in the IOP measurement whether it is obtained on the systolic or diastolic phases of the cardiac cycle. To standardize the GAT method, all operators were instructed to obtain IOP measurements at the systolic phase (i.e the higher measurement during the cycle).
Dynamic Contour Tonometry (DCT)
The Pascal® Dynamic Contour Tonometer utilizes Pascal’s Law of Hydrostatic Pressure and the assumption of a uniform corneal contour to measure the IOP. Due to the concave design of the tip, and the fact that IOP is measured by a sensor located at the center, there is no need for applanation of the cornea. This theoretically reduces the corneal effects on IOP measurement.6 Further details of its principles of operation have been reported previously.6 The quality score of the instrument ranges from 1 to 5 with 1 being optimal and 5 being poor quality. Based on the manufacturer’s recommendation, we only included measurements with a score of 1 to 3.7
Ocular Response Analyzer (ORA)
The Reichert® Ocular Response Analyzer is a noncontact tonometer that measures IOP by applanating the cornea with a pulse of air. The details of its technology have been published elsewhere.8–10 In brief, at the moment the air reaches the cornea, it exerts an inward pressure which leads to corneal applanation, and then to corneal concavity. Milliseconds later, the air flow ceases and the outward rebound of the cornea leads to a second corneal applanation. P1 represents the pressure of applanation upon inward corneal motion and P2 the pressure of applanation upon outward motion of the cornea.8 The average of P1 and P2 is reported as the Goldmann-correlated IOP (IOPg). In addition to IOP measurements, the ORA also provides two parameters that may be related to specific biomechanical properties of the cornea: the corneal hysteresis (CH, the difference between P1 and P2) and the corneal resistance factor (CRF, an algorithm-modified difference between P1 and P2).8 The CRF is then used to further adjust the IOP measurements, reported as corneal corrected IOP (IOPcc).9 We also recorded the ORA waveform score, which is a fairly new parameter developed to assess ORA measurement reliability. No studies have yet supported the use of a cutoff for the waveform score; therefore we did not use this parameter to exclude ORA tests. In our study, we report a mean ORA waveform score of 6.2 with a range from 0.74 to 9.76.
Statistical Analysis
We assessed both intra-operator and inter-operator reproducibility of IOP measurements. For intra-operator analysis, we evaluated the repeatability between the three measurements obtained by a single operator. For each eye, a coefficient of variation (CV) was calculated as the ratio of the standard deviation of the three measurements obtained by the same operator and the corresponding mean. For inter-operator analysis, we evaluated the reproducibility between measurements obtained from the three operators. For each eye, a CV was obtained as the ratio of the standard deviation of three measurements obtained by the three different operators and the corresponding mean.11, 12 Intraclass correlation coefficients (ICC) were also used to evaluate inter- and intra-operator variability. 13, 14 ICCs above 0.75 are usually considered to indicate good reproducibility. We used a bootstrap re-sampling technique to assess whether any differences in CV or ICC among the tonometers were statistically significantly different from zero.13, 15, 16 In addition, the agreement between measurements within each tonometer was assessed using Bland-Altman plots.17 We also calculated 95% limits of agreement for each comparison (mean difference ± 1.96 SD), which indicate how far apart 2 measurements by the same operator, by 2 different operators, or by 2 different methods were more likely to be for most individuals.
Lastly, linear regression analysis was used to study the influence of factors such as IOP, CH, CRF and ORA waveform score on the variability. STATA (STATA version 9.0; StataCorp, College Station, TX) and R-statistical software (R version 2.11.1; downloaded 2010-4-20)18 were used for the analysis.
Results
Overall, IOPs were highest for DCT (mean ±SD:15.7 ± 2.0 mmHg), followed by IOPcc (15.2 ± 2.8 mmHg), IOPg (14.6 ± 2.7 mmHg) and were lowest for GAT (13.5 ± 3.2 mmHg).
Table 1 shows estimates of intra-operator variability for each tonometer along with the differences among tonometers. The intra-operator variability of the DCT (CV = 3.7, ICC = 0.89) was significantly lower than that of GAT (CV = 9.7, ICC = 0.79), IOPg (CV = 7.0, ICC = 0.79) and IOPcc (CV = 9.8, ICC = 0.57). Except for IOPcc, all other tonometers showed good repeatability, with ICC values above 0.75. IOPcc had an ICC of only 0.57. GAT and IOPg had similar ICCs but GAT had a larger CV than IOPg.
Table 1.
Differences in the Coefficients of Variation (CV) and Intraclass Correlation Coefficients (ICC) calculated to compare the variability of the different tonometers for serial measurements obtained by one operator.
| Tonometer Pairs | Coefficient of Variation (CV) | Intraclass Correlation Coefficient (ICC) | |||||||||
|---|---|---|---|---|---|---|---|---|---|---|---|
| 1 | 2 | CV 1 | CV2 | Mean Difference |
Std Error |
95% CI† | ICC 1 | ICC 2 | Mean Difference |
Variance | 95% CI† |
| DCT | GAT | 3.7 | 9.7 | −6.0 | 0.80 | −7.4 to −4.2* | 0.89 | 0.79 | 0.10 | 0.002 | 0.03 to 0.17* |
| DCT | IOPcc | 3.7 | 9.8 | −6.1 | 0.85 | −7.7 to −4.4* | 0.89 | 0.57 | 0.32 | 0.006 | 0.21 to 0.45* |
| DCT | IOPg | 3.7 | 7.0 | −3.3 | 0.59 | −4.4 to −2.1* | 0.89 | 0.79 | 0.10 | 0.002 | 0.05 to 0.18* |
| IOPg | GAT | 7.0 | 9.7 | −2.7 | 0.96 | −4.6 to −0.8* | 0.79 | 0.79 | 0.00 | 0.002 | −0.09 to 0.07 |
| IOPg | IOPcc | 7.0 | 9.8 | −2.8 | 0.56 | −3.9 to −1.6* | 0.79 | 0.57 | 0.22 | 0.003 | 0.14 to 0.32* |
| IOPcc | GAT | 9.8 | 9.7 | 0.1 | 1.10 | −2.0 to 2.3 | 0.57 | 0.79 | −0.22 | 0.007 | −0.37 to −0.11* |
DCT: dynamic contour tonometer; GAT: Goldmann applanation tonometer; IOPg: Ocular Response Analyzer-Goldmann Estimated; IOPcc: Ocular Response Analyzer-Corneal Correlated.
Confidence intervals were obtained by bootstrapping, with 1000 replications.
Statistically significant differences - assessed by confidence intervals (CI) that did not include the zero.
Table 2 shows the estimates of inter-operator variability for all tonometers and the comparisons between the different tonometers. The inter-operator CV for the DCT (6.1) was significantly lower than that of GAT (9.0), IOPg (10.8) and IOPcc (11.7) (Table 2). Furthermore, the DCT ICC (0.73) was significantly higher than the IOPcc (0.49). There was no significant difference between the reproducibility of DCT (ICC = 0.73) with that of IOPg (ICC = 0.63). IOPcc had significantly lower reproducibility (ICC = 0.49) than all other methods. Even though the ORA is fully automated and seemingly less dependent on operator technique for acquisition, both IOPg and IOPcc showed more variability among measurements obtained by different operators than GAT and DCT.
Table 2.
Differences in the Coefficients of Variation (CV) and Intraclass Correlation Coefficients (ICC) calculated to compare the variability of the different tonometers for measurements obtained by different operators.
| Tonometer Pairs | Coefficient of Variation (CV) | Intraclass Correlation Coefficient (ICC) | |||||||||
|---|---|---|---|---|---|---|---|---|---|---|---|
| 1 | 2 | CV 1 | CV2 | Mean Difference |
Std Error |
95% CI† | ICC 1 | ICC 2 | Mean Difference |
Variance | 95% CI† |
| DCT | GAT | 6.1 | 9.0 | −2.9 | 0.86 | −4.6 to −1.2* | 0.73 | 0.82 | −0.09 | 0.003 | −0.20 to −0.01* |
| DCT | IOPcc | 6.1 | 11.7 | −5.6 | 0.96 | −7.3 to −3.6* | 0.73 | 0.49 | 0.24 | 0.008 | 0.12 to 0.40* |
| DCT | IOPg | 6.1 | 10.8 | −4.7 | 0.92 | −6.4 to −2.8* | 0.73 | 0.63 | 0.10 | 0.005 | −0.02 to 0.21 |
| IOPg | GAT | 10.8 | 9.0 | 1.8 | 1.01 | −0.1 to 3.7 | 0.63 | 0.82 | −0.19 | 0.005 | −0.33 to −0.10* |
| IOPg | IOPcc | 10.8 | 11.7 | −0.9 | 0.69 | −2.2 to 0.5 | 0.63 | 0.49 | 0.14 | 0.005 | 0.04 to 0.28* |
| IOPcc | GAT | 11.7 | 9.0 | 2.7 | 1.17 | 0.4 to 5.0* | 0.49 | 0.82 | −0.33 | 0.009 | −0.54 to −0.21* |
DCT: dynamic contour tonometer; GAT: Goldmann applanation tonometer; IOPg: Ocular Response Analyzer-Goldmann Estimated; IOPcc: Ocular Response Analyzer-Corneal Correlated.
Confidence intervals were obtained by bootstrapping, with 1000 replications.
Statistically significant differences - assessed by confidence intervals (CI) that did not include the zero.
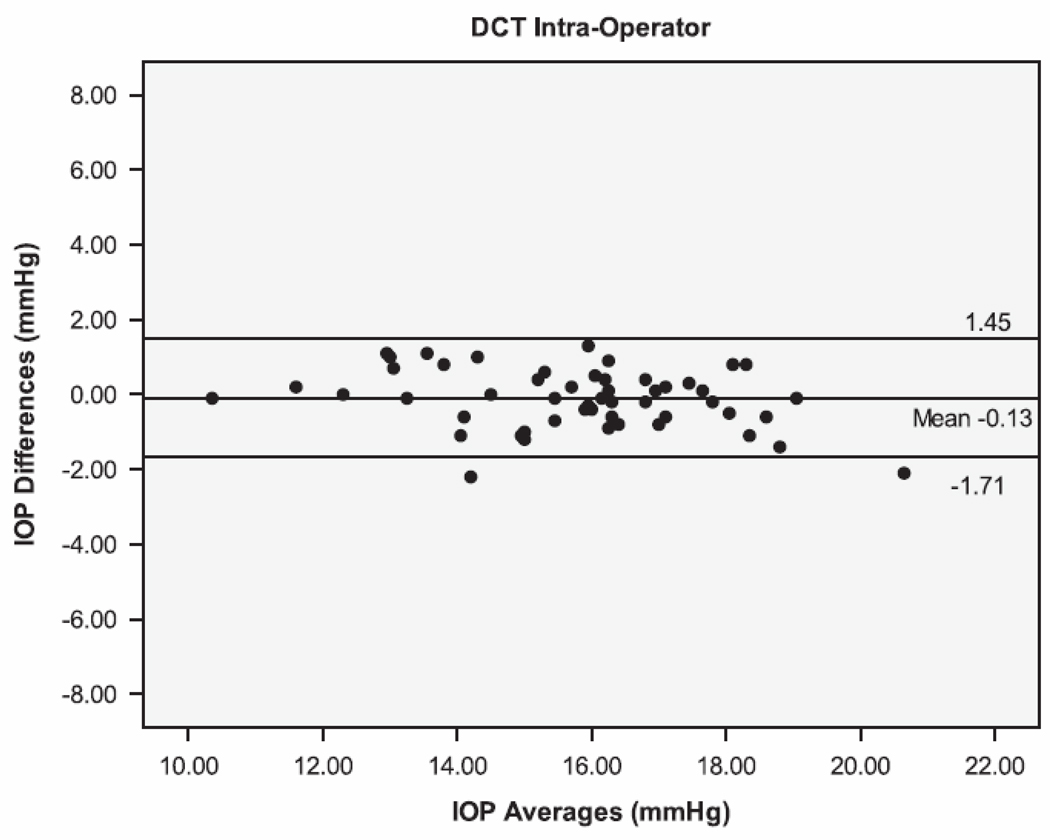
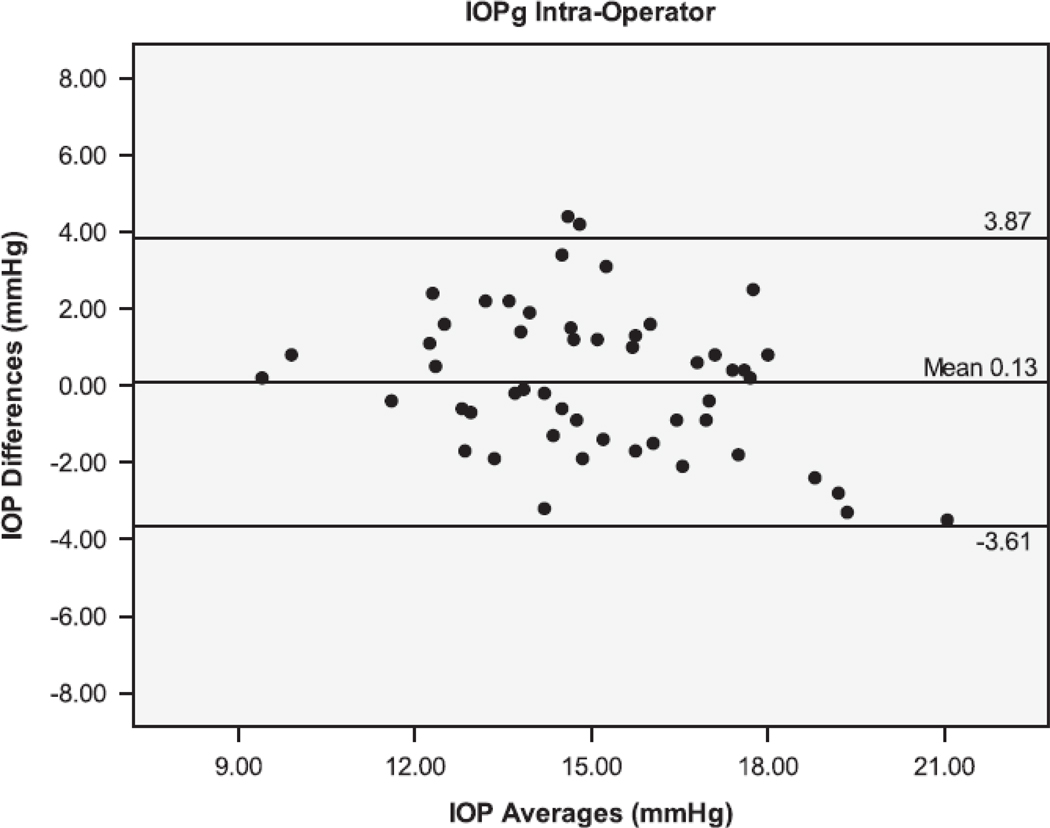
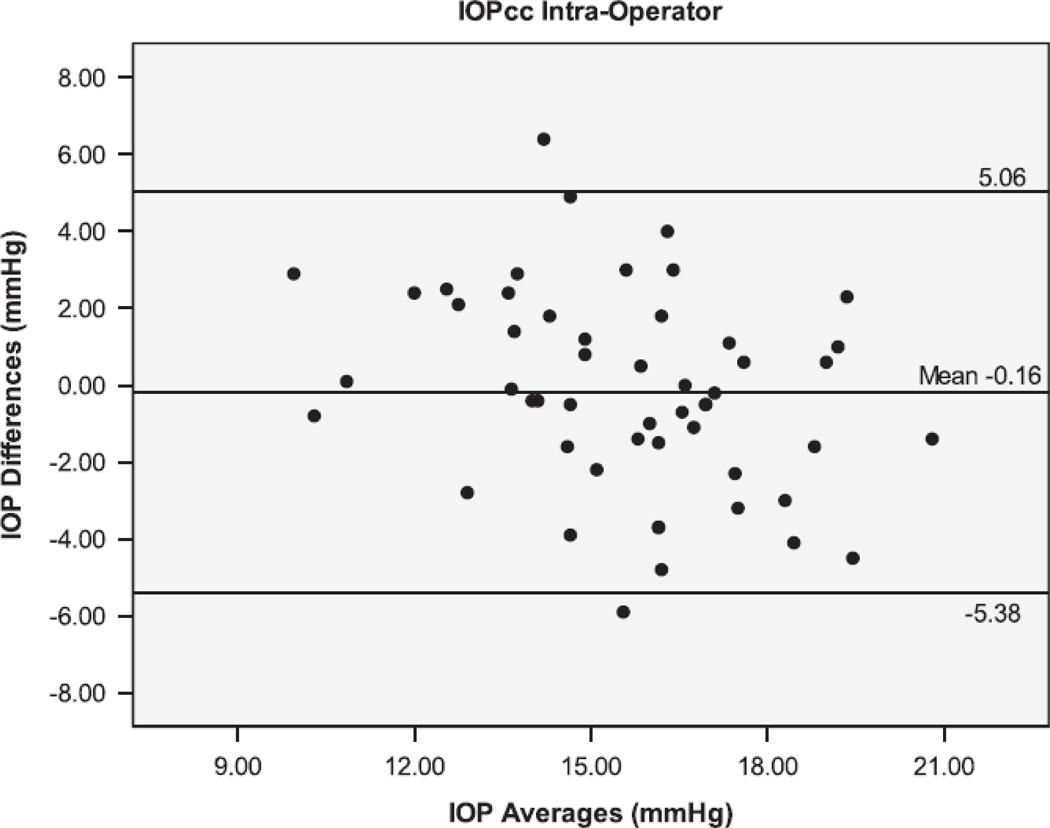
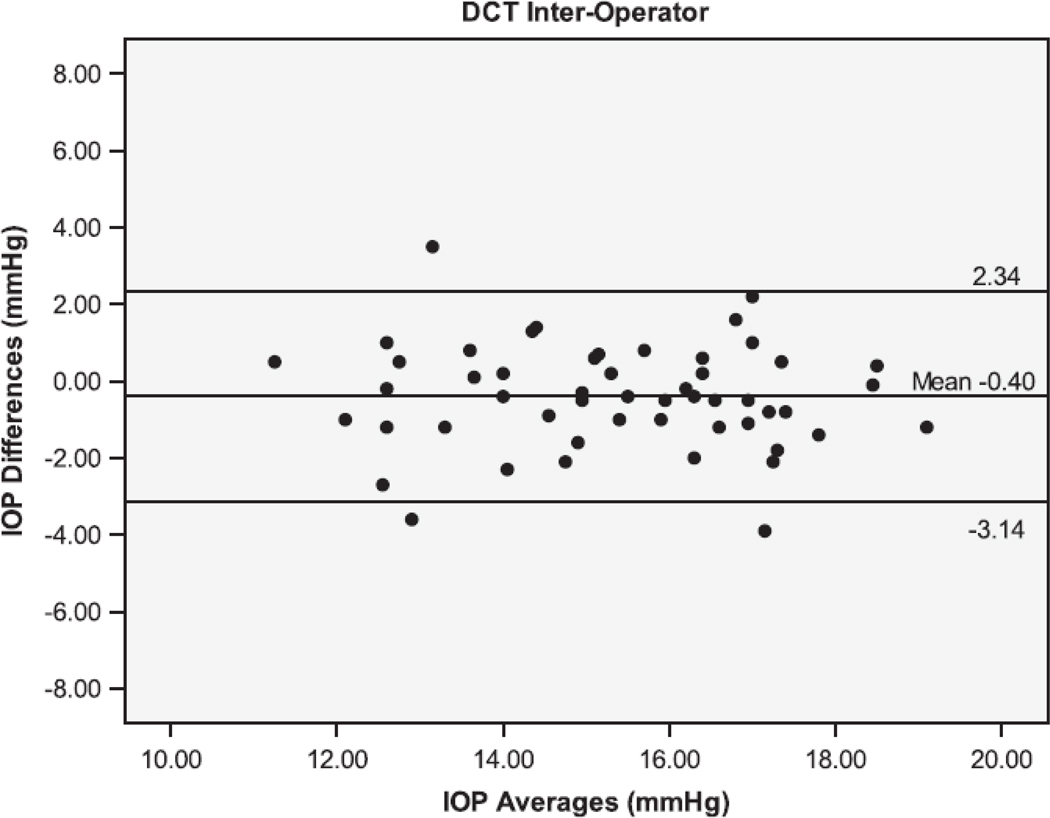
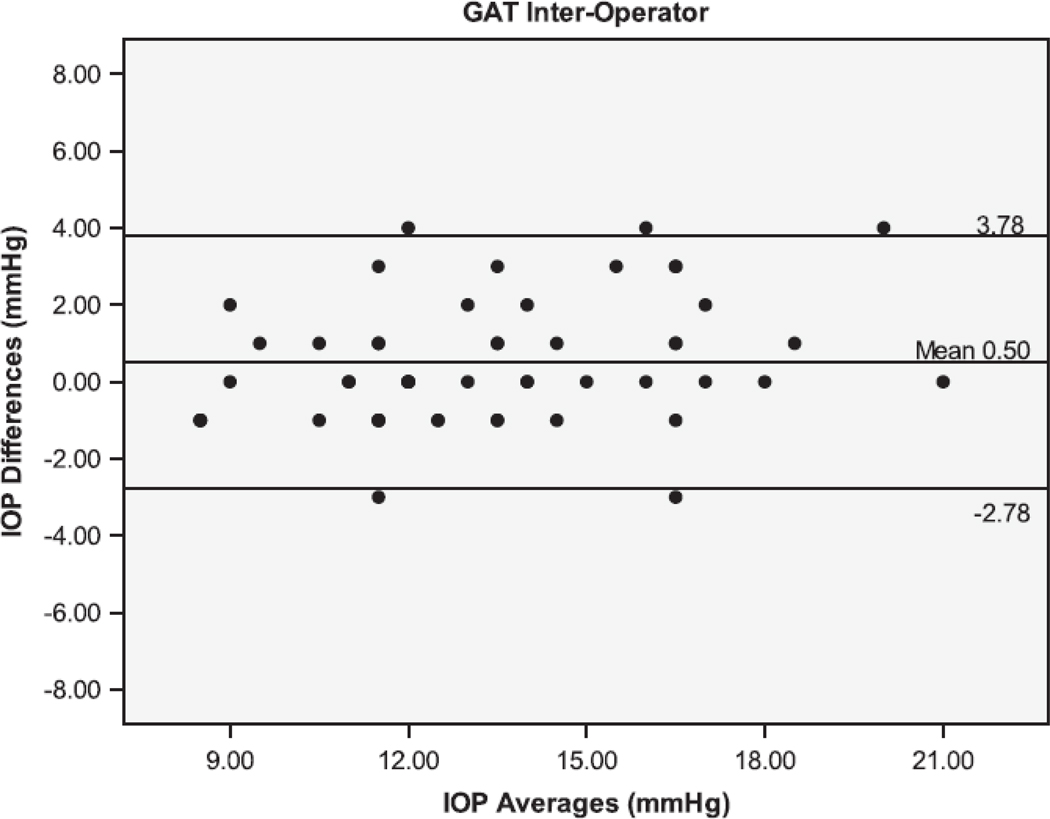
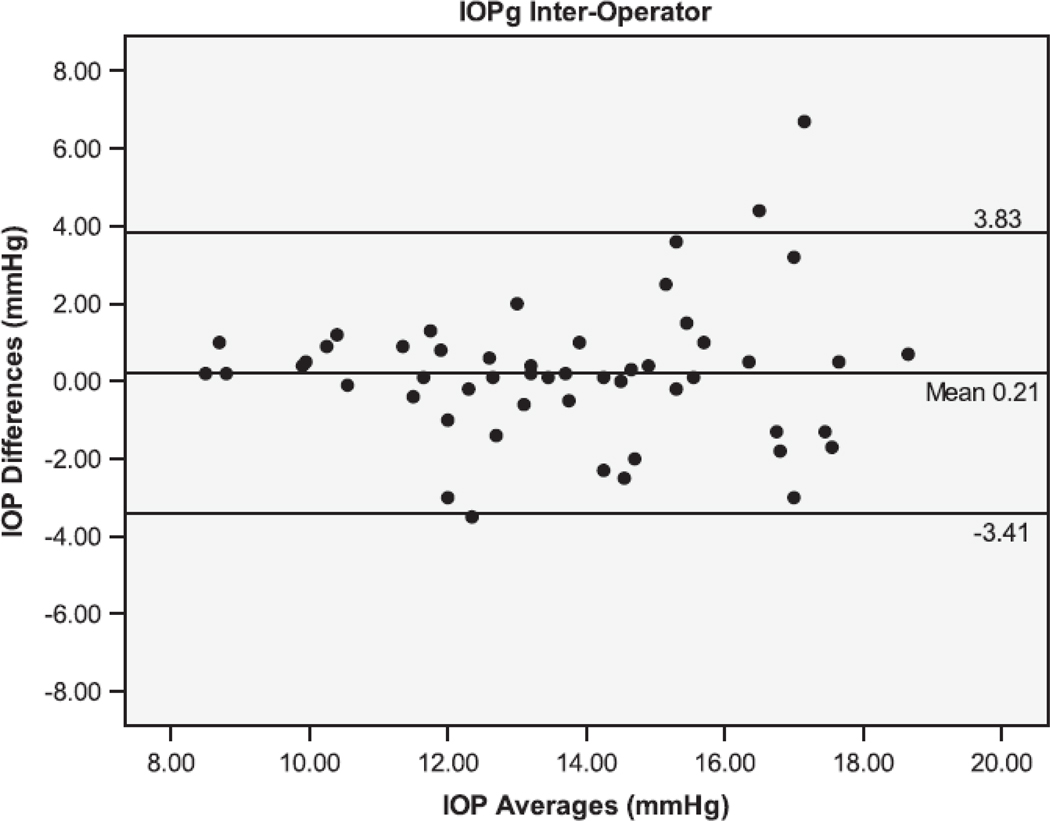
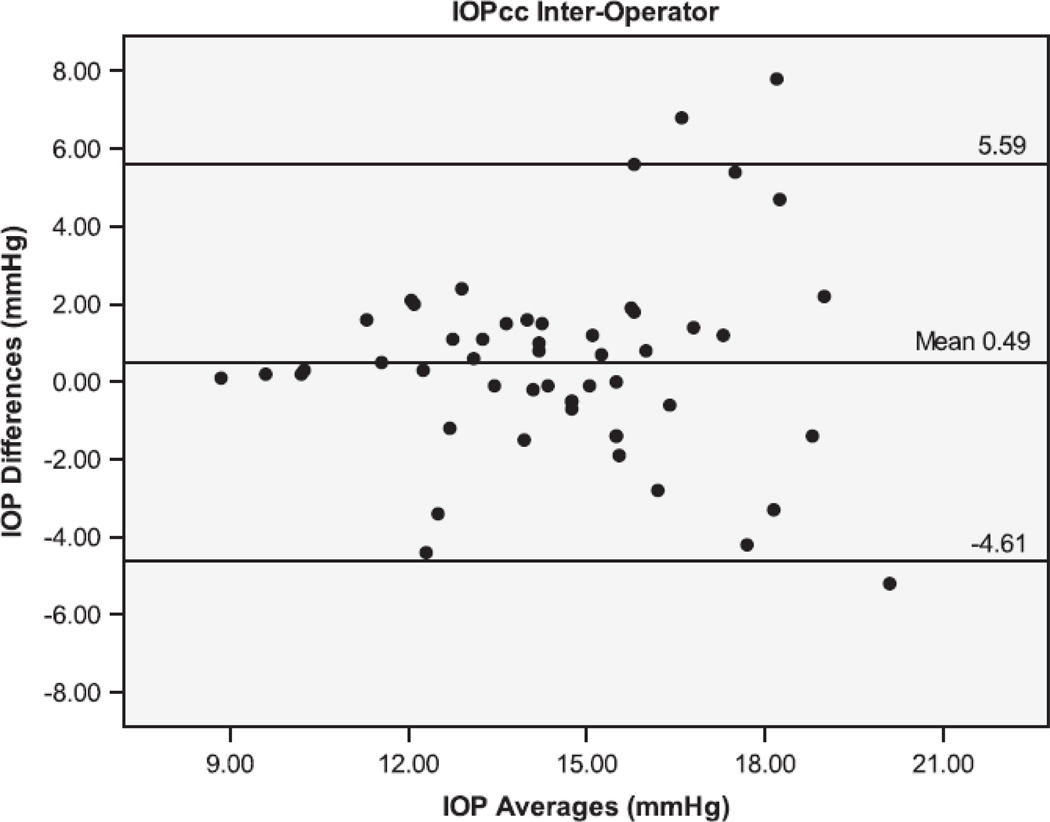
The Bland Altman plots showing the agreement between the second and third serial measurements from the same operator are seen in Figure 1. The 95% limits of agreement (LoA) were larger for IOPcc (−5.38 to 5.06 mmHg), GAT (−4.44 to 4.24 mmHg), and IOPg (−3.61 to 3.87 mmHg) than for DCT (−1.71 to 1.45 mmHg). Figure 2 shows the Bland Altman plots for the agreement between measurements taken by different operators (operators 1 and 3). The inter-operator LoA for the DCT (−3.14 to 2.34 mmHg) were narrower than that of GAT (−2.78 to 3.78 mmHg), IOPg (−3.41 to 3.83 mmHg) and IOPcc (−4.61 to 5.59 mmHg). The remaining Bland Altman LoA’s demonstrate the same trend of agreement for each tonometer (Table 3). Similar to the majority of the ICC and CV results, the Bland-Altman showed that the DCT had repeat IOP measurements with the lowest variability, while the GAT and IOPg had similar variability and the IOPcc was the most variable.
Figure 1.
Bland-Altman plots of the Intraocular Pressure (IOP) measurements by the Dynamic Contour Tonometer (DCT), Goldmann Applanation Tonometer (GAT), Ocular Response Analyzer - Goldman Estimated (IOPg) and the Ocular Response Analyzer – cornea corrected (IOPcc) for the Intra-Operator group of measurements.
Figure 2.
Bland-Altman plots of the Intraocular Pressure (IOP) measurements by the Dynamic Contour Tonometer (DCT), Goldmann Applanation Tonometer (GAT), Ocular Response Analyzer - Goldman Estimated (IOPg) and the Ocular Response Analyzer – cornea corrected (IOPcc) for the Inter-Operator group of measurements.
Table 3.
Mean differences (Mean) between IOP measurements and the 95% Limits of Agreement (LoA). LOA within observers were narrowest in DCT and ORAg groups, whereas LOA between observers were narrowest for DCT and GAT groups.
| Operator# (Trial#) |
DCT | GAT | IOPg | ||
|---|---|---|---|---|---|
| Mean (mmHg) |
95% LoA |
Mean (mmHg) |
95% LoA |
Mean (mmHg) |
|
| Intra-observer | |||||
| 1(1) vs 1(2) | 0.32 | −1.61 to 2.26 | 0.39 | −3.83 to 4.60 | 0.13 |
| 1(2) vs 1(3) | −0.13 | −1.71 to 1.45 | −0.10 | −4.44 to 4.24 | 0.13 |
| 1(1) vs 1(3) | 0.20 | −1.95 to 2.35 | 0.29 | −4.23 to 4.80 | 0.26 |
| Inter-observer | |||||
| 1(1) vs 2(1) | 0.90 | −1.80 to 3.59 | 0.12 | −3.95 to 4.18 | 1.48 |
| 2(1) vs 3(1) | 0.50 | −3.08 to 2.28 | 0.6 | −2.71 to 3.71 | 1.7 |
| 1(1) vs 3(1) | −0.40 | −3.14 to 2.34 | 0.50 | −2.78 to 3.78 | 0.21 |
DCT: Dynamic Contour Tonometer; GAT: Goldmann Applanation Tonometer; IOPg: Ocular Response Analyzer - Goldmann Estimated; IOPcc: Ocular Response Analyzer - Corneal Compensated
The intra-operator ICCs for the CRF and CH measurements from ORA were 0.76 and 0.60, respectively. The inter-operator ICCs for the CRF and CH were 0.70 and 0.59, respectively.
Out of 260 ORA measurements, 178 (68%) had waveform scores of at least 5.Excluding eyes with waveform scores less than 5 resulted in CV and ICC values for IOPg of 9.18, 0.77, respectively and CV and ICC values for IOPcc of 11.12, 0.54, respectively. For CH, the corresponding values for CV and ICC were 8.07 and 0.65; whereas for CRF, these values were 7.31 and 0.70, respectively. These values of repeatability were not significantly improved when compared to the repeatability of all measurements (P>0.05 for all comparisons).
Discussion
In the current study, we observed that different methods of IOP measurement have different levels of variability. In general, both DCT and GAT showed better reproducibility coefficients than IOPg and IOPcc. DCT had the most consistent measurements and showed significantly higher reproducibility than GAT. IOPcc showed the lowest levels reproducibility, both intra- and inter-operator. These results are important when deciding which method to use for follow-up of a patient or for a clinical trial. In addition, the expected limits of IOP error and the expected differences in measurements need to be considered when switching from one tonometer to another.
Overall, our results were consistent with previous studies, which also demonstrated DCT measurements to be more repeatable than GAT and IOPcc.3, 5, 19–21 The DCT had the best reproducibility, both for intra and inter-operator measurements. Our results support those found by Kaufmann et al.3 However, other previous studies did not show significant differences between DCT and GAT variability.19, 20 This may be a result of the more objective technique of measuring the IOP with a DCT. Unlike GAT, which requires the operator to subjectively align the prisms to determine proper applanation and then read it on the knob scale, the DCT notifies the operator when the tonometer is properly placed and reports the IOP in a digital LCD screen. It is possible that some of the external factors that affect GAT measurements also vary between measurements.2, 10, 22 Therefore, if the viscoelastic properties of the cornea, for example, fluctuate between measurements, a tonometer that is less affected by these factors, such as the DCT, would show better test-retest reproducibility.6
The comparison between IOPg and GAT had inconsistent results. On one side the CV of IOPg was lower than that of GAT for serial measurements taken by a single operator. These results are not surprising considering that the ORA is an automated method, while GAT relies on subjective interpretation of the operator. However, the reproducibility of measurements between different operators was better with GAT (higher ICC); which was unexpected, especially since the IOPg had better intra-operator repeatability. In comparison with a recent study also showed equivocal variability (CV) between GAT and IOPg.20 Although we could speculate that this was the result of different operator skills, the operators received similar training for this study and, therefore, we do not expect this to have had a major influence in the results. In addition, the ORA acquires the signal for the IOP measurements within milliseconds, as opposed to a few seconds in other methods. It is possible that two consecutive measurements that may fall in extremes of the ocular pulse will have larger differences than two measurements with a tonometer that averages the IOP throughout a cardiac cycle.9, 21, 23
It has been suggested that repeated intra-operator measurements for the GAT should be within ± 2.5 mmHg of each other in 95% of eyes, and inter-operator measurements should be within ± 4 mmHg of each other in 95% of eyes under ideal circumstances.24 For the measurements made by the same operator (intra-operator), the DCT was the only tonometer with results within these standards. Our results for GAT intra-operator repeatability (with 95% of the measurements being within ± 4 mmHg) were below the expected standards for the use of GAT. Conversely, in our study, 95% of the measurements between different operators with GAT, DCT and with IOPg were within the standard ± 4 mmHg, with only IOPcc showing a larger variability (95% within ± 6 mmHg).
IOPcc had the poorest test-retest reproducibility and was the most variable both for the intra- as the inter-operator assessments. A relatively lower reproducibility of IOPcc has also been shown in previous studies among glaucomatous and healthy eyes, comparing it with DCT, IOPg and GAT measurements.10, 19, 21, 23 Quantitatively, the CV in our study (9.8–11.7) was similar to that reported in a recent study (9.8–10.0).20 However, the ICC in our study for IOPcc (0.49–0.57) was similar to what was reported in another recent study (0.48–0.89).10 It is interesting to note that IOPcc measurements were more variable than the IOPg; which also agrees with previously published reports. 10, 20 The IOPcc algorithm incorporates the IOPg measurement and also CRF in approximating the IOP. The variability of the CRF measurements from our study was higher (ICC intra- and inter-operator = 0.76 and 0.70, respectively) than a previous study (ICC intra- and inter-operator = 0.93 and 0.93, respectively).2, 10
A limitation of our study is that only one of the three operators repeated IOP measurements three times with each tonometer, while the other two operators only measured IOP’s once with each tonometer. The current recommended protocol for the Reichert ORA requires that 1 image with the highest waveform score be selected among three for analysis.25 Further studies should evaluate whether the acquisition of more measurements and selection of those with higher waveform scores improves the reproducibility of the ORA. 20, 21 It should also be noted, that we were not able to find an improvement in variability when the exclusion of eyes with waveform scores less than 5 were investigated. Another limitation in our study is that we included only healthy subjects, which limited the range of IOP values in our study. Therefore, further studies are necessary to evaluate reproducibility of these instruments in eyes with higher IOP values.
In conclusion, the results of this study suggest that the DCT demonstrates a reproducibility that is better than the GAT or the ORA. The better reproducibility of the DCT may result in more precise measurements for monitoring intraocular pressure changes over time compared to GAT and ORA.
Acknowledgments
Grant Support: NIH NEI EY08208
Footnotes
Publisher's Disclaimer: This is a PDF file of an unedited manuscript that has been accepted for publication. As a service to our customers we are providing this early version of the manuscript. The manuscript will undergo copyediting, typesetting, and review of the resulting proof before it is published in its final citable form. Please note that during the production process errors may be discovered which could affect the content, and all legal disclaimers that apply to the journal pertain.
Financial Disclosure:
Carl Zeiss: FAM (F, R)
Heidelberg Engineering: FAM (R)
Reichert Inc : FAM (R), RNW (R)
Ziemer Ophthalmic Systems AG: FAM (R), RNW (R)
References
- 1.Goldmann H, Schmidt T. Applanation tonometry. Ophthalmologica. 1957;134(4):221–242. doi: 10.1159/000303213. [DOI] [PubMed] [Google Scholar]
- 2.Kotecha A, Elsheikh A, Roberts CR, et al. Corneal thickness- and age-related biomechanical properties of the cornea measured with the ocular response analyzer. Invest Ophthalmol Vis Sci. 2006;47(12):5337–5347. doi: 10.1167/iovs.06-0557. [DOI] [PubMed] [Google Scholar]
- 3.Kaufmann C, Bachmann LM, Thiel MA. Comparison of dynamic contour tonometry with goldmann applanation tonometry. Invest Ophthalmol Vis Sci. 2004;45(9):3118–3121. doi: 10.1167/iovs.04-0018. [DOI] [PubMed] [Google Scholar]
- 4.Kotecha A, White ET, Shewry JM, Garway-Heath DF. The relative effects of corneal thickness and age on Goldmann applanation tonometry and dynamic contour tonometry. Br J Ophthalmol. 2005;89(12):1572–1575. doi: 10.1136/bjo.2005.075580. [DOI] [PMC free article] [PubMed] [Google Scholar]
- 5.Johannesson G, Hallberg P, Eklund A, Linden C. Pascal, ICare and Goldmann applanation tonometry--a comparative study. Acta Ophthalmol. 2008;86(6):614–621. doi: 10.1111/j.1600-0420.2007.01112.x. [DOI] [PubMed] [Google Scholar]
- 6.Kanngiesser HE, Kniestedt C, Robert YC. Dynamic contour tonometry: presentation of a new tonometer. J Glaucoma. 2005;14(5):344–350. doi: 10.1097/01.ijg.0000176936.16015.4e. [DOI] [PubMed] [Google Scholar]
- 7.AG ZOS. Pascal Dynamic Contour Tonometer. Brochure. 2006 [Google Scholar]
- 8.Luce DA. Determining in vivo biomechanical properties of the cornea with an ocular response analyzer. J Cataract Refract Surg. 2005;31(1):156–162. doi: 10.1016/j.jcrs.2004.10.044. [DOI] [PubMed] [Google Scholar]
- 9.Luce DA. Methodology for Corneal Compensated IOP and Corneal Resistance Factor for an Ocular Response Analyzer. 2006 www.ocularresponseanalyzer.com/downloads/Luce-2006-1.pdf.
- 10.Moreno-Montanes J, Maldonado MJ, Garcia N, et al. Reproducibility and clinical relevance of the ocular response analyzer in nonoperated eyes: corneal biomechanical and tonometric implications. Invest Ophthalmol Vis Sci. 2008;49(3):968–974. doi: 10.1167/iovs.07-0280. [DOI] [PubMed] [Google Scholar]
- 11.Patel PJ, Chen FK, Ikeji F, et al. Repeatability of stratus optical coherence tomography measures in neovascular age-related macular degeneration. Invest Ophthalmol Vis Sci. 2008;49(3):1084–1088. doi: 10.1167/iovs.07-1203. [DOI] [PubMed] [Google Scholar]
- 12.Bland JM, Altman DG. Measurement error. Bmj. 1996;313(7059):744. doi: 10.1136/bmj.313.7059.744. [DOI] [PMC free article] [PubMed] [Google Scholar]
- 13.Lu L, Shara NM. Reliability analysis: calculate and compare intra-class correlation coefficients (ICC) in SAS. Northeast SAS Users Group; 2007. [Google Scholar]
- 14.Patton N, Aslam T, Murray G. Statistical strategies to assess reliability in ophthalmology. Eye (Lond) 2006;20(7):749–754. doi: 10.1038/sj.eye.6702097. [DOI] [PubMed] [Google Scholar]
- 15.Bartlett JW, Frost C. Reliability, repeatability and reproducibility: analysis of measurement errors in continuous variables. Ultrasound Obstet Gynecol. 2008;31(4):466–475. doi: 10.1002/uog.5256. [DOI] [PubMed] [Google Scholar]
- 16.Bradley E, Tibshirani RJ. Introduction to the Bootstrap. New York: Chapman & Hall/CRC; 1993. [Google Scholar]
- 17.Bland JM, Altman DG. Statistical methods for assessing agreement between two methods of clinical measurement. Lancet. 1986;1(8476):307–310. [PubMed] [Google Scholar]
- 18.Team RDC. R: A language and environment for statistical computing. R Foundation for Statistical Computing. Vienna, Austria: 2010. [Google Scholar]
- 19.Kotecha A, White E, Schlottmann PG, Garway-Heath DF. Intraocular pressure measurement precision with the Goldmann applanation, dynamic contour, and ocular response analyzer tonometers. Ophthalmology. 2010;117(4):730–737. doi: 10.1016/j.ophtha.2009.09.020. [DOI] [PubMed] [Google Scholar]
- 20.Sullivan-Mee M, Gerhardt G, Halverson KD, Qualls C. Repeatability and reproducibility for intraocular pressure measurement by dynamic contour, ocular response analyzer, and goldmann applanation tonometry. J Glaucoma. 2009;18(9):666–673. doi: 10.1097/IJG.0b013e31819c487d. [DOI] [PubMed] [Google Scholar]
- 21.Tonnu PA, Ho T, Sharma K, et al. A comparison of four methods of tonometry: method agreement and interobserver variability. Br J Ophthalmol. 2005;89(7):847–850. doi: 10.1136/bjo.2004.056614. [DOI] [PMC free article] [PubMed] [Google Scholar]
- 22.Doughty MJ, Zaman ML. Human corneal thickness and its impact on intraocular pressure measures: a review and meta-analysis approach. Surv Ophthalmol. 2000;44(5):367–408. doi: 10.1016/s0039-6257(00)00110-7. [DOI] [PubMed] [Google Scholar]
- 23.Vernon SA. Reproducibility with the Keeler Pulsair 2000 non-contact tonometer. Br J Ophthalmol. 1995;79(6):554–557. doi: 10.1136/bjo.79.6.554. [DOI] [PMC free article] [PubMed] [Google Scholar]
- 24.Weinreb RN, Brandt JD, Garway-Heath D, Medeiros FA. Intraocular Pressure: Measurement of Intraocular Pressure. World Glaucoma Association 4th Consensus Meeting; Ft. Lauderdale, FL. 2007. [Google Scholar]
- 25.Taylor D. Reichert, Inc. Buffalo, NY: 2010. [Google Scholar]


