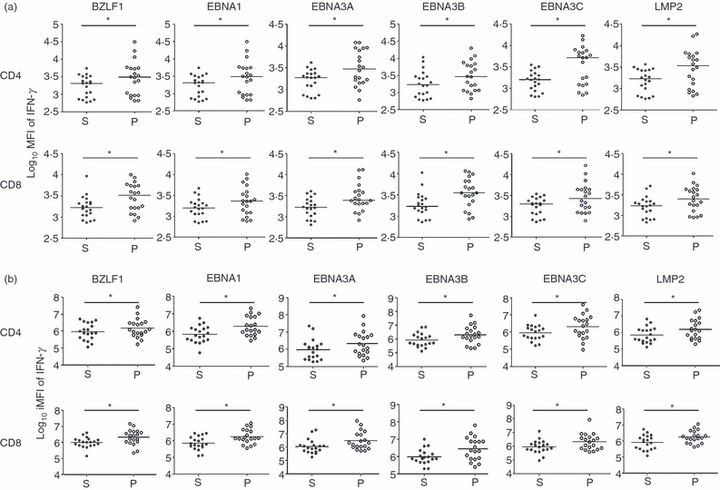
Figure 4.

Comparison of cytokine production by single and polyfunctional T cells (PFCs). (a) Median fluorescent intensity (MFI) of interferon-γ (IFN-γ) of virus-specific CD4+ and CD8+ T cells of each long-term carrier for each peptide pool was calculated. The log10 MFI of IFN-γ of T cells with single function (denoted as S) and with two or more functions (denoted as P) were compared. Each dot represents one subject. For all peptide pools, PFCs consistently produced more IFN-γ per cell than the single functional T cells (paired Student's t-test, *P < 0.05). (b) Integrated MFI (iMFI) of IFN-γ of virus-specific CD4+ and CD8+ T cells of each long-term carrier for each peptide pool was obtained. The log10 iMFI of IFN-γ of T cells with single function (denoted as S) and with two or more functions (denoted as P) were compared. Each dot represented one subject. For all peptide pools, PFCs consistently had a larger value of iMFI of IFN-γ than that of single functional T cells (paired Student's t-test, *P < 0.05).
