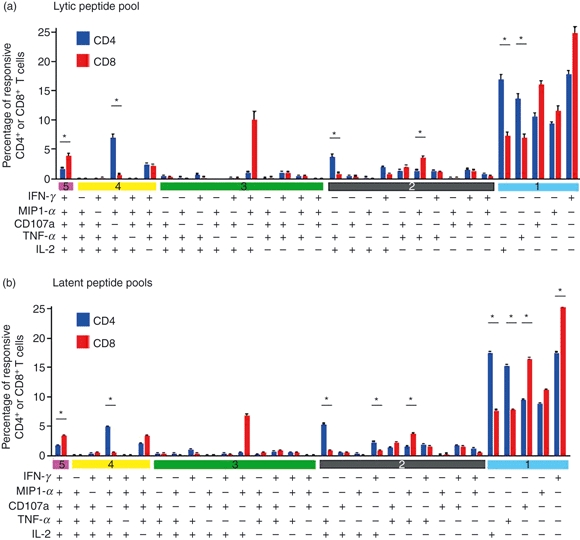
Figure 5.

Subset analysis of Epstein–Barr virus (EBV) -specific T cells. (a) Subset analysis of CD4+ and CD8+ T-cell responses to overlapping peptide pool of BZLF1 protein. (b) Subset analysis of CD4+ and CD8+ T-cell responses to overlapping peptide pools of latent EBV proteins. The graph displayed the mean frequencies ± SEM of different T-cell subsets with respect to total responsive T cells in all 20 long-term carriers. Comparison of frequencies between responsive CD4+ and CD8+ T cells was performed by Wilcoxon's signed-rank test at a significant level of 0.05. Asterisk indicates statistically significant difference between frequencies of responsive CD4+ and CD8+ T cells.
