Abstract
During the last decade, more than half of humans infected with highly pathogenic avian influenza (HPAI) H5N1 viruses have died, yet virus-induced host signaling has yet to be clearly elucidated. Airway epithelia are known to produce inflammatory mediators that contribute to HPAI H5N1-mediated pathogenicity, but a comprehensive analysis of the host response in this cell type is lacking. Here, we leveraged a system approach to identify and statistically validate signaling subnetworks that define the dynamic transcriptional response of human bronchial epithelial cells after infection with influenza A/Vietnam/1203/2004 (H5N1, VN1203). Importantly, we validated a subset of transcripts from one subnetwork in both Calu-3 cells and mice. A more detailed examination of two subnetworks involved in the immune response and keratinization processes revealed potential novel mediators of HPAI H5N1 pathogenesis and host response signaling. Finally, we show how these results compare to those for a less virulent strain of influenza virus. Using emergent network properties, we provide fresh insight into the host response to HPAI H5N1 virus infection and identify novel avenues for perturbation studies and potential therapeutic interventions for fatal HPAI H5N1 disease.
INTRODUCTION
Highly pathogenic avian influenza (HPAI) H5N1 viruses continue to persist and evolve in avian species, and they cause human infections resulting in exceptionally high mortality (∼60%). These circumstances set the stage for the selection of viruses with mutations allowing for efficient human-to-human transmission and make the possibility of an HPAI H5N1 pandemic a substantial global public health threat. To prepare for this threat, it is essential to clearly understand the biology of HPAI H5N1 infection in humans and identify specific correlates of pathogenicity that may be targeted for prevention or intervention strategies.
The mechanisms that promote the unusually high HPAI H5N1 pathogenicity are not completely resolved, but they are thought to be caused by specific amino acids in virus genes that facilitate enhanced replication and the dysregulation of the host immune response (32). HPAI H5N1 viruses induce aberrant cytokine production in various systems, leading to the widespread hypothesis that HPAI H5N1 pathogenicity arises from the fatal effects of hypercytokinemia. Humans infected with HPAI H5N1 viruses exhibit high levels of inflammatory molecules in serum, including interleukin-6 (IL-6), tumor necrosis factor (TNF), gamma interferon (IFN-γ), CXCL10, CCL2, and IL-8 (2, 13). However, studies with mice lacking the expression of some of these molecules have not revealed any one correlate for HPAI H5N1 pathogenicity (39, 43).
Airway epithelium is the primary target for HPAI H5N1 influenza virus infection and has been implicated in the production of cytokines and chemokines that contribute to inflammatory cell infiltration. Several studies have indicated the increased expression of CXCL10, IFN-β1, IL-6, and CCL5 in alveolar and bronchial epithelial cells after HPAI H5N1 infection relative to that of cells that were infected with a lower-pathogenicity H1N1 virus isolate (6, 7, 55). Although the targeted analysis of expression levels of specific inflammatory mediators provides important information, a comprehensive analysis of the global host response is essential for the development of a complete understanding of factors that contribute to pathogenesis. High-throughput measurements, such as microarray analysis, are well suited for this purpose and have been successfully utilized to identify critical mediators of pathogenesis associated with HPAI H5N1 in in vivo systems (5, 8–10, 18, 34). However, the application of microarray technology to examine the host response in human airway epithelium has been remarkably sparse. Therefore, we set out to examine the host response in HPAI H5N1-infected Calu-3 cells, a human bronchial epithelial cell line that serves as a proxy for airway epithelium.
Transcriptional profiling studies often produce unwieldy lists of differentially expressed genes, which typically are analyzed as a single entity. Here, we have used an alternative system biology strategy, known as weighted gene correlation network analysis (WGCNA), to interpret the dynamic HPAI H5N1-mediated transcriptional response. This method discovers systemic gene expression patterns based on underlying correlation structures and is not biased by existing knowledge of pathways or interactions. WGCNA partitions gene expression into groups of transcripts (known as subnetworks) with highly correlated (i.e., connected) behavior, and it has been shown that connectivity implied through WGCNA is a strong predictor of related biological function (56). Using WGCNA, we quantified coexpression between all transcripts and identified groups of strongly connected transcripts, allowing us to detect host signaling response networks. We demonstrated that specific transcript behaviors could translate to in vivo infections in mice, and we further analyzed how transcriptional networks and specific factors behaved in infections with a less pathogenic H1N1 influenza virus isolate. Our results highlight hypotheses regarding the host response to HPAI H5N1 infection, with the ultimate goal of identifying novel therapeutic strategies to prevent fatal HPAI H5N1 disease.
MATERIALS AND METHODS
Cells and virus.
Calu-3 cells, a human lung adenocarcinoma cell line, were kindly provided by Raymond Pickles (University of North Carolina, Chapel Hill, NC) and were maintained in a 1:1 mixture of Dulbecco's modified Eagle's medium and Ham's F12 nutrient medium (DF12; Invitrogen, Carlsbad, CA) supplemented with 10% fetal bovine serum. Madin-Darby canine kidney (MDCK) cells were maintained in minimum essential medium (MEM) (Invitrogen) containing 5% newborn calf serum. All cells were grown at 37°C in an atmosphere of 5% CO2 with an antibiotic-antimycotic mixture (Invitrogen). For Calu-3 and mouse infections with HPAI H5N1 virus, we used influenza A/Vietnam/1203/2004 (H5N1) (referred to as VN1203). A stock virus was derived from a plasmid-based reverse-genetic system and amplified in MDCK cells, as previously described (29, 50). For comparisons to a virus of reduced pathogenicity, we used influenza A/Netherlands/602/2009 (H1N1) (referred to as NL602; kindly provided by Ron Fouchier, Erasmus Medical Center, Rotterdam, Netherlands) (24). NL602 stock viruses were prepared by amplification in MDCK cells. All experiments with VN1203 were performed in a biosafety level 3 containment laboratory approved for such use by the Centers for Disease Control and Prevention and the United States Department of Agriculture.
Infections.
Total cellular RNA and culture supernatants were collected from Calu-3 cells infected with VN1203 at 0, 3, 7, 12, 18, and 24 h postinfection (hpi) or with NL602 at 0, 3, 7, 12, 18, 24, 30, 36, and 48 hpi. Cells were seeded in 6-well plates (1 × 10⁶ cells/well) 2 days prior to infection; immediately preceding infection, monolayers were washed twice with DF12 supplemented with 0.3% bovine serum albumin (DF12-BSA), and cells were inoculated with VN1203 (multiplicity of infection [MOI] of 1 PFU per cell) or NL602 (MOI of 3 PFU/cell) in DF12-BSA for 50 min at 37°C. Mock-infected controls were inoculated with DF12-BSA only. Following inoculation, monolayers were washed once with DF12-BSA and incubated in DF12-BSA containing 0.5 μg/ml of tosylsulfonyl phenylalanyl chloromethyl ketone-treated trypsin (Worthington Biochemical Corporation, Lakewood, NJ) for the times just described. The end of the inoculation period was considered the 0-h time point. To quantify levels of infectious viruses produced in infected Calu-3 cells, plaque assays of supernatants were performed in MDCK cells using standard procedures. Virus-induced cytopathic effects (CPE), indicated by cell rounding and detachment from the monolayer, were assessed by microscopic examination. CPE was scored using a +/− scale, where − indicates no CPE, + indicates minor cell rounding in approximately 25% of cells, ++ indicates cell rounding in 25 to 50% of cells along with some cell detachment, +++ indicates rounding or detachment in 50 to 75% of the cells, and ++++ indicates detachment of >95% of cells in the monolayer.
RNA isolation from Calu-3 cells.
At each time point, triplicate wells of mock-infected and virus-infected Calu-3 monolayers were washed with 5 ml cold phosphate-buffered saline (PBS) and lysed directly with 1 ml of TRIzol (Invitrogen) according to the manufacturer's recommendations, and resulting lysates were stored at −80°C until further processing. All TRIzol lysates were processed simultaneously They were phase separated, and RNA was isolated from the aqueous phase (diluted 2-fold with RLT buffer) using Qiagen RNeasy Mini columns and the manufacturer's recommended protocol (Qiagen Inc., Valencia, CA). RNA quality was assessed on an Agilent 2100 Bioanalyzer using the nanochip format, and only intact RNA was used for quantitative real-time PCR (qPCR) and microarray analyses.
Quantification of viral RNA species.
Relative quantities of viral nucleoprotein (NP) genomic RNA (vRNA) and mRNA were determined by qPCR. First-strand cDNA synthesis was performed using 500 ng of total RNA, ThermoScript reverse transcriptase (Invitrogen), and 15 pmol of RNA-specific primers for VN1203 NP vRNA, mRNA, or human RPL14R2 (endogenous reference) according to the manufacturer's protocol. Primers for NP RNAs were designed with unique 5′ sequences, thereby ensuring differentiation between vRNA and mRNA species. The qPCR assay was performed using a SYBR green kit (Applied Biosystems, Carlsbad, CA) according to the manufacturer's standard protocol. Relative RNA quantities were determined using the comparative threshold cycle method, with human RPL14R2 serving as the endogenous reference and mock-infected samples serving as the calibrator. Primer sequences are available upon request.
Microarray processing and identification of differentially expressed transcripts.
Two hundred fifty ng of each RNA sample was hybridized to one Agilent 4X44K human HG (design ID 014850) array. The Agilent one-color microarray-based gene expression analysis protocol was followed for all processing steps, including Cy3-cDNA probe preparation, hybridization, and array washing. Dry slides were scanned on an Agilent DNA microarray scanner (model G2505B) using the XDR setting. Raw images were analyzed using the Agilent Feature Extraction software (version 9.5.3.1) and the GE1-v5_95_Feb07 extraction protocol. For each microarray, raw intensities, probe mappings, and quality-control (QC) metrics were output to a custom laboratory information management system (LabKey Software). Extracted raw data were background corrected using the norm-exp method and quantile normalized using Agi4x44PreProcess and RMA Bioconductor packages (19). Replicate probes were mean summarized, and all probes were required to pass Agilent QC flags for all replicates of at least one infected time point (27,912 probes passed). Differential expression (DE) was determined by comparing VN1203-infected replicates to mock-infected replicates for each time point based on a linear model fit for each transcript (36). Criteria for DE were an absolute log2 fold change of 1.5 and a false discovery rate (FDR)-adjusted P value of <0.05 for a given time point. Raw microarray data have been deposited in NCBI's Gene Expression Omnibus (GEO) (15) and are accessible through GEO series accession number GSE28166 (http://www.ncbi.nlm.nih.gov/geo/query/acc.cgi?acc=GSE28166) and the Systems Virology website (http://www.systemsvirology.org). For clarity, we refer to probes as transcripts for the remainder of the article.
WGCNA.
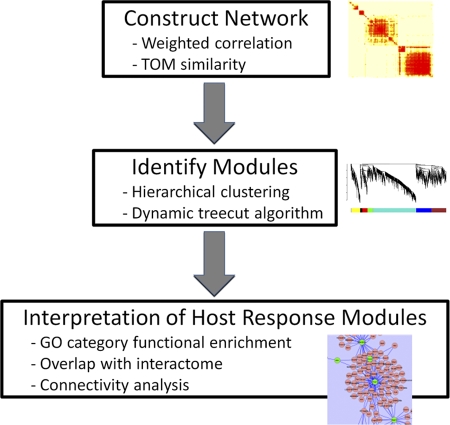
To identify groups of host transcripts that showed coordinated regulation in response to infection with VN1203, we applied WGCNA (22, 56). Briefly, the WGCNA method detects signaling subnetworks or modules consisting of groups of genes that are highly connected according to a neighborhood proximity metric called the topological overlap (TO), which quantifies the degree of shared network neighbors. Subsequently, modules are represented as eigengenes by taking the first principal component of each set of module transcripts, describing most of the variance in the module gene expression. Rather than representing the individual dynamics of hundreds of genes, eigengenes provide a coarse-grained representation of the entire module as a single entity. We have adapted WGCNA into a workflow with three key steps: (i) de novo network construction, (ii) detection of modules (subnetworks), and (iii) functional interpretation of host response modules (see Fig. A1). Network construction and the derivation of signaling modules (steps i and ii) are described in detail in the Appendix and Fig. A2.
For the biological interpretation of each module (step iii), we conducted enrichment analyses for functional annotation and protein-protein interactions. GOStats Bioconductor software was used to identify enriched gene ontology (GO) categories for each module using the hypergeometric distribution test and a universe calculation based on all transcripts mapping to probes passing Agilent QC flags for all replicates of at least one time point (17). Both biological function and cellular component subontologies were considered, and all associated P values were FDR adjusted.
Comparison between Calu-3 and mouse lung data sets.
We performed a comparison between upregulated transcripts in VN1203-infected Calu-3 cells and a previously published microarray study of VN1203 infection in 129S6/SvEv mouse lungs (8). Microarray probes were translated between species using Ensembl-mapped identifiers from the BioMart database (14). We focused on transcripts that were upregulated (average fold change, >0) and differentially expressed for at least one time point in both model systems. The following criteria were used to define differential expression: an absolute fold change of >1.5 and FDR-adjusted t test P value of <0.05. We used a less stringent 1.5-fold change threshold rather than the 1.5 log2-fold change used for Calu-3 infections, because less differential expression was observed in the mouse lung data set.
Mouse infections and lung RNA isolation.
Twenty-week-old C57BL/6 mice (The Jackson Laboratory, Bar Harbor, ME) were infected by the intranasal instillation of 1,000 PFU of VN1203 in 50 μl of PBS or were mock infected with PBS alone. Lung tissues were removed on days 1, 2, 4, and 7 postinfection, and total RNA from an individual lung lobe was harvested as follows: lung tissues were completely submerged in 10 to 20 volumes of RNA Later (Ambion, Austin, TX), incubated at 4°C overnight, and then stored at −80°C; after thawing, they were weighed and transferred into 10 to 20 volumes of TRIzol containing metal beads and were homogenized in six rounds of 10 s at 2,000 rpm in a homogenizer (Yasui Kikai, Japan). Finally, total RNA was harvested from resultant TRIzol supernatants as described for Calu-3 RNA isolation. In addition to the RNA isolation and qPCR analysis described here (see below), we also collected lung tissues for additional analyses that will be described in greater detail elsewhere. All animal experiments were performed in compliance with the University of Wisconsin–Madison Institutional Animal Care and Use Committee.
qPCR analysis of host transcript expression.
Relative quantities of mRNA for selected host transcripts were determined using qPCR with gene-specific primers (primer sequences are available upon request), similarly to what was described for the quantification of viral RNA species, except that the Quantitect cDNA kit (Qiagen, Inc.) was used for cDNA synthesis reactions according to the manufacturer's recommendations. The cDNA synthesis templates were (i) 500 ng of total cellular RNA from the same Calu-3 TRIzol lysates used for microarray analysis or (ii) 500 ng of total RNA from one lung lobe. For each biological condition, at least two biological replicates were assayed in triplicate, and time-matched mock-infected controls were used as the calibrator, with either human RPL14R2 or mouse RPL10 as the endogenous reference.
Microarray accession numbers.
Raw microarray data have been deposited in NCBI's Gene Expression Omnibus (15) and are accessible through GEO series accession number GSE28166 (http://www.ncbi.nlm.nih.gov/geo/query/acc.cgi?acc=GSE28166) and the Systems Virology website (http://www.systemsvirology.org).
RESULTS
VN1203 host response in human bronchial epithelial cells.
To examine the host response to HPAI H5N1 infection in airway epithelium, we infected Calu-3 cells with influenza A/Vietnam/1203/2004 (H5N1, VN1203). VN1203-infected monolayers exhibited efficient virus output at 7 h postinfection (hpi) and increased virus titers at all subsequent time points (Fig. 1 A). Similarly, genomic viral RNA levels increased in a stepwise manner; in contrast, viral mRNA levels peaked at 7 hpi and declined thereafter (Fig. 1B). Despite efficient virus output and abundant production of viral RNA species, only minimal CPE were observed at early times (0 to 12 hpi) (Fig. 1C). Importantly, the lack of abundant early CPE suggests that signaling events regulating the host transcriptional response are not affected by virus-induced cell death.
Fig. 1.
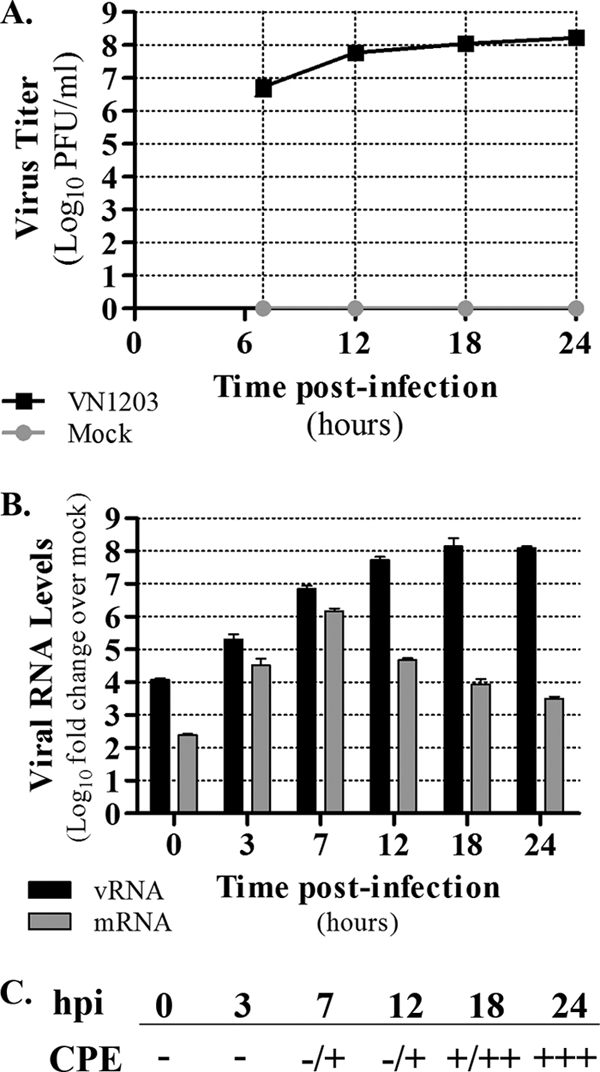
VN1203 infection of Calu-3 cells. (A) Calu-3 cells were infected with VN1203 (MOI of 1), and supernatants were harvested for the quantification of infectious virus production by plaque assay in MDCK cells. Log10 viral titers are shown for 7, 12, 18, and 24 h postinfection (hpi), with variation indicated by ± standard deviations for six biological replicates. (B) The level of segment 5 (nucleoprotein; NP) genomic viral RNA and mRNA was determined by qPCR for each time point (0, 3, 7, 12, 18, and 24 hpi). Note that the 0-h time point was designated the end of the incubation period with virus inocula. Values represent the average log10 fold changes relative to levels for time-matched mock-infected control samples, and variation is indicated by ± standard deviations from three biological replicates. (C) CPE was microscopically assessed at each time point, and the level is indicated using a +/− scale as described in Materials and Methods.
Microarray analysis revealed a robust and escalating host transcriptional response to VN1203 infection. In total, 13,156 unique DE transcripts were identified in at least one time point in the 24-h time course (DE was defined as a log2 fold change of 1.5 and an FDR-adjusted P value of <0.05 relative to results for time-matched mock-infected controls). DE was first observed at 7 hpi (773 transcripts), increased with time, and culminated in 11,495 DE transcripts at 24 hpi (Fig. 2 A). At 7 h, approximately 71.5% of the DE transcripts exhibited upregulation, whereas upregulated transcripts comprised less than 50% of total DE in all subsequent time points (Fig. 2A). To assess the consistency of the host response over time, we quantified the overlap of DE transcripts between time points using Fisher's exact test. Every pairwise time point comparison showed statistically significant overlap (P < 10−6), and we also observed a time-dependent increase in the number of overlapping DE transcripts. The heat map in Fig. 2B illustrates increasing overlap with colors corresponding to odds ratios, a quantification of overlap effect size. Overall, these observations indicate that the VN1203-induced transcriptional program encompasses strong up- and downregulatory effects and further implies that these changes are consistent over time.
Fig. 2.
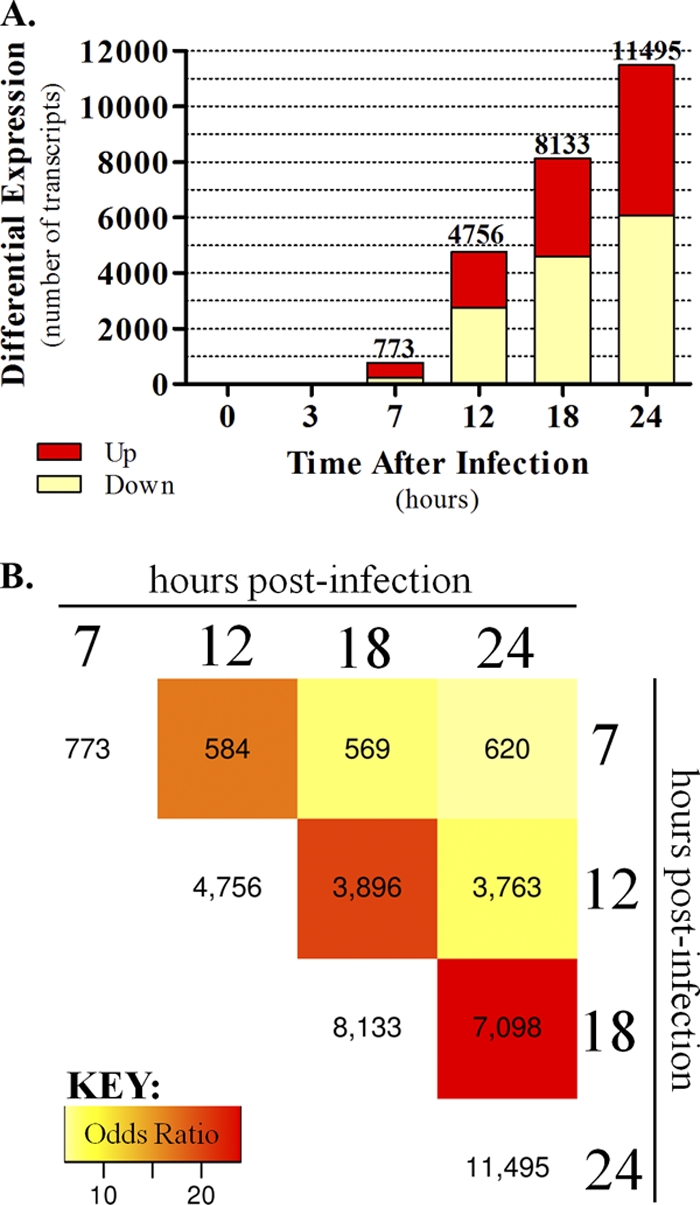
Differential gene expression in VN1203 infections. (A) Total cellular RNA was harvested from the same infected monolayers as those described for Fig. 1, and we used microarray analysis to identify 13,156 transcripts that were differentially expressed (DE) (DE means an absolute log2 fold change of 1.5 and an FDR-adjusted P value of <0.05) in at least one time point after VN1203 infection. DE was determined by comparing VN1203-infected samples to time-matched mock-infected controls. The total number of differentially expressed genes is indicated above each time point bar, and upregulated and downregulated genes are indicated by the red and light yellow portions of the stacked bars, respectively. (B) The overlap in DE between all time points was found to be significant (<10−6 by Fisher's exact test). The heat map shows the number of common DE transcripts between all time points after 7 hpi. Heat map colors represent odds ratio values and an increasing overlap for later time points.
A system biology strategy for unraveling the VN1203 host response.
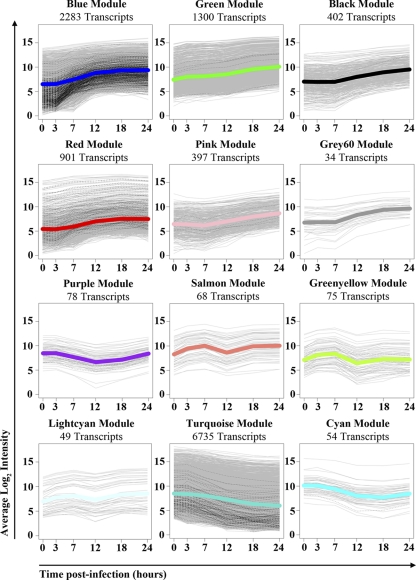
WGCNA was used to simplify the VN1203 transcriptional response into groups of discrete signaling modules and to elucidate underlying kinetic signatures. Modules were derived from the top 17,000 most varying transcripts, including more than 90% of DE transcripts (as defined above). We used the statistical measure of variance to include additional transcripts that change subtly, which might not meet stringent fold change criteria but may still be important to the host response. As a result, our signaling modules include greater coverage of the Calu-3 transcriptome and provide additional insight beyond simply examining a list of DE transcripts. WGCNA identified 12 significant modules, and we refer to these using arbitrarily assigned color labels (as is the standard for this approach). All significant modules are described in Table 1, individual module dynamics are shown in Fig. A3, and all transcripts belonging to validated modules are listed in Table S1 in the supplemental material. Further details regarding network construction, module derivation, and validation are provided in the Appendix. We also examined the biological function of individual modules using GO functional enrichment analysis and identified 576 significant categories across the 12 modules. By comparison, when we used transcript DE status alone and ignored module membership, only 41 enriched GO categories were identified. Representative GO categories for each module are shown in Table 1, and all functional enrichments are included in Table S2 in the supplemental material.
Table 1.
VN1203 influenza host transcriptional modulesa
| Module | Module validationb (P value) | Total no. of transcripts | No. of DE transcripts | FC trend | No. of DE transcripts at 7 hpi | Representative GO functional enrichment (P value) |
|---|---|---|---|---|---|---|
| Blue | 0 | 2,283 | 1,910 (83.7%) | Up | 363 | Inflammatory response, chemotaxis response to wounding, response to virus |
| Green | 0 | 1,300 | 1,217 (93.6%) | Up | 5 | Ion transport, synaptic transmission, keratinization, immune system process |
| Black | 0 | 402 | 336 (83.6%) | Up | 1 | Negative regulation of transcription, chromatin modification, nonsense-mediated decay |
| Red | 0 | 901 | 649 (72%) | Up | 88 | NA |
| Pink | 0 | 397 | 315 (79.3%) | Up | 4 | Transcription, negative regulation of transcription |
| Grey 60 | 0 | 34 | 30 (88.2%) | Up | 0 | Response to stress, establishment and/or maintenance of chromatin architecture |
| Purple | 0 | 78 | 32 (41.0%) | Mixed | 4 | Cell cycle, transcription, RNA elongation |
| Salmon | 0 | 68 | 0 (0.0%) | Mixed | 0 | NA |
| Green-yellow | 0.004 | 75 | 0 (0.0%) | Mixed | 1 | NA |
| Light cyan | 0 | 49 | 12 (24.5%) | Mixed | 0 | Phosphate transport |
| Turquoise | 0 | 6,735 | 5,407 (80.3%) | Down | 103 | Regulation of Ras protein signal transduction, carbohydrate metabolic process, tRNA aminoacylation for protein translation, protein complex assembly, regulation of Rho protein signal transduction, protein transport, M phase of mitotic cell cycle |
| Cyan | 0 | 54 | 45 (83.3%) | Down | 1 | RNA splicing, regulation of apoptosis |
WGCNA-derived modules were assessed for differential expression, general trending, and contribution to the early response. DE, differential expression; FC, fold change; NA, not available (i.e., no functional categories were enriched).
A validation test was performed by comparing each module's average topological overlap (TO) similarity (i.e., the similarity in transcript expression patterns) to those of randomly sampled transcripts of the same group size. We also show representative Gene Ontology (GO) categories found to be enriched using hypergeometrics (FDR-adjusted P value, <0.05). See Table S2 in the supplemental material for all enriched GO categories and their corresponding P values.
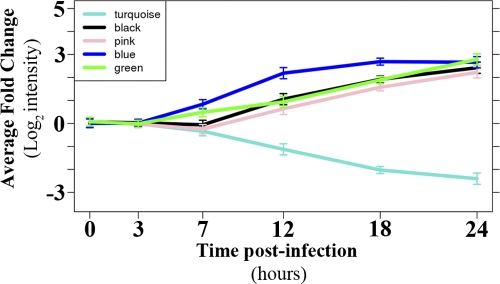
The largest module (turquoise), containing the majority of downregulated transcripts, exhibited functional enrichment in basic cellular homeostatic processes (e.g., carbohydrate metabolism and protein transport) and the mitotic phase of the cell cycle (Table 1; also see Table S2 in the supplemental material). The majority of turquoise module transcripts were strongly downregulated from 12 hpi and beyond, as demonstrated by the eigengene summary (Fig. 3). Moreover, only 13.3% of transcripts that were DE at 7 hpi mapped to the turquoise module, suggesting a minimal contribution to early signaling events that regulate the response to infection. Among the modules containing upregulated transcripts, the blue module was the largest, contained the most abundant early DE (47% of all DE transcripts at 7 hpi) (Table 1 and Fig. 3), and was strongly enriched for biological processes involved in the innate immunity and other aspects of the immune system (Table 1; also see Table S1). These observations strongly suggest an integral role for the blue module in regulating the host response to infection. Immune system process enrichment also was observed in the green module (see Table S2), although green module transcripts generally exhibited delayed and less robust DE relative to that of the blue module (Fig. 3). In addition, the green module exhibited a unique enrichment signature in factors involved in ion homeostasis, synaptic transmission, and keratinization (see Table S2). Other major signaling modules exhibiting upregulation included black and pink, which were primarily upregulated from 12 hpi and beyond (Fig. 3) and were enriched in processes involved in the negative regulation of transcription (see Table S2).
Fig. 3.
VN1203 host response module dynamics. Calu-3 gene expression data were used to construct a host response network from which subnetworks, or modules, were identified as highly connected groups of transcripts. Average log2 fold changes are shown for selected significant VN1203 host response modules, which also are briefly described in Table 1. Lines are colored according to module color designation, and error bars represent standard deviations. Individual average module dynamics are shown for every significant module in Fig. A3 in the appendix.
Cross-species validation of the WGCNA innate immune response module.
The enrichment of the blue module in processes related to the immune function, combined with its heavy bias toward the inclusion of early upregulated DE transcripts, prompted us to examine this module in greater detail. We observed a number of factors with known roles in initiating and regulating the innate response to influenza virus infection, including IFIH1/MDA-5, NFKB1, and type I (α4, α5, α8, and β1) and type III (IL-28A, IL-28B, and IL-29) interferons, as well as multiple antiviral genes whose expression is activated by interferons, including MX1, RSAD2, IFITM2, IFITM3, OAS2, and OASL (3, 26–28, 32, 41, 42, 44, 48, 49, 53). In addition, proinflammatory cytokine and chemokine molecules that exhibit enhanced upregulation in airway epithelium and in vivo following HPAI infection (e.g., CCL5, CXCL10, IL-6, and TNF) also were present (5, 6). Transcripts mapping to these genes were included in blue module GO categories for inflammatory response, chemotaxis, and response to virus (Table 1; also see Table S2 in the supplemental material).
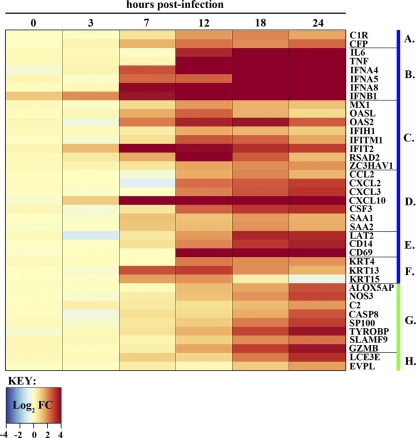
To identify novel blue module transcripts able to regulate the VN1203 immune response in vivo, we compared our data to those for transcripts that were upregulated in mouse lung in response to VN1203 from a previously published study (8). The examination of the overall conservation between mouse and Calu-3 cells showed a significant overlap (hypergeometric P of 1.34 × 10⁻⁹) of 511 upregulated transcripts, of which 121 belonged to the blue module. The expression of a subset of the overlapping blue module transcripts is shown in Fig. 4, and a list of all overlapping transcripts is included in Table S3 in the supplemental material. Among these are factors involved in the complement cascade, macrophage recruitment and function, neutrophil recruitment, proliferation and function, the acute-phase inflammatory response, and a matching pair of cytokeratin proteins.
Fig. 4.
Expression dynamics of selected blue and green module transcripts that intersect with upregulated transcripts in VN1203-infected mice (8). Fold changes (FC) for individual transcripts are depicted on a log2 scale, with a blue-to-dark-red gradient indicating down- and upregulation, respectively. Time points are shown at the top, and specific gene names are indicated to the right. Genes are grouped according to membership in either the blue or green module (denoted by the blue or green bars to the right of the gene name) and function: (A) complement, (B) acute phase response cytokines, (C) interferon stimulated genes, (D) molecules with chemotactic activity, (E) immune signaling molecules, (F) keratin genes, (G) other immune response-related molecules, and (H) keratinization genes.
To validate our findings, the increase of two novel overlapping blue module transcripts (IFIT2 and CSF3) was confirmed by qPCR in both Calu-3 cells and mice infected with VN1203 (Fig. 5). IFIT2 is an interferon-stimulated gene involved in translational repression, and CSF3 is a cytokine involved in the regulation of neutrophil production, differentiation, and function. The role of these genes in the host response to influenza virus in bronchial epithelial cells has not been characterized previously. Consistently with our microarray data (Fig. 4), qPCR analysis showed an early (7 h), nearly 10-fold increase in IFIT2 expression, sustained upregulation at 12 h, and decreased expression thereafter (Fig. 5A). In mice, IFIT2 was abundantly expressed by 2 days postinfection (dpi) and remained upregulated for all subsequent time points, although a slight reduction in expression was observed at day 4 (Fig. 5B). CSF3 transcript behavior mirrored that of IFIT2 in both Calu-3 cells and mice at early time points (7 h and 2 days, respectively) and was upregulated at all subsequent time points in both systems (Fig. 5A and B). These observations indicate that blue module transcripts are correlated primarily at early time points and further imply that blue module transcript expression is regulated similarly in both Calu-3 cells and mice.
Fig. 5.
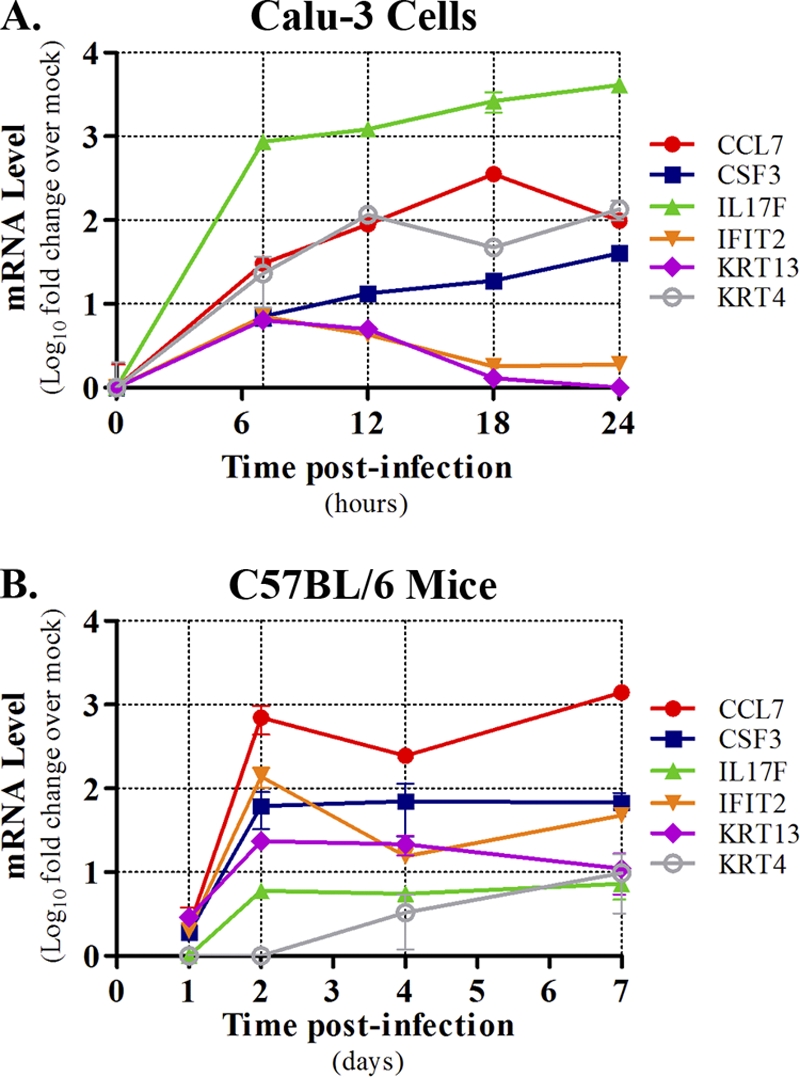
Validation of specific blue module transcripts in VN1203-infected Calu-3 cells and C57BL/6 mouse lungs. Total RNA isolated from VN1203-infected Calu-3 cultures (A) or lungs of VN1203-infected mice (B) was subjected to qPCR using gene-specific primers. Transcript fold changes were quantified based on time-matched mock-infected controls and are expressed as log10 mean values ± standard deviations from at least two biological replicates. The model system is indicated above each panel, and a key is shown to the right of each graph.
Notably, some blue module transcripts encoding highly upregulated inflammatory mediators (e.g., RAGE, CCL5, CCL7, and IL-17F) were not identified as differentially expressed in the previously published mouse study (8) but have been implicated in influenza virus pathogenesis (11, 13, 40, 47). Thus, we also assessed the expression dynamics of two of these factors (CCL7 and IL-17F) by qPCR in Calu-3 cells and mice infected with VN1203 (Fig. 5). Indeed, both CCL7 and IL-17F were strongly upregulated in Calu-3 cells by 7 hpi and continued to demonstrate strong upregulation at all subsequent time points (Fig. 5A). In mice, both CCL7 and IL-17F were upregulated at days 2, 4, and 7 (Fig. 5B). Although the magnitude of expression differed between all four transcripts (IFIT2, CSF3, CCL7, and IL-17F) in both systems, it is notable that the overall expression patterns generally were very well correlated. Thus, the expression of blue module transcripts are likely to be regulated by similar mechanisms in Calu-3 cells and in vivo, implying a role for airway epithelium in the immune response to, and pathogenesis associated with, HPAI H5N1 infection.
Early and late activation of keratinization signaling.
As a mechanism of identifying novel signaling pathways involved in the host response, we were interested in identifying host factors without previously established functions in responding to VN1203 infection. With regard to this, we noticed that the blue module contained 18 transcripts, enriched with a q value of 0.0014, in the intermediate filaments category (GO 0005882), of which 16 corresponded to keratin genes (see Table S2 in the supplemental material). The keratin filament network provides structural support for the cell and is involved in the regulation of apoptosis (31). Because HPAI H5N1 viruses strongly induce apoptosis in epithelial cells (12), we initially set out to determine whether we could find any connection between keratin transcript expression and apoptosis.
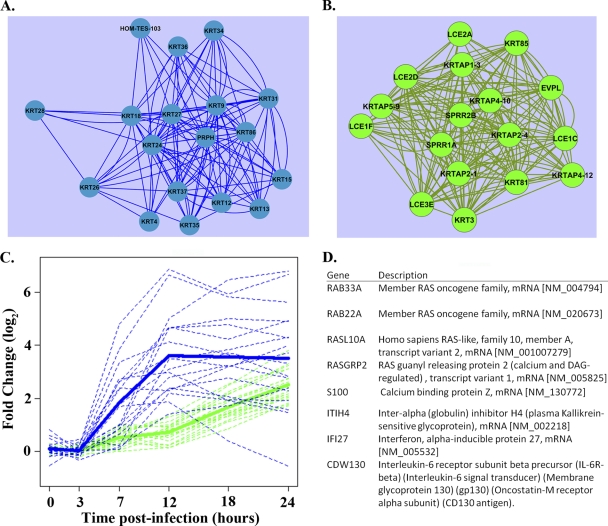
Blue module keratin transcripts were coordinately upregulated after VN1203 infection (Fig. 6 A) and exhibited expression patterns similar to those of early increases in inflammatory cytokine gene expression (Fig. 6C). Specifically, the majority of the blue module keratin transcripts were upregulated early, prominently, and in a sustained manner for the remainder of the infection time course. Moreover, the upregulation of two of these transcripts (KRT4 and KRT13) were validated at the qPCR level in Calu-3 cells and mice infected with VN1203, and their expression profiles were similar to that of other blue module transcripts in both systems (Fig. 5). Unusually, 8 of the 16 upregulated keratin transcripts are expressed only in hair (KRT26, KRT27, KRT31, KRT34, KRT35, KRT36, KRT37, and KRT86), and it is interesting that all but one hair keratin (KRT86) are type I acidic keratin molecules whose genes are clustered together on chromosome 17 (37). These observations indicate that VN1203 activates an atypical keratin gene expression program in a manner similar to that of inflammatory mediators and raise the possibility that keratin molecules, or the signaling pathway that induces their expression, contribute to shaping the host response to VN1203 infection.
Fig. 6.
Evidence of keratinization signaling. Both blue and green correlation network modules were found to be enriched for GO biological categories related to keratin filaments and keratinization. We examined the top 5% strongest connections of each keratin-associated gene product and illustrate their intraconnected edges in the blue (A) and green (B) modules. (C) The graph shows that members of the blue module are induced earlier than members of the green module. Thick lines represent average log2 fold changes of members of graphs A and B, and the dotted lines represent individual transcript dynamics. (D) The blue module keratin-associated gene products were found to be highly connected with RAS signaling transcripts. The table lists transcripts found in the top 1% strongest connections to graph A. Connectivity was assessed using the topological overlap measure (see Appendix).
Interestingly, another early response module (green) showed enrichment for keratin filaments (GO 0045095; nine transcripts) and factors involved in keratinization (GO 0031424; eight transcripts) (see Table S2 in the supplemental material). Epithelial cells undergoing the keratinization differentiation process are characterized by the production of a keratin-based cornified envelope. Green module keratin and keratinization genes showed correlated expression (Fig. 6B) and prominent upregulation during the late phase of infection (12 to 24 hpi; Fig. 6C), implying that their expression is modulated by earlier changes in the host environment. Seven green module keratin filament factors encode keratin-associated proteins that facilitate keratin fiber matrix formation (the KRTAP genes), and seven of the keratinization transcripts encode components of late cornified envelopes (LCE and SPRR factors and EVPL). It is notable that genes encoding LCE factors have been reported to respond in a group-wise manner to environmental stimuli, including calcium (21), and that two of the green module transcripts (LCE3E and EVPL) were upregulated in mice infected with VN1203 (Fig. 4). Taken together, these observations suggest the novel concept that VN1203 induces a transcriptional program that, in some respects, mimics that of keratinocyte differentiation.
To identify novel signaling associated with each module's keratin-annotated transcripts, we next examined the top 1% most strongly connected transcripts of each transcript within the host response network. For example, Fig. 6D highlights three members of the RAS oncogene family (RAB33A, RAB22A, and RASL10A) that are strongly connected to the early response keratin network shown in Fig. 6A. Other strongly connected factors imply a role for calcium (RASGRP2 and S100), IL-6 signal transduction (CDW130), and the interferon-induced antiviral state (IFI27) in RAS activation and the regulation of the keratin signaling network, all of which are activated in response to HPAI H5N1 viruses (Fig. 4) (25, 35, 45). The transcripts shown in Fig. 6D were more strongly connected to the blue module keratin transcripts than to green module, and this disparity indicates that RAS pathway and keratin signaling coregulation are associated with the early response to VN1203 infection but not necessarily the later host response. The strong connectivity of a transcriptional response that includes the early innate immune response (CDW130 and IFI27) with RAS and keratin signaling implies that these respective pathways regulate one another in response to influenza virus infection.
Comparison to H1N1 NL602 host response in human bronchial epithelial cells.
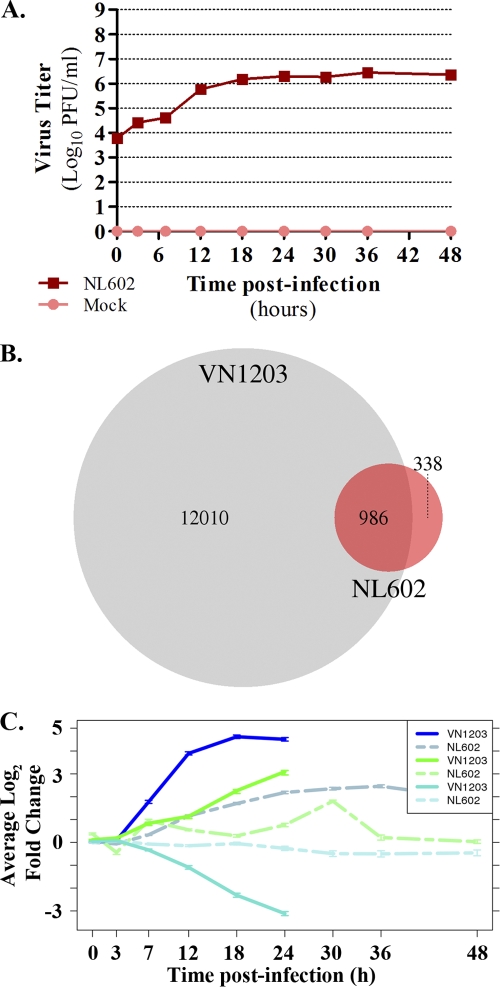
Thus far, we have described novel factors and signaling networks upregulated by VN1203 infection which we have argued could contribute to the VN1203 host response. To determine whether these observations are specific for VN1203 infection or if they also are induced by influenza viruses of lower pathogenicity, we compared our results to those for the Calu-3 transcriptional response induced by influenza A/Netherlands/602/2009 (H1N1, NL602), an early human isolate from the 2009 H1N1 pandemic (24). Similarly to VN1203 infections, NL602 exhibited the efficient release of infectious viruses starting from 7 hpi (Fig. 7 A). In contrast, the observation of CPE in NL602 infections was delayed, with only minor effects starting around 24 hpi (data not shown). Using the same definition of DE described for VN1203 infections, we observed a significantly muted host response after NL602 infection, with only 1,731 DE transcripts during 48 h. Unlike VN1203 infections, which first exhibited DE at 7 hpi (Fig. 2A), DE was not observed in NL602 infections until 12 hpi (105 transcripts) and peaked at 36 hpi (1,156 transcripts) (data not shown). An overlap of 986 transcripts was observed between VN1203 and NL602 infections (Fig. 7B), and this was statistically significant (P < 10−6 by Fisher's exact test) despite the comparatively large amount of VN1203 host response DE.
Fig. 7.
NL602 replication and host DE in Calu-3 cells. Calu-3 cells were infected with influenza A/Netherlands/602/2009 (H1N1) and subjected to microarray analysis at 0, 3, 7, 12, 18, 24, 30, 36, and 48 hpi. (A) Virus titers in the supernatants (six replicates) were quantified by plaque assay in MDCK cells and are represented on a log10 scale ± standard deviations. (B) Host differential expression was quantified for NL602 infections as described for VN1203, and considerably fewer transcripts were differentially expressed in Calu-3 cells infected with NL602 (1,731) than with VN1203 (13,156). As indicated by the Venn diagram, a significant number of these transcripts (986) were common between viruses (P < 10−6 by Fisher's exact test). (C) Comparison of blue, green, and turquoise module transcripts (modules identified for VN1203) in common between VN1203 and NL602. The average log2 fold changes of DE transcripts are shown, with solid lines representing DE in VN1203 infections and dotted lines representing DE in NL602 infections. Line graph colors correspond to module names, and error bars correspond to standard errors.
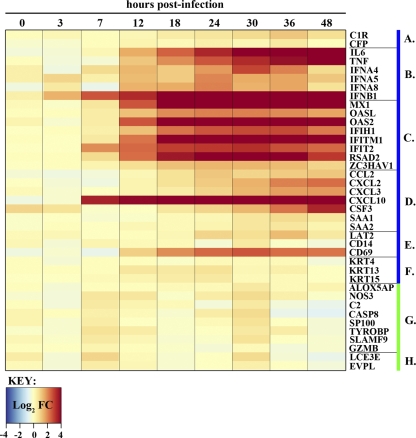
Transcriptional modules identified from VN1203 infections were used to analyze the dynamics of the NL602 host response. Because of the imbalance in the number of DE transcripts between the two infection conditions, we directly compared transcripts that were commonly DE. Focusing on the three largest VN1203 WGCNA modules, 416 transcripts were common between the blue module and NL602 infections, 183 transcripts were shared with the turquoise module, and 26 transcripts were in common with the green module (data not shown). The average log2 fold changes of module transcripts clearly indicate an attenuated magnitude for the NL602 host response (Fig. 7C). A direct comparison of the expression levels of VN1203 blue and green module transcripts whose upregulation was conserved in VN1203 infections in mice (Fig. 4) to the expression levels of the same transcripts in NL602-infected Calu-3 cells revealed additional differences as well as some similarities (Fig. 8). Surprisingly, IFN-β1, CXCL10, and interferon-stimulated gene expression profiles generally were similar in both infections. We observed the delayed expression of IL-6, TNF, and CSF3 in NL602 infections, although peak expression levels appeared to be similar (compare Fig. 4 to Fig. 8). The most notable differences were observed for several cytokine molecules, including IFN-α4, IFN-α5, and IFN-α8, which were highly expressed after VN1203 infection but showed little to no upregulation with NL602, and the keratin signaling networks from the VN1203 blue and green modules, which failed to show any DE after NL602 infection. Thus, VN1203-induced host gene expression and signaling networks identified using WGCNA are only partially conserved with NL602, offering the opportunity to elucidate mediators of the HPAI H5N1 host response.
Fig. 8.
Host transcript expression profile in NL602-infected Calu-3 cells. A heat map shows NL602 cellular gene expression over time for the same transcripts as those shown in Fig. 4. Fold changes for individual transcripts are depicted on a log2 scale, with a blue-to-dark-red gradient indicating down- and upregulation, respectively. The gene groups depicted in lanes A to H are the same as those described in the Fig. 4 legend.
DISCUSSION
Here, we have utilized an established system biology analysis method, WGCNA, to build networks and interpret transcriptional events in response to HPAI H5N1 infection in human bronchial epithelial cells. Temporally measured infection metrics, including CPE, viral mRNA, and virus titer, indicated a robust in vitro infection, and we are able to identify temporal transcriptional subnetworks that coincide. By using this approach, unlike what would be possible with standard differential expression analysis, we were able to identify both known and novel mediators of HPAI H5N1 pathogenesis derived from a subnetwork enriched in immune functions. The validation of upregulation (using qPCR) among these known mediators indicated that they also were upregulated with similar dynamics in vivo. Further, we report on novel signaling events regulating keratin filament expression and function that may have a unique role in the host response to HPAI H5N1 infection.
Multiple studies have demonstrated that airway epithelial cells infected with influenza virus can produce CCL2 and CCL5 (chemokines involved in macrophage recruitment) as well as IFN-β1, CXCL10, IL-6, and TNF (cytokines involved in promoting inflammation), implying a role for epithelial cells in the regulation of immune cell lung infiltration and activation after exposure to influenza viruses (4, 6, 7, 20, 52, 55). In addition, some of these molecules exhibit enhanced upregulation in response to HPAI H5N1 viruses (6, 7, 55), which could contribute to the increased immune cell infiltrates observed after HPAI H5N1 infection (32, 33). Transcripts for all of these chemokine and cytokine molecules were upregulated in VN1203-infected Calu-3 cells and mapped to the WGCNA-derived blue module. Given the prominent role for these molecules in the regulation of the inflammatory response, we suggest that other blue module transcripts function in the regulation of HPAI H5N1 pathogenesis as well.
One blue module transcript of particular interest is CCL7, a pleiotropic chemokine that activates all classes of leukocytes through interactions with three chemokine receptors: CCR1, CCR2, and CCR3. CCL7 has been observed in nasal aspirates of influenza virus-infected children (40), but its role in influenza pathogenesis has not been determined. Our qPCR validation experiments revealed a >380-fold increase in CCL7 expression in Calu-3 cells; in mice, CCL7 exhibited profound early upregulation, supporting a role for airway epithelium in CCL7 production. While we were unable to directly compare CCL7 expression between VN1203 and NL602 infections in Calu-3 cells (because the CCL7 probe did not pass our quality-control filters in the NL602 experiment), we did not observe any upregulation of this transcript in similar infections with influenza A/California/04/2009 (H1N1) (C. Li, A. Bankhead, A. Eisfeld, M. G. Katze, S. McWeeney, and Y. Kawaoka, unpublished results). The expression of CCL7 is enhanced by TNF and IL-1β (46), which both are highly expressed in response to HPAI infections. Moreover, it was recently established that the combined signaling of the TNF and IL-1 receptors promotes maximal lung inflammation in response to infection with 1918 influenza virus, another pathogenic influenza virus strain that may cause mortality through the aberrant induction of hypercytokinemia (34). Another recent report that compared the host transcriptional response between seasonal and pandemic H1N1 viruses in ferrets showed little to no upregulation of CCL7 in infected lungs (38). Thus, we suggest that CCL7 expression, enhanced by the aberrant upregulation of TNF and/or IL-1, could be a major player in HPAI H5N1-associated pathogenesis.
The IL-17F cytokine transcript also mapped to the blue module. It has been demonstrated that the IL-17F receptor, IL-17RA, is not required for H1N1 influenza virus clearance from the lung, and that the absence of this receptor reduces acute lung injury associated with infection (11). IL-17F is a cytokine that typically is expressed by activated T cells; is known to activate the expression of IL-6, IL-8, granulocyte-macrophage colony-stimulating factor (GM-CSF), and CCL2; can induce the chemotaxis of neutrophils; and can be amplified by the expression of TNF (16). Because of its role in influenza-mediated lung injury and its ability to amplify the inflammatory response, we hypothesize that IL-17F plays a role in HPAI H5N1-mediated pathogenesis. Our results show that IL-17F expression in VN1203-infected Calu-3 cells increased approximately 4,000-fold relative to that of mock-infected cells by 24 hpi, and in vivo qPCR measurements showed a 6-fold upregulation at 2 days postinfection in mouse lungs, which persisted for the remainder of the experiment. In contrast, NL602-infected Calu-3 cells exhibited a very modest 2-fold upregulation of this cytokine at a single time point (30 h; data not shown). It will be important to determine whether IL-17F, as well as other inflammation-amplifying molecules, play a role in hypercytokinemia associated with HPAI infection.
Two VN1203 transcriptional modules (blue and green) were enriched for transcripts associated with keratin filaments and keratinization. Epithelial cell keratinization is a differentiation process that produces the outer layer of the skin, hair, and nails, and it results in the production of a cornified cellular envelope consisting of large bundles of cross-linked keratin filaments. In addition, because keratinocytes form a barrier function between the environment and host, they are potent producers of TNF, IL-1β, and other inflammatory molecules in response to invading pathogens (54). The upregulation of multiple factors involved in the formation of the cornified envelope, and in particular their highly correlated expression patterns, suggested that VN1203-infected Calu-3 cells share common features with the transcriptional program of keratinocytes. Interestingly, keratinocytes can exhibit a shutdown of cellular metabolic processes under inflammatory conditions in which type III interferons (i.e., IL-28 and IL-29) are produced (51). This is consistent with our observations that (i) all three type III interferon molecules are strongly activated in response to VN1203 infection in Calu-3 cells and (ii) the turquoise module network, which was rich in GO annotation for cellular metabolic and homeostatic functions, contained a large number of downregulated transcripts. Because a virus of lower pathogenicity (i.e., NL602) does not appear to stimulate the induction of a similar keratin and keratinization transcriptional program and also fails to induce a robust downregulatory transcriptional effect (data not shown), it is tempting to speculate that this is one piece of the complicated enigma of aberrant hypercytokinemia associated with HPAI H5N1 infections. Additional studies will be required to determine whether this is the case.
In summary, our results demonstrate that a system biology analysis strategy, such as WGCNA, can be used to discern biological meaning from the tremendous transcriptional host response to HPAI H5N1 infection. The examination of our findings in mouse highlights the conservation of host response across species, and comparisons between influenza virus strains highlight differences in host response signaling networks that may be related to pathogenicity. This work provides a rich context for guiding novel avenues for perturbation studies and potential therapeutic intervention for fatal HPAI H5N1 disease.
Supplementary Material
ACKNOWLEDGMENTS
This work was made possible by funding from the National Institute of Allergy and Infectious Diseases, NIH, Department of Health and Human Services contract HHSN272200800060C, and by National Institute of Allergy and Infectious Diseases Public Health Service research grants.
APPENDIX
Network construction and module identification.
WGCNA analysis was performed using three key steps (Fig. A1). Weighted correlation networks require that correlation values be transformed using a thresholding parameter called β (equation A1), so that resulting networks exhibit a scale-free topology. Tuning β so that our network is scale free causes the network's edge distribution to follow a power law; scale-free networks have been observed in many biological systems and are considered to be a feature of biologically realistic networks (1).
| (1) |
To determine how many transcripts to include in our analysis, we examined the relationship between the most varying transcripts and the coverage of all 13,156 DE transcripts. Using this strategy, we used the top 17,000 most varying transcripts across all time points to cover more than 90% of DE transcripts and produce a scale-free network using a β of 18. To more readily identify tightly connected subnetworks, we examined each transcript's correlation neighborhood using the topological overlap (TO) measure:
| (2) |
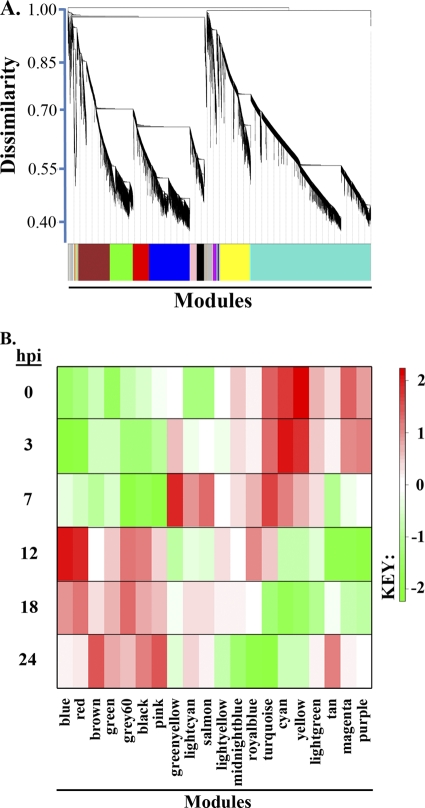
Average hierarchical clustering then was used to identify groups of transcripts that have low TO dissimilarity (1 − TO), resulting in a dendrogram with branches that represent groups of highly interconnected transcripts. Significant subnetworks or modules were derived from the dendrogram using the dynamic tree cut algorithm, ignoring transcripts with TO dissimilarity greater than 0.9. This iterative and adaptive procedure traverses the dendrogram, breaking apart noisy subclusters, and iterates until the number of clusters becomes stable (23). Figure A2 A shows the hierarchical clustering dendrogram based on TO dissimilarity resulting from the 17,000 most varying transcripts. The algorithm identified 20 modules, which were arbitrarily assigned color names for identification purposes. We summarize all 20 modules as module eigengenes (ME), shown as a heat map in Fig. A2B, where the red-to-green gradient represents a log2 Kruskal-Wallis P value relative to all other MEs.
Fig. A1.
Flowchart of the microarray module analysis pipeline used to identify subnetworks describing the transcriptional host response to VN1203 infection.
Fig. A2.
(A) Dendrogram describes the transcriptional host response network structure. Transcripts are represented as vertical lines and are arranged in branches according to TO similarity using hierarchical clustering. The dynamic treecut algorithm was used to automatically detect 20 highly connected subnetworks or modules, referred to by a color designation. Module color designations are shown below the heat map, and time points are to the left. (B) Modules are summarized as eigengenes by taking the first principal component of the module member's intensity values. Heat map colors indicate relative direction and intensity of each module's eigengene for a given time point according to a Kruskal-Wallis statistic. Shades of red indicate upregulation, while shades of green indicate downregulation.
A module TO validation test then was performed to assess the significance to intramodular connectivity. The averages of a given module's TO values were compared to randomly selected groups of transcripts of the same size to test how a module's connectivity compares to what would be expected by chance (30). Ten thousand random permutations were performed to derive a P value for each module. Using a threshold of 0.05, 12 modules showed significant connectivity, and these are shown in Table 1 and Fig. A3.
Fig. A3.
Twelve modules were identified as host response subnetworks that are significantly connected using the topological overlap measure. For each plot, gray lines mark averaged log2 intensities for individual module transcripts, with the subset of transcripts upregulated at 7 hpi represented by black dashed lines. Thick lines represent the average module log2 intensity and are colored according to module color designation. The total number of transcripts mapping to each module is indicated above each plot.
Footnotes
Supplemental material for this article may be found at http://jvi.asm.org/.
Published ahead of print on 24 August 2011.
REFERENCES
- 1. Albert R. 2005. Scale-free networks in cell biology. J. Cell Sci. 118:4947–4957 [DOI] [PubMed] [Google Scholar]
- 2. Beigel J. H., et al. 2005. Avian influenza A (H5N1) infection in humans. N. Engl. J. Med. 353:1374–1385 [DOI] [PubMed] [Google Scholar]
- 3. Brass A. L., et al. 2009. The IFITM proteins mediate cellular resistance to influenza A H1N1 virus, West Nile virus, and dengue virus. Cell 139:1243–1254 [DOI] [PMC free article] [PubMed] [Google Scholar]
- 4. Brydon E. W., Smith H., Sweet C. 2003. Influenza A virus-induced apoptosis in bronchiolar epithelial (NCI-H292) cells limits pro-inflammatory cytokine release. J. Gen. Virol. 84:2389–2400 [DOI] [PubMed] [Google Scholar]
- 5. Cameron C. M., et al. 2008. Gene expression analysis of host innate immune responses during lethal H5N1 infection in ferrets. J. Virol. 82:11308–11317 [DOI] [PMC free article] [PubMed] [Google Scholar]
- 6. Chan M. C., et al. 2005. Proinflammatory cytokine responses induced by influenza A (H5N1) viruses in primary human alveolar and bronchial epithelial cells. Respir. Res. 6:135. [DOI] [PMC free article] [PubMed] [Google Scholar]
- 7. Chan R. W., et al. 2010. Influenza H5N1 and H1N1 virus replication and innate immune responses in bronchial epithelial cells are influenced by the state of differentiation. PLoS One 5:e8713. [DOI] [PMC free article] [PubMed] [Google Scholar]
- 8. Cilloniz C., et al. 2010. Lethal dissemination of H5N1 influenza virus is associated with dysregulation of inflammation and lipoxin signaling in a mouse model of infection. J. Virol. 84:7613–7624 [DOI] [PMC free article] [PubMed] [Google Scholar]
- 9. Cillóniz C., et al. 2009. Lethal influenza virus infection in macaques is associated with early dysregulation of inflammatory related genes. PLoS Pathog. 5:e1000604. [DOI] [PMC free article] [PubMed] [Google Scholar]
- 10. Conenello G. M., et al. 2011. A single N66S mutation in the PB1-F2 protein of influenza A virus increases virulence by inhibiting the early interferon response in vivo. J. Virol. 85:652–662 [DOI] [PMC free article] [PubMed] [Google Scholar]
- 11. Crowe C. R., et al. 2009. Critical role of IL-17RA in immunopathology of influenza infection. J. Immunol. 183:5301–5310 [DOI] [PMC free article] [PubMed] [Google Scholar]
- 12. Daidoji T., et al. 2008. H5N1 avian influenza virus induces apoptotic cell death in mammalian airway epithelial cells. J. Virol. 82:11294–11307 [DOI] [PMC free article] [PubMed] [Google Scholar]
- 13. de Jong M. D., et al. 2006. Fatal outcome of human influenza A (H5N1) is associated with high viral load and hypercytokinemia. Nat. Med. 12:1203–1207 [DOI] [PMC free article] [PubMed] [Google Scholar]
- 14. Durinck S., et al. 2005. BioMart and Bioconductor: a powerful link between biological databases and microarray data analysis. Bioinformatics 21:3439–3440 [DOI] [PubMed] [Google Scholar]
- 15. Edgar R., Domrachev M., Lash A. E. 2002. Gene Expression Omnibus: NCBI gene expression and hybridization array data repository. Nucleic Acids Res. 30:207–210 [DOI] [PMC free article] [PubMed] [Google Scholar]
- 16. Eyerich S., Eyerich K., Cavani A., Schmidt-Weber C. 2010. IL-17 and IL-22: siblings, not twins. Trends Immunol. 31:354–361 [DOI] [PubMed] [Google Scholar]
- 17. Falcon S., Gentleman R. 2007. Using GOstats to test gene lists for GO term association. Bioinformatics 23:257–258 [DOI] [PubMed] [Google Scholar]
- 18. Fornek J. L., et al. 2009. A single-amino-acid substitution in a polymerase protein of an H5N1 influenza virus is associated with systemic infection and impaired T-cell activation in mice. J. Virol. 83:11102–11115 [DOI] [PMC free article] [PubMed] [Google Scholar]
- 19. Gentleman R. C., et al. 2004. Bioconductor: open software development for computational biology and bioinformatics. Genome Biol. 5:R80. [DOI] [PMC free article] [PubMed] [Google Scholar]
- 20. Herold S., et al. 2006. Alveolar epithelial cells direct monocyte transepithelial migration upon influenza virus infection: impact of chemokines and adhesion molecules. J. Immunol. 177:1817–1824 [DOI] [PubMed] [Google Scholar]
- 21. Jackson B., et al. 2005. Late cornified envelope family in differentiating epithelia-response to calcium and ultraviolet irradiation. J. Investig. Dermatol. 124:1062–1070 [DOI] [PubMed] [Google Scholar]
- 22. Langfelder P., Horvath S. 2008. WGCNA: an R package for weighted correlation network analysis. BMC Bioinformatics 9:559. [DOI] [PMC free article] [PubMed] [Google Scholar]
- 23. Langfelder P., Zhang B., Horvath S. 2008. Defining clusters from a hierarchical cluster tree: the Dynamic Tree Cut package for R. Bioinformatics 24:719–720 [DOI] [PubMed] [Google Scholar]
- 24. Manicassamy B., et al. 2010. Protection of mice against lethal challenge with 2009 H1N1 influenza A virus by 1918-like and classical swine H1N1 based vaccines. PLoS Pathog. 6:e1000745. [DOI] [PMC free article] [PubMed] [Google Scholar]
- 25. Marjuki H., et al. 2006. Membrane accumulation of influenza A virus hemagglutinin triggers nuclear export of the viral genome via protein kinase Cα-mediated activation of ERK signaling. J. Biol. Chem. 281:16707–16715 [DOI] [PubMed] [Google Scholar]
- 26. Matikainen S., et al. 2006. Tumor necrosis factor alpha enhances influenza A virus-induced expression of antiviral cytokines by activating RIG-I gene expression. J. Virol. 80:3515–3522 [DOI] [PMC free article] [PubMed] [Google Scholar]
- 27. Melchjorsen J., et al. 2009. Differential regulation of the OASL and OAS1 genes in response to viral infections. J. Interferon Cytokine Res. 29:199–207 [DOI] [PubMed] [Google Scholar]
- 28. Mordstein M., et al. 2008. Interferon-lambda contributes to innate immunity of mice against influenza A virus but not against hepatotropic viruses. PLoS Pathog. 4:e1000151. [DOI] [PMC free article] [PubMed] [Google Scholar]
- 29. Neumann G., et al. 1999. Generation of influenza A viruses entirely from cloned cDNAs. Proc. Natl. Acad. Sci. U. S. A. 96:9345–9350 [DOI] [PMC free article] [PubMed] [Google Scholar]
- 30. Oldham M. C., Horvath S., Geschwind D. H. 2006. Conservation and evolution of gene coexpression networks in human and chimpanzee brains. Proc. Natl. Acad. Sci. U. S. A. 103:17973–17978 [DOI] [PMC free article] [PubMed] [Google Scholar]
- 31. Omary M. B., Ku N. O., Strnad P., Hanada S. 2009. Toward unraveling the complexity of simple epithelial keratins in human disease. J. Clin. Investig. 119:1794–1805 [DOI] [PMC free article] [PubMed] [Google Scholar]
- 32. Peiris J. S., Cheung C. Y., Leung C. Y., Nicholls J. M. 2009. Innate immune responses to influenza A H5N1: friend or foe? Trends Immunol. 30:574–584 [DOI] [PMC free article] [PubMed] [Google Scholar]
- 33. Perrone L. A., Plowden J. K., Garcia-Sastre A., Katz J. M., Tumpey T. M. 2008. H5N1 and 1918 pandemic influenza virus infection results in early and excessive infiltration of macrophages and neutrophils in the lungs of mice. PLoS Pathog. 4:e1000115. [DOI] [PMC free article] [PubMed] [Google Scholar]
- 34. Perrone L. A., Szretter K. J., Katz J. M., Mizgerd J. P., Tumpey T. M. 2010. Mice lacking both TNF and IL-1 receptors exhibit reduced lung inflammation and delay in onset of death following infection with a highly virulent H5N1 virus. J. Infect. Dis. 202:1161–1170 [DOI] [PMC free article] [PubMed] [Google Scholar]
- 35. Pleschka S., et al. 2001. Influenza virus propagation is impaired by inhibition of the Raf/MEK/ERK signalling cascade. Nat. Cell Biol. 3:301–305 [DOI] [PubMed] [Google Scholar]
- 36. Pollard K. S., Dudoit S., van der Laan M. J. 2004. Multiple testing procedures: R multtest package and applications to genomics, working paper 164. UC Berkeley Division of Biostatistics Working Paper Series. UC Berkeley, Berkeley, CA: http://www.bepress.com/ucbbiostat/paper164 [Google Scholar]
- 37. Rosenberg M., Chaudhury A. R., Shows T. B., Le Beau M. M., Fuchs E. 1988. A group of type I keratin genes on human chromosome 17: characterization and expression. Mol. Cell. Biol. 8:722–736 [DOI] [PMC free article] [PubMed] [Google Scholar]
- 38. Rowe T., et al. 2010. Modeling host responses in ferrets during A/California/07/2009 influenza infection. Virology 401:257–265 [DOI] [PMC free article] [PubMed] [Google Scholar]
- 39. Salomon R., Hoffmann E., Webster R. G. 2007. Inhibition of the cytokine response does not protect against lethal H5N1 influenza infection. Proc. Natl. Acad. Sci. U. S. A. 104:12479–12481 [DOI] [PMC free article] [PubMed] [Google Scholar]
- 40. Santiago J., et al. 2008. Role of monocyte chemotactic protein-3 and -4 in children with virus exacerbation of asthma. Eur. Respir. J. 32:1243–1249 [DOI] [PubMed] [Google Scholar]
- 41. Schmolke M., Viemann D., Roth J., Ludwig S. 2009. Essential impact of NF-kappaB signaling on the H5N1 influenza A virus-induced transcriptome. J. Immunol. 183:5180–5189 [DOI] [PubMed] [Google Scholar]
- 42. Sirén J., et al. 2006. Retinoic acid inducible gene-I and mda-5 are involved in influenza A virus-induced expression of antiviral cytokines. Microbes Infect. 8:2013–2020 [DOI] [PubMed] [Google Scholar]
- 43. Szretter K. J., et al. 2007. Role of host cytokine responses in the pathogenesis of avian H5N1 influenza viruses in mice. J. Virol. 81:2736–2744 [DOI] [PMC free article] [PubMed] [Google Scholar]
- 44. Turan K., et al. 2004. Nuclear MxA proteins form a complex with influenza virus NP and inhibit the transcription of the engineered influenza virus genome. Nucleic Acids Res. 32:643–652 [DOI] [PMC free article] [PubMed] [Google Scholar]
- 45. Ueda M., et al. 2010. Highly pathogenic H5N1 avian influenza virus induces extracellular Ca2+ influx, leading to apoptosis in avian cells. J. Virol. 84:3068–3078 [DOI] [PMC free article] [PubMed] [Google Scholar]
- 46. Van Coillie E., Van Damme J., Opdenakker G. 1999. The MCP/eotaxin subfamily of CC chemokines. Cytokine Growth Factor Rev. 10:61–86 [DOI] [PubMed] [Google Scholar]
- 47. van Zoelen M. A., et al. 2009. Receptor for advanced glycation end products is detrimental during influenza A virus pneumonia. Virology 391:265–273 [DOI] [PMC free article] [PubMed] [Google Scholar]
- 48. Wang J., et al. 2009. Differentiated human alveolar type II cells secrete antiviral IL-29 (IFN-lambda 1) in response to influenza A infection. J. Immunol. 182:1296–1304 [DOI] [PMC free article] [PubMed] [Google Scholar]
- 49. Wang X., Hinson E. R., Cresswell P. 2007. The interferon-inducible protein viperin inhibits influenza virus release by perturbing lipid rafts. Cell Host Microbe 2:96–105 [DOI] [PubMed] [Google Scholar]
- 50. Watanabe T., Watanabe S., Kim J. H., Hatta M., Kawaoka Y. 2008. Novel approach to the development of effective H5N1 influenza A virus vaccines: use of M2 cytoplasmic tail mutants. J. Virol. 82:2486–2492 [DOI] [PMC free article] [PubMed] [Google Scholar]
- 51. Wolk K., Witte K., Sabat R. 2010. Interleukin-28 and interleukin-29: novel regulators of skin biology. J. Interferon Cytokine Res. 30:617–628 [DOI] [PubMed] [Google Scholar]
- 52. Wu W., et al. 2010. Innate immune response to H3N2 and H1N1 influenza virus infection in a human lung organ culture model. Virology 396:178–188 [DOI] [PMC free article] [PubMed] [Google Scholar]
- 53. Xing Z., et al. 2011. Host immune and apoptotic responses to avian influenza virus H9N2 in human tracheobronchial epithelial cells. Am. J. Respir. Cell Mol. Biol. 44:24–33 [DOI] [PMC free article] [PubMed] [Google Scholar]
- 54. Yazdi A. S., Drexler S. K., Tschopp J. 2010. The role of the inflammasome in nonmyeloid cells. J. Clin. Immunol. 30:623–627 [DOI] [PubMed] [Google Scholar]
- 55. Yu W. C., et al. 2011. Viral replication and innate host responses in primary human alveolar epithelial cells and alveolar macrophages infected with influenza H5N1 and H1N1 viruses. J. Virol. 85:6844–6855 [DOI] [PMC free article] [PubMed] [Google Scholar]
- 56. Zhang B., Horvath S. 2005. A general framework for weighted gene co-expression network analysis. Stat. Appl. Genet. Mol. Biol. 4:Article17. [DOI] [PubMed] [Google Scholar]
Associated Data
This section collects any data citations, data availability statements, or supplementary materials included in this article.


