

Abstract
Oomycete species occupy many different environments and many ecological niches. The genera Phytophthora and Pythium for example, contain many plant pathogens which cause enormous damage to a wide range of plant species. Proper identification to the species level is a critical first step in any investigation of oomycetes, whether it is research driven or compelled by the need for rapid and accurate diagnostics during a pathogen outbreak. The use of DNA for oomycete species identification is well established, but DNA barcoding with cytochrome c oxidase subunit I (COI) is a relatively new approach that has yet to be assessed over a significant sample of oomycete genera. In this study we have sequenced COI, from 1205 isolates representing 23 genera. A comparison to internal transcribed spacer (ITS) sequences from the same isolates showed that COI identification is a practical option; complementary because it uses the mitochondrial genome instead of nuclear DNA. In some cases COI was more discriminative than ITS at the species level. This is in contrast to the large ribosomal subunit, which showed poor species resolution when sequenced from a subset of the isolates used in this study. The results described in this paper indicate that COI sequencing and the dataset generated are a valuable addition to the currently available oomycete taxonomy resources, and that both COI, the default DNA barcode supported by GenBank, and ITS, the de facto barcode accepted by the oomycete and mycology community, are acceptable and complementary DNA barcodes to be used for identification of oomycetes.
Keywords: cytochrome c oxidase subunit I, DNA barcoding, internal transcribed spacer, oomycete, species identification
Introduction
Oomycetes are fungal-like organisms that are found in a wide range of environments and ecological niches. They are classified among the stramenopiles (=Straminipila), a lineage including brown algae and diatoms that has lost plastids and is very distant phylogenetically from the kingdom Eumycota, the true Fungi. Many oomycete species are pathogens of plants and animals. The devastating speed with which they are able to spread makes rapid detection and identification crucial to implementation of control strategies. Biocontrol of oomycetes is an active area of study, and there are examples of oomycete species that are used as biological control against other oomycetes (Jones & Deacon 1995; Picard et al. 2000), exemplifying the range of ecological functions between species.
Due to their wide variety of ecological roles, broad distribution and economic impact, proper identification is of great importance in oomycete studies. Identification of species can be a laborious and difficult task requiring time and expertise to cultivate the distinguishing morphological characters and compare them by microscopy. Also the decreasing number of experts able to identify oomycetes by morphological features is an important factor. Although matrix-based Lucid keys are being developed that will improve the speed of identification by morphology (Abad & Coffey 2008; Ristaino et al. 2008), DNA-based identification can be done quickly and easily by a nonspecialist, achieving accurate results in a fraction of the time if there is an adequate database of reference strains.
Currently the most common region of DNA being used for identification of oomycetes to the species level is the internal transcribed spacer (ITS) region of rDNA. The ITS region in oomycetes is easy to amplify for DNA sequencing in most species with the use of universal eukaryotic PCR (polymerase chain reaction) primers (White et al. 1990; Ristaino et al. 1998). Cooke et al. (2000) were the first to publish a database of ITS sequences that covered all the known and available species of an oomycete genus. ITS then became the de facto DNA barcode for identification of Phytophthora species and similar comprehensive databases for Pythium (Lévesque & de Cock 2004) and downy mildews (Voglmayr 2003) followed. However, due to the apparent lack of functional constraint on this untranslated region of rDNA, alignment of ITS sequences is hampered by large amounts of insertions and deletions, which can be an issue for accurate comparisons. Indels in the ITS can even be observed within a single strain due to differences in alleles or differences among the multiple copies of the ITS, making direct sequencing of PCR products impossible (Kageyama et al. 2007). In some species of downy mildews, excessive length due to long insertions can raise difficulties when sequencing the complete ITS region. There are also certain cases where the ITS sequences of formally described species are extremely similar, particularly when they are evolutionarily closely related such as Phytophthora infestans, Phytophthora phaseoli, Phytophthora ipomoeae, Phytophthora sp. ‘andina’ and Phytophthora mirabilis (Gomez-Alpizar et al. 2008) which are 99.9% similar in ITS sequence (Kroon et al. 2004). Due to these limitations of the ITS region for identification, the use of another region for this purpose may lend more clarity to the molecular depictions of oomycete taxonomy.
Cytochrome c oxidase subunit I (COI, COX1) is a mitochondrially encoded gene which is recognized as an extremely useful DNA barcode capable of accurate species identification in a very broad range of eukaryotic life forms (Hebert et al. 2004; Ward et al. 2005; Hajibabaei et al. 2006; Seifert et al. 2007). COI is the default DNA barcode approved by GenBank and the Consortium for the Barcode of Life (CBOL) and it must be proven ineffective as a DNA barcode to be rejected as such. COI has proven useful in phylogenetic studies of the oomycete genus Phytophthora (Martin & Tooley 2003; Kroon et al. 2004), and the success of COI barcoding in red algae (Saunders 2005) made it a very intriguing prospect for barcoding of all oomycetes due to their algal ancestry. Because COI is a protein-coding region, alignment of COI sequences is simple and devoid of gaps if introns are absent. With the use of primers that amplify the 5′ end of COI, accurate species delimitation has been achieved with sequences of only 650 base pairs (bp) or less (Meusnier et al. 2008). With the advent of massively parallel sequencing from environmental samples, it is important to compare COI and ITS as the marine and animal science communities appear to have a strong interest in COI, whereas ITS is the established species-level marker in the mycology community, although not formally approved as a DNA barcode yet. Here we report the utility of COI sequence data for accurate species delimitation in oomycetes, and compare COI identification to the benchmark of ITS identification with 1205 isolates representing 23 genera including the recently described genus Phytopythium (formerly Pythium Clade K) (Bala et al. 2010b). Nearly all the currently described species of the two largest genera that can be maintained in culture (Pythium and Phytophthora) have been included in this study. In addition to COI and ITS, the D1–D3 region of nuclear large subunit (LSU) rDNA, a commonly used marker for phylogeny and identification of oomycetes and Fungi, was sequenced from a subset of 388 isolates from 20 genera and is analysed in comparison with COI and ITS. The complete list of isolates used for this study is shown in Table S1 (Supporting information).
Materials and methods
The majority of isolates used for this study were processed by the primary methods summarized below. Additional methods that were used for a small proportion of isolates are described in Text S2 (Supporting information).
DNA extraction
Extraction methods varied depending on the source of the cultures. For cultures grown from the Centraalbureau voor Schimmelcultures (CBS), mycelia from 5 to 14 day old liquid cultures grown in pea broth (de Cock et al. 1992) were harvested by vacuum filtration, freeze dried, and DNA was extracted following the protocol of Möller et al. (1992). For cultures grown from the Canadian Collection of Fungal Cultures (CCFC), mycelia from 5 to 14 day old liquid cultures grown in potato dextrose broth (Difco) at room temperature were removed from broth and DNA was extracted following the protocol of Möller et al. with a modification to the tissue lysis step. Instead of grinding mycelia in liquid nitrogen, mycelia were placed in 2 mL screw cap tubes containing 300 mg of zirconium oxide spheres and one 6 mm zirconium oxide sphere (Fox Industries), along with TES buffer (100 mm Tris pH 8.0, 10 mm EDTA, 2% SDS) and proteinase K. Lysis was achieved by placing tubes in a FastPrep® machine (BIO 101) for 45 s at speed 4.0. Tubes were incubated at 65 °C for 1 h and subsequent steps were performed following the original protocol. At the final step, DNA pellet was resuspended in 0.1× TE buffer containing 20 μg/mL RNase A and tubes were incubated at 65 °C for 10 min.
DNA amplification
Sequencing templates were amplified from DNA extract using the universal eukaryotic primers UN-up18S42 (5′-CGTAACAAGGTTTCCGTAGGTGAAC-3′) (Bakkeren et al. 2000) and the new UN-lo28S1220 (5′-GTTGTTACACACTCCTTAGCGGAT-3′) (Bala et al. 2010a) for the combined ITS and LSU regions (Lévesque & de Cock 2004). In some cases the ITS region alone was amplified using UN-up18S42 and UN-lo28S22 (5′-GTTTCTTTTCCTCCGCTTATTGATATG-3′) (Lévesque & de Cock 2004). The oomycete-specific primers OomCoxI-Levup (5′-TCAWCWMGATGGCTTTTTTCAAC-3′) and Fm85mod (5′-RRHWACKTGACTDATRATACCAAA-3′), modified from Martin & Tooley (2003), were designed to amplify 727 bp from the 5′ end of COI mitochondrial DNA. In some cases, an alternative reverse primer, OomCoxI-Levlo (5′-CYTCHGGRTGWCCRAAAAACCAAA-3′), was used with OomCoxI-Levup, amplifying a slightly smaller 680 bp fragment of COI, perfectly overlapping the standard DNA barcode used in other groups. PCR reaction volume was 10 μL containing final concentrations of 1× Titanium Taq buffer (with 3.5 mm MgCl2), 0.1 mm dNTPs, 0.08 μm each of forward and reverse primer, 0.5× Titanium Taq polymerase, and ∼1–10 ng/μL of DNA. Reaction volume was brought up to 10 μL with sterile HPLC water. Thermocycler program for amplification of the ITS/LSU region was: 95 °C for 3 min followed by 40 cycles of 95 °C for 30 s, 68 °C for 45 s, 72 °C for 2 min. A final extension was made at 72 °C for 8 min. Program for ITS alone was identical to that for ITS/LSU, except for a shorter extension time of 90 s at 72 °C in each cycle. Program for amplification of the COI region was: 95 °C for 2 min followed by 35 cycles of 95 °C for 1 min, 55 °C for 1 min, 72 °C for 1 min. A final extension was made at 72 °C for 10 min.
Sequencing amplification
Amplification of PCR products for sequencing was done with ABI Big Dye Terminator version 3.1 in a reaction volume of 10 μL, with Big Dye Seq Mix diluted 1:8 with Seq buffer. Final concentrations of each reagent were 0.875× Sequencing buffer, 5% trehalose, 0.125× Big Dye Seq Mix and 0.16 μm primer. Reaction volume was brought to 10 μL with sterile HPLC water and 1 μL of PCR product was added directly from initial PCR amplification without purification. Thermocycler program for ITS/LSU was: 95 °C for 3 min followed by 40 cycles of 95 °C for 30 s, 58 °C for 40 s, 60 °C for 4 min. Program for COI was: 95 °C for 3 min followed by 40 cycles of 95 °C for 30 s, 50 °C for 20 s, 60 °C for 4 min. Sequencing primers for ITS were UN-up18S42 and UN-lo28S22. Sequencing primers for LSU were UN-up28S40 (5′-GCATATCAATAAGCGGAGGAAAAG-3′) (Schurko et al. 2003), UN-up28S577 (5′-CGTCTTGAAACACGGACCAAGGAG-3′) (Bala et al. 2010a), UN-lo28S576B (5′-CTCCTTGGTCCGTGTTTCAAGACG-3′) (Bakkeren et al. 2000) and UN-lo28S1220. Sequencing primers for COI were OomCoxI-Levup and Fm85mod or OomCoxI-Levlo.
Sequencing
DNA sequences were generated from sequencing amplification reactions using the ABI Prism 3130xl Genetic analyzer. DNA sequences have been deposited in the Barcode of Life Data Systems (BOLD) and GenBank. Accession numbers for both databases are found in Table S1 (Supporting information).
Sequence editing, alignment and cluster analysis
Sequence results were reviewed and edited using Seqman software (DNAStar) and alignments were made using muscle for COI and mafft for ITS and LSU (Edgar 2004; Katoh et al. 2005). mafft alignment of LSU was performed with the G-INS-i algorithm on the download Mac OS X version. mafft alignment of ITS was performed with the L-INS-i algorithm. The default maximum sequence allowance was raised from 1000 to 2000 by opening the mafft script in/usr/local/bin and changing line 762 from if [$nseq -gt 1000 -a $iterate -gt 1]; then to if [$nseq -gt 2000 -a $iterate -gt 1]; then. Alignments in fastA format were converted to nexus format with MacClade 4.06. Alignment of COI contained 680 characters, alignment of ITS contained 2068 characters, and alignment of LSU contained 1395 characters. No characters were excluded from analysis of any marker. Calculation of distance matrices and UPGMA hierarchical clustering was performed with paup 4.0b10. Bootstrap values were obtained from 1000 reps. Trees were formatted for Figs 2 and 3 using Dendroscope (Huson et al. 2007).
Fig. 2.
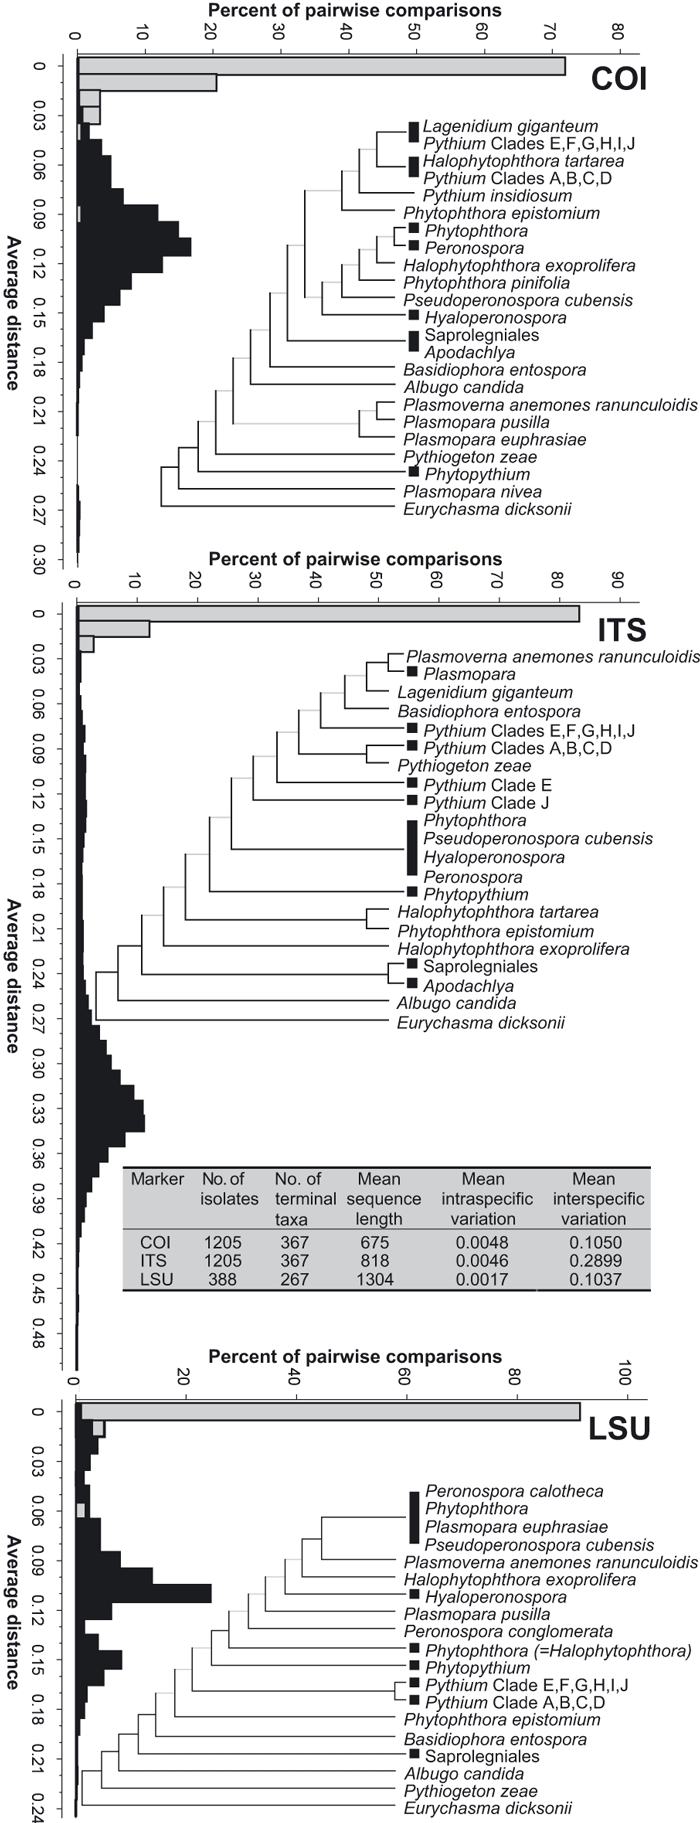
Phylograms and distance histograms for each marker. Black boxes at phylogram branch termini indicate multiple species. Branches with less than 50% bootstrap support are greyed out. Branch lengths are not to scale. Histograms display intraspecific variation in grey and interspecific variation in black. Inset table summarizes distance data.
Fig. 3.
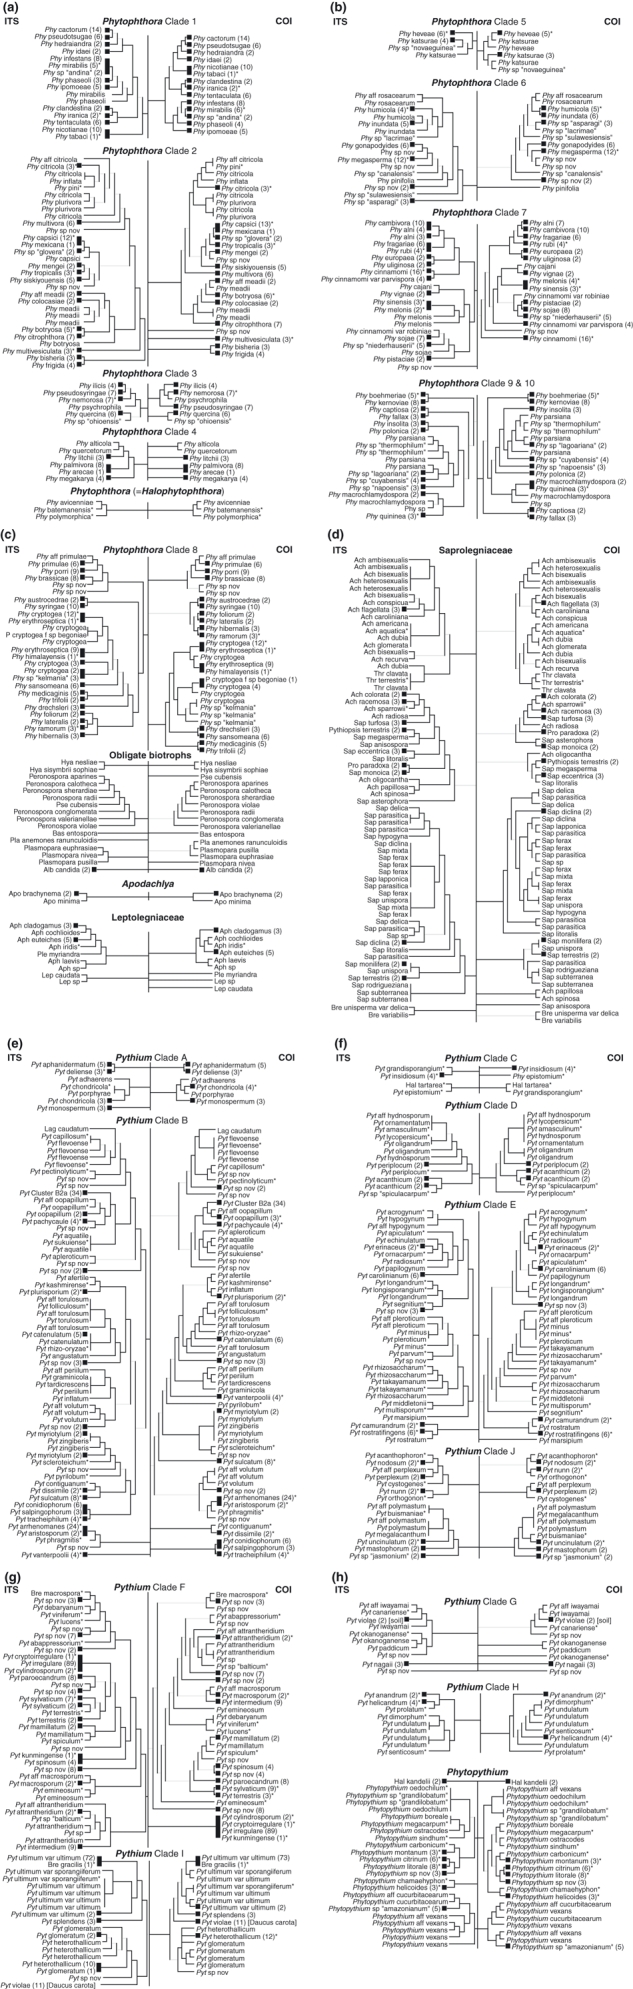
Direct comparison of ITS and COI phylograms by clade. ITS is shown on the left and COI on the right of an artificial vertical backbone. Black boxes at phylogram branch termini represent multiple isolates, with number of isolates shown in brackets. Asterisks denote ex-type specimen. Branches with less than 50% bootstrap support are greyed out. Branch lengths are not to scale. Most genus names are abbreviated to the first three letters. See Table S1 (Supporting information) for full names. (a) Phytophthora Clades 1, 2, 3, 4 and (=Halophytophthora). (b) Phytophthora Clades 5, 6, 7, 9 and 10. (c) Phytophthora Clade 8, Obligate biotrophs, Apodachlya and Leptolegniaceae. Note that grouping of all obligate biotroph isolates is superficial as they do not represent a coherent phylogenetic group. (d) Saprolegniaceae. (e) Pythium Clades A and B. (f) Pythium Clades C, D, E and J. (g) Pythium Clades F and I. (h) Pythium Clade G, H and Phytopythium.
Distance matrix statistical analysis
Uncorrected ‘p’ (percentage) based distance matrices were analysed using matrix algebra and SAS. The average intraspecific distance was calculated for each species represented by more than one strain and coded as missing data when only one strain could be obtained to avoid having a bias towards zero variation. For each pair of species, the average pairwise distance was calculated for all the possible strain comparisons. A lower triangular uncorrected distance matrix was created with paup with the strains shown in Table S1 (Supporting information). The square pairwise distance matrix [PD] was imported into SAS as well as a column for species name (we did not have the same species name found in two different genera) and a column for corresponding strain coding. A 0/1 ‘dummy’ species variable design matrix [SV] was created in SAS using the species name column. The total of the distances [TD] for each species and pairwise comparison was found with the following equation: [TD] = [SV]t × [PD] × [SV], where the diagonal was the number of pairwise comparisons for each species and the lower triangular matrix the total number of possible pairwise comparisons for each pair of species. A lower triangular matrix with a diagonal of 1’s [L1] was created with the same number of rows and columns as [PD]. The same equation as above was applied by replacing [PD] by [L1] to find the total number of pairwise distance comparisons [ND]. The average of all the pairwise comparisons was found by dividing [TD] by [ND], with the diagonal of the matrix giving the averages of all intraspecific comparisons and the lower matrix the averages of all interspecific comparisons. These values were used for distribution analyses.
Results
PCR primer performance
In an initial trial using the Phytophthora primers from Martin & Tooley (2003), consistent amplification of the COI barcode region was not achieved in a set of eight oomycete genera. However, the complete 5′ end and middle region of COI was sequenced with various combinations of their primers for Saprolegnia, Achlya and Pythium in addition to Phytophthora. Alignment of these sequences allowed design of new COI primers for the current study, OomCoxI-Levup and Fm85mod, which amplified a 727 bp fragment from the 5′ end of COI. For 18 isolates that did not amplify well with Fm85mod, an alternative reverse primer (OomCoxI-Levlo) was used. This amplified a smaller fragment of 680 bp compared to using Fm85mod (Fig. 1). Introns were not present in any COI sequence of the species studied. ITS fragments of varying length were used; from partial fragments as short as 402 bp from some Pythium isolates, up to 1351 bp from Eurychasma. In Basidiophora, Plasmopara and Plasmoverna, only the ITS1 region was sequenced due to long insertions in the ITS2 region. The LSU fragments ranged between 1246 and 1343 bp, although for three Saprolegnia isolates, partial fragments between 700 and 850 bp were used due to lack of high sequence quality for the entire D1–D3 region.
Fig. 1.
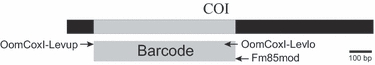
Diagram illustrating COI gene region, barcode segment of COI (grey) and COI PCR primer locations.
Sequence distances
For each marker, distance matrices were used to calculate intraspecific (within species) variation, as well as interspecific (between species) variation. A graphical representation of the data and a table summarizing the results for all markers is shown in Fig. 2. The mean intraspecific variation for COI, ITS and LSU was 0.0048, 0.0046 and 0.0017, respectively. The mean interspecific variation was 0.1050, 0.2899 and 0.1037, respectively.
Cluster analyses
Trees for each marker are shown in Fig. 2. Trees for COI and ITS contain 1205 sequences, including the basal oomycete Eurychasma dicksonii as the outgroup (Sekimoto et al. 2008). The LSU tree contains 388 sequences, including E. dicksonii as outgroup. Black squares at branch termini in Fig. 2 represent a collapsed subtree containing multiple species or in the case of the order Saprolegniales, multiple genera and species. Black rectangles at branch termini represent a clade of unresolved genera and indicate the presence of multiple species from the genera occupying the clade. Direct comparison between COI and ITS trees is shown in Fig. 3. Black squares at branch termini in Fig. 3 represent a collapsed subtree containing multiple isolates. Black rectangles at branch termini represent a clade of unresolved species and indicate the presence of multiple isolates from the species occupying the clade. Unresolved species with only single isolates are shown within clades represented by vertical lines at branch termini rather than rectangles. In Fig. 3, the genera Phytophthora and Pythium are divided and displayed by their previously established phylogenetic clades (Lévesque & de Cock 2004; Blair et al. 2008). Genera belonging to the families Saprolegniaceae and Leptolegniaceae are shown under the heading of their respective family. All obligate biotrophs are displayed together. Branch lengths in Figs 2 and 3 are not to scale, but full trees for each marker showing all isolates with scaled branch lengths and bootstrap values are given in Fig. S1 (Supporting information). For both COI and ITS, most isolates grouped into conspecific clusters, and the species composition of major clades did not differ between COI and ITS. Exceptions to this trend were Phytophthora katsurae, Phytopythium aff. vexans, Pythium kunmingense and Pythium okanoganense, which all appeared in different terminal nodes depending on the marker used. LSU sequences were more highly conserved and did not vary between some closely related species that were distinctly separate with COI and ITS. In some cases, two or more species shared identical or highly similar COI and ITS sequences, consistent across both markers, which invites further discussion of the possible synonymy of those species.
Discussion
The primary purpose of the current study was to compare a validated oomycete de facto DNA barcode (ITS) with the default barcode (COI) which is officially accepted as the DNA barcode for eukaryotic groups unless proven ineffective. Our results indicate that both ITS and COI can be valid and useful barcodes for accurate identification of many oomycetes, whereas LSU more often lacks sufficient resolution between species. The genera Pythium and Phytophthora were almost completely covered by this study, and several other genera representing a wide range of oomycetes, including some obligate biotrophs, were partially covered. Intraspecific variation of COI is at par with that of ITS, although ITS does provide greater interspecific variation than COI. The benefit of COI barcoding is the ease of sequencing and aligning a relatively short fragment which has uniform length and can be amplified with degenerate primers throughout the entire oomycete class. This advantage over ITS is especially evident in the downy mildew genera Basidiophora, Plasmopara, Plasmoverna and relatives, which contain insertions in the ITS2 resulting in ITS sequences often longer than 2 kb (Thines 2007), raising difficulties to amplify, sequence and align the complete ITS region. LSU had the lowest interspecific variation of the three markers (Fig. 2), and the use of LSU as an oomycete barcode does not always provide enough resolution for identification to the species level. LSU appears to be better suited for studying genus- and family-level relationships in oomycetes (Riethmüller et al. 1999, 2002; Petersen & Rosendahl 2000; Voglmayr & Riethmüller 2006). A large portion of LSU was used to provide sufficient variation but this precludes amplification and sequencing with a single pair of primers. Barcoding with COI on the other hand, can quickly and easily lend additional evidence to identifications and new species descriptions by complementing nuclear DNA sequencing (ITS) with a mitochondrial DNA sequence (Bala et al. 2010a). The speed and ease of ITS and COI sequencing is also enhanced by the method of PCR amplification used in this study, which employed a minimal concentration of primers, thereby eliminating the need for purification of PCR products before sequencing. This approach, which was carried out in small PCR reaction volumes (10 μL), was able to reduce time and cost while still delivering high quality results.
Universality of PCR primers is also an important requirement of DNA barcode-based identification. The primers used for oomycete COI amplification (OomCoxI-Levup and Fm85mod) were able to amplify DNA from the entire range of oomycete genera in this study, including the basal genus Eurychasma and genera from the obligate biotrophic white blister rusts (Albugo) and downy mildews (Basidiophora, Hyaloperonospora, Peronospora, Plasmopara, Plasmoverna and Pseudoperonospora). There were, however, a few exceptional species of Pythium and Phytopythium (Py. buismaniae, Py. contiguanum, Py. kashmirense, Py. ostracodes and Ph. cucurbitacearum) that did not amplify with Fm85mod, and were instead amplified and sequenced using the alternative reverse primer OomCoxI-Levlo. Standard use of OomCoxI-Levlo is not recommended though, because our alignment of Fm85mod-derived COI sequences revealed that the 3′ end of OomCoxI-Levlo is not conserved throughout all Pythium, Phytophthora and Aphanomyces species.
Proposition of COI as a complement to ITS for species delimitation is based on the observation that relationships among closely related species and organization of major clades in Pythium and Phytophthora are concordant with the results of previous multilocus molecular studies (Kroon et al. 2004; Lévesque & de Cock 2004; Blair et al. 2008). Almost every terminal node on the UPGMA tree was composed of the same isolate(s) regardless of the marker used for sequencing. Replicated DNA sequencing of the isolates that did not follow this trend (Phytophthora katsurae P3389, Phytopythium aff. vexans CBS 261.30, Pythium kunmingense CBS 550.88 and Pythium okanoganense CBS 315.81) was performed to rule out the possibility of a DNA mix up during COI sequencing. In attempting to explain these situations biologically, the possibility of hybridization exists as has been well documented in Phytophthora (Érsek & Nagy 2008) and recently discovered in Pythium (Nechwatal & Mendgen 2008), but evidence of hybridization based on dimorphism in nuclear DNA sequence chromatograms was not found for any isolate mentioned above. An alternative scenario involving horizontal transfer of mitochondrial DNA (mtDNA) is not implausible based on previous findings in filamentous fungi. Mobile mitochondrial plasmids are prominent in filamentous fungi and they are known to recombine with mtDNA (Griffiths 1996). The presence of mitochondrial plasmids has not been documented in oomycetes, although it is interesting to note that a mobile plasmid derived from an intron of COI exists in the ascomycete fungus Podospora anserina (Osiewacz & Esser 1984). Fusion of hyphae (anastomosis), as has been reported in Phytophthora (Stephenson et al. 1974), could be a rare natural event that enables horizontal transfer of mtDNA in oomycetes. Although the true nature of the aforementioned results is unknown, it is worth stating that the use of both ITS and COI rather than one or the other, is recommended for taxonomic identification of oomycetes.
Considering that new species descriptions are a demanding process involving detailed morphological study, the ability to predict candidacy for a new species description with additional DNA sequence data will be very valuable and time-saving, providing more confidence so as to avoid questionable or synonymous species descriptions. Several putative new species are present in the isolates used for this study, denoted by the species epithet ‘sp. nov.’.
The augmented species resolution that COI provides is evident for arguably the most economically important oomycete, Phytophthora infestans. This species, which causes late blight of potato and tomato, has an ITS sequence that is indistinguishable from the closely related species Phytophthora sp. ‘andina’ and Phytophthora mirabilis. COI on the other hand, separates these three species into individual terminal nodes. The same situation has been seen between the strawberry pathogen Phytophthora fragariae and the recently circumscribed raspberry pathogenic species Phytophthora rubi (Man in ‘t Veld 2007), originally classified as P. fragariae var. rubi. While the ITS sequences do not vary between these two species, a clear distinction exists between their COI sequences. A similar example of species resolution by COI in Pythium is between the marine algal pathogens P. chondricola and P. porphyrae. Other examples of species resolution by COI are listed in Text S1A (Supporting information). The initial recognition of individuality between these species can be credited to examination of morphological characters and confirmation of these species descriptions by COI sequencing acknowledges the accuracy of morphological observation.
Though the use of COI sequencing is able to reinforce some species boundaries, there are several cases where formally described species are indistinguishable with either ITS or COI. Cases of apparent conspecificity are listed in Text S1B (Supporting information). Our results also implicate the existence of species complexes where gene flow may be occurring between species. In some cases there are several described species included in a complex, or alternatively a single described species may display substantial intraspecific variation, thus suggesting that a complex of multiple species exists within the single described species. For example, there is a large species complex referred to here and in Fig. 3e as Pythium Cluster B2a which includes P. coloratum, P. diclinum, P. cf. dictyosporum, P. dissotocum, P. lutarium, P. sp. ‘Group F’ and P. sp. ‘tumidum’. Other examples of species complexes in Achlya, Phytophthora, Pythium, Phytopythium and Saprolegnia are listed in Text S1C (Supporting information). Such complicated taxonomic situations are inextricable with a single marker, and it is therefore important to have additional evidence from other markers such as COI for taxonomic identification of oomycetes.
The conclusion drawn from this study is that COI sequencing is a very useful addition to the oomycete molecular toolbox which can now be used for identification of many oomycete species using the reference data generated by this study. In some of the most difficult cases of species concept in Phytophthora and Pythium, COI provides better resolution and support for current taxonomy than ITS does. However, because both markers provide an acceptable resolution when used individually, because of the history of using ITS in mycology and for oomycetes, and because it is desirable to have the complement of mitochondrial and nuclear markers, we are proposing that ITS be added to COI as a DNA barcode for oomycetes in GenBank. For any oomycete species that is not included in this study or for any new species to be described, both markers should be sequenced and deposited as barcodes.
Acknowledgments
We would like to acknowledge valuable technical support from the following people: Katzutaka Katoh for advice on MAFFT script adjustment; Ans de Cock for DNA isolations; Rafik Assabgui for DNA sequencing service at Agriculture and Agri-Food Canada; Kelly Babcock, Modra Kaufert and Caitlin O'Reilly for providing cultures from CCFC; Gary Saunders for sharing red algal COI primer GazF1 before publication; Avneet Brar, Linda Chung and Elaine Xu at UC Riverside for technical assistance. This research was supported through funding to the Canadian Barcode of Life Network from Genome Canada (through the Ontario Genomics Institute), NSERC and other sponsors listed at http://www.bolnet.ca. The World Oomycete Genetic Resource Collection (formerly World Phytophthora Genetic Resource Collection) at UC Riverside was supported in part by grants from the USDA-NRI Plant Biosecurity program (2005-35605-15393 and 2008-55605-18773). Additional financial support came from the Austrian Science Fund (FWF) and the Dutch Ministry of Agriculture, Nature and Food Quality through the FES program for Plant Health.
Data Accessibility
UPGMA trees are accessible in TreeBASE study S11552. Refer to Table S1 (Supporting information) for DNA sequence data accessibility.
Supporting Information
Additional supporting information may be found in the online version of this article.
Table S1 Complete list of isolates used and accession numbers for their DNA sequences.
Fig. S1 Full UPGMA trees for each marker showing all isolates with scaled branch lengths and bootstrap values. The COI tree spans pages 1–10, the internal transcribed spacer tree spans pages 11–20 and the LSU tree spans pages 21–23.
Please note: Wiley-Blackwell are not responsible for the content or functionality of any supporting information supplied by the authors. Any queries (other than missing material) should be directed to the corresponding author for the article.
References
- Abad ZG, Coffey MD. 3rd International Phytophthora, Pythium and Related Genera Workshop. Turin, Italy: 9th International Congress of Plant Pathology; 2008. Development of a morphological/phylogenetic lucid key for the identification of Oomycetes: Phytophthora. [Google Scholar]
- Bakkeren G, Kronstad JW, Lévesque CA. Comparison of AFLP fingerprints and ITS sequences as phylogenetic markers in Ustilaginomycetes. Mycologia. 2000;92:510–521. [Google Scholar]
- Bala K, Robideau GP, Désaulniers N, de Cock AWAM, Lévesque CA. Taxonomy, DNA barcoding and phylogeny of three new species of Pythium from Canada. Persoonia. 2010a;25:22–31. doi: 10.3767/003158510X524754. [DOI] [PMC free article] [PubMed] [Google Scholar]
- Bala K, Robideau GP, Lévesque CA, et al. Phytopythium Abad, de Cock, Bala, Robideau, Lodhi & Lévesque, gen. nov. and Phytopythium sindhum Lodhi, Shahzad & Lévesque, sp. nov. Persoonia. 2010b;24:136–137. [Google Scholar]
- Blair JE, Coffey MD, Park SY, Geiser DM, Kang S. A multi-locus phylogeny for Phytophthora utilizing markers derived from complete genome sequences. Fungal Genetics and Biology. 2008;45:266–277. doi: 10.1016/j.fgb.2007.10.010. [DOI] [PubMed] [Google Scholar]
- de Cock AWAM, Neuvel A, Bahnweg G, de Cock JCJM, Prell HH. A comparison of morphology, pathogenicity and restriction fragment patterns of mitochondrial DNA among isolates of Phytophthora porri Foister. Netherlands Journal of Plant Pathology. 1992;98:277–289. [Google Scholar]
- Cooke DEL, Drenth A, Duncan JM, Wagels G, Brasier CM. A molecular phylogeny of Phytophthora and related oomycetes. Fungal Genetics and Biology. 2000;30:17–32. doi: 10.1006/fgbi.2000.1202. [DOI] [PubMed] [Google Scholar]
- Edgar RC. MUSCLE: multiple sequence alignment with high accuracy and high throughput. Nucleic Acids Research. 2004;32:1792–1797. doi: 10.1093/nar/gkh340. [DOI] [PMC free article] [PubMed] [Google Scholar]
- Érsek T, Nagy ZÁ. Species hybrids in the genus Phytophthora with emphasis on the alder pathogen Phytophthora alni: a review. European Journal of Plant Pathology. 2008;122:31–39. [Google Scholar]
- Gomez-Alpizar L, Hu CH, Oliva R, Forbes G, Ristaino JB. Phylogenetic relationships of Phytophthora andina, a new species from the highlands of Ecuador that is closely related to the Irish potato famine pathogen Phytophthora infestans. Mycologia. 2008;100:590–602. doi: 10.3852/07-074r1. [DOI] [PubMed] [Google Scholar]
- Griffiths AJF. Mitochondrial inheritance in filamentous fungi. Journal of Genetics. 1996;75:403–414. [Google Scholar]
- Hajibabaei M, Janzen DH, Burns JM, Hallwachs W, Hebert PD. DNA barcodes distinguish species of tropical Lepidoptera. Proceedings of the National Academy of Sciences, USA. 2006;103:968–971. doi: 10.1073/pnas.0510466103. [DOI] [PMC free article] [PubMed] [Google Scholar]
- Hebert PD, Stoeckle MY, Zemlak TS, Francis CM. Identification of birds through DNA barcodes. PLoS Biology. 2004;2:e312. doi: 10.1371/journal.pbio.0020312. [DOI] [PMC free article] [PubMed] [Google Scholar]
- Huson DH, Richter DC, Rausch C, et al. Dendroscope: an interactive viewer for large phylogenetic trees. BMC Bioinformatics. 2007;8:460. doi: 10.1186/1471-2105-8-460. [DOI] [PMC free article] [PubMed] [Google Scholar]
- Jones EE, Deacon JW. Comparative physiology and behaviour of the mycoparasites Pythium acanthophoron, P. oligandrum and P. mycoparasiticum. Biocontrol Science and Technology. 1995;5:27–39. [Google Scholar]
- Kageyama K, Senda M, Asano T, Suga H, Ishiguro K. Intra-isolate heterogeneity of the ITS region of rDNA in Pythium helicoides. Mycological Research. 2007;111:416–423. doi: 10.1016/j.mycres.2007.01.019. [DOI] [PubMed] [Google Scholar]
- Katoh K, Kuma K, Toh H, Miyata T. MAFFT version 5: improvement in accuracy of multiple sequence alignment. Nucleic Acids Research. 2005;33:511–518. doi: 10.1093/nar/gki198. [DOI] [PMC free article] [PubMed] [Google Scholar]
- Kroon LP, Bakker FT, van den Bosch GB, Bonants PJ, Flier WG. Phylogenetic analysis of Phytophthora species based on mitochondrial and nuclear DNA sequences. Fungal Genetics and Biology. 2004;41:766–782. doi: 10.1016/j.fgb.2004.03.007. [DOI] [PubMed] [Google Scholar]
- Lévesque CA, de Cock AWAM. Molecular phylogeny and taxonomy of the genus Pythium. Mycological Research. 2004;108:1363–1383. doi: 10.1017/s0953756204001431. [DOI] [PubMed] [Google Scholar]
- Man in ‘t Veld WA. Gene flow analysis demonstrates that Phytophthora fragariae var. rubi constitutes a distinct species, Phytophthora rubi comb. nov. Mycologia. 2007;99:222–226. doi: 10.3852/mycologia.99.2.222. [DOI] [PubMed] [Google Scholar]
- Martin FN, Tooley PW. Phylogenetic relationships among Phytophthora species inferred from sequence analysis of mitochondrially encoded cytochrome oxidase I and II genes. Mycologia. 2003;95:269–284. [PubMed] [Google Scholar]
- Meusnier I, Singer GA, Landry JF, et al. A universal DNA mini-barcode for biodiversity analysis. BMC Genomics. 2008;9:214. doi: 10.1186/1471-2164-9-214. [DOI] [PMC free article] [PubMed] [Google Scholar]
- Möller EM, Bahnweg G, Sandermann H, Geiger HH. A simple and efficient protocol for isolation of high molecular weight DNA from filamentous fungi, fruit bodies and infected plant tissues. Nucleic Acids Research. 1992;20:6115–6116. doi: 10.1093/nar/20.22.6115. [DOI] [PMC free article] [PubMed] [Google Scholar]
- Nechwatal J, Mendgen K. Evidence for the occurrence of natural hybridization in reed-associated Pythium species. Plant Pathology. 2008;58:261–270. [Google Scholar]
- Osiewacz HD, Esser K. The mitochondrial plasmid of Podospora anserina: a mobile intron of a mitochondrial gene. Current Genetics. 1984;8:299–305. doi: 10.1007/BF00419728. [DOI] [PubMed] [Google Scholar]
- Petersen AB, Rosendahl S. Phylogeny of the Peronosporomycetes (oomycota) based on partial sequences of the large ribosomal subunit (LSU rDNA) Mycological Research. 2000;104:1295–1303. [Google Scholar]
- Picard K, Tirilly Y, Benhamou N. Cytological effects of cellulases in the parasitism of Phytophthora parasitica by Pythium oligandrum. Applied and Environmental Microbiology. 2000;66:4305–4314. doi: 10.1128/aem.66.10.4305-4314.2000. [DOI] [PMC free article] [PubMed] [Google Scholar]
- Riethmüller A, Weiß M, Oberwinkler F. Phylogenetic studies of Saprolegniomycetidae and related groups based on nuclear large subunit ribosomal DNA sequences. Canadian Journal of Botany. 1999;77:1790–1800. [Google Scholar]
- Riethmüller A, Voglmayr H, Goker M, Weiß M, Oberwinkler F. Phylogenetic relationships of the downy mildews (Peronosporales) and related groups based on nuclear large subunit ribosomal DNA sequences. Mycologia. 2002;94:834–849. doi: 10.1080/15572536.2003.11833177. [DOI] [PubMed] [Google Scholar]
- Ristaino JB, Madritch M, Trout CL, Parra G. PCR amplification of ribosomal DNA for species identification in the plant pathogen genus Phytophthora. Applied and Environmental Microbiology. 1998;64:948–954. doi: 10.1128/aem.64.3.948-954.1998. [DOI] [PMC free article] [PubMed] [Google Scholar]
- Ristaino JB, Haege MJ, Hu CH. Journal of Plant Pathology. Turin, Italy: 2008. Development of a Phytophthora lucid key. 9th International Congress of Plant Pathology. [Google Scholar]
- Saunders GW. Applying DNA barcoding to red macroalgae: a preliminary appraisal holds promise for future applications. Philosophical Transactions of the Royal Society of London B: Biological Sciences. 2005;360:1879–1888. doi: 10.1098/rstb.2005.1719. [DOI] [PMC free article] [PubMed] [Google Scholar]
- Schurko AM, Mendoza L, Lévesque CA, et al. A molecular phylogeny of Pythium insidiosum. Mycological Research. 2003;107:537–544. doi: 10.1017/s0953756203007718. [DOI] [PubMed] [Google Scholar]
- Seifert KA, Samson RA, Dewaard JR, et al. Prospects for fungus identification using CO1 DNA barcodes, with Penicillium as a test case. Proceedings of the National Academy of Sciences, USA. 2007;104:3901–3906. doi: 10.1073/pnas.0611691104. [DOI] [PMC free article] [PubMed] [Google Scholar]
- Sekimoto S, Beakes GW, Gachon CM, et al. The development, ultrastructural cytology, and molecular phylogeny of the basal oomycete Eurychasma dicksonii, infecting the filamentous phaeophyte algae Ectocarpus siliculosus and Pylaiella littoralis. Protist. 2008;159:299–318. doi: 10.1016/j.protis.2007.11.004. [DOI] [PubMed] [Google Scholar]
- Stephenson LW, Erwin DC, Leary JV. Hyphal anastomosis in Phytophthora capsici. Phytopathology. 1974;64:149–150. [Google Scholar]
- Thines M. Characterisation and phylogeny of repeated elements giving rise to exceptional length of ITS2 in several downy mildew genera (Peronosporaceae) Fungal Genetics and Biology. 2007;44:199–207. doi: 10.1016/j.fgb.2006.08.002. [DOI] [PubMed] [Google Scholar]
- Voglmayr H. Phylogenetic relationships of Peronospora and related genera based on nuclear ribosomal ITS sequences. Mycological Research. 2003;107:1132–1142. doi: 10.1017/s0953756203008438. [DOI] [PubMed] [Google Scholar]
- Voglmayr H, Riethmüller A. Phylogenetic relationships of Albugo species (white blister rusts) based on LSU rDNA sequence and oospore data. Mycological Research. 2006;110:75–85. doi: 10.1016/j.mycres.2005.09.013. [DOI] [PubMed] [Google Scholar]
- Ward RD, Zemlak TS, Innes BH, Last PR, Hebert PD. DNA barcoding Australia's fish species. Philosophical Transactions of the Royal Society of London B: Biological Sciences. 2005;360:1847–1857. doi: 10.1098/rstb.2005.1716. [DOI] [PMC free article] [PubMed] [Google Scholar]
- White TJ, Bruns T, Lee S, Taylor J. Amplification and direct sequencing of fungal ribosomal RNA genes for phylogenetics. In: Innis MA, Gelfand DH, Sninsky JJ, White TJ, editors. PCR Protocols: A Guide to Methods and Applications. San Diego: Academic Press; 1990. pp. 315–322. [Google Scholar]
Associated Data
This section collects any data citations, data availability statements, or supplementary materials included in this article.
Supplementary Materials
Data Availability Statement
UPGMA trees are accessible in TreeBASE study S11552. Refer to Table S1 (Supporting information) for DNA sequence data accessibility.