Abstract
Purpose: To demonstrate the feasibility of Tetrahedron Beam Computed Tomography (TBCT) using a carbon nanotube (CNT) multiple pixel field emission x-ray (MPFEX) tube.
Methods: A multiple pixel x-ray source facilitates the creation of novel x-ray imaging modalities. In a previous publication, the authors proposed a Tetrahedron Beam Computed Tomography (TBCT) imaging system which comprises a linear source array and a linear detector array that are orthogonal to each other. TBCT is expected to reduce scatter compared with Cone Beam Computed Tomography (CBCT) and to have better detector performance. Therefore, it may produce improved image quality for image guided radiotherapy. In this study, a TBCT benchtop system has been developed with an MPFEX tube. The tube has 75 CNT cold cathodes, which generate 75 x-ray focal spots on an elongated anode, and has 4 mm pixel spacing. An in-house-developed, 5-row CT detector array using silicon photodiodes and CdWO4 scintillators was employed in the system. Hardware and software were developed for tube control and detector data acquisition. The raw data were preprocessed for beam hardening and detector response linearity and were reconstructed with an FDK-based image reconstruction algorithm.
Results: The focal spots were measured at about 1 × 2 mm2 using a star phantom. Each cathode generates around 3 mA cathode current with 2190 V gate voltage. The benchtop system is able to perform TBCT scans with a prolonged scanning time. Images of a commercial CT phantom were successfully acquired.
Conclusions: A prototype system was developed, and preliminary phantom images were successfully acquired. MPFEX is a promising x-ray source for TBCT. Further improvement of tube output is needed in order for it to be used in clinical TBCT systems.
Keywords: CBCT, tetrahedron beam computed tomography, IGRT, multiple pixel field emission x-ray
INTRODUCTION
Cone beam computed tomography (CBCT) has been widely employed in image guided radiotherapy (IGRT) and intervention.1, 2 CBCT usually comprises a point x-ray source and a 2D flat panel imager (FPI). The quality of CBCT images is inferior to that of diagnostic fan-beam CT images. Excessive scatter photons and inferior detector performance are two primary contributors to the degradation of image quality.3, 4, 5, 6 In our previous publication,7 we proposed a novel Tetrahedron Beam Computed Tomography (TBCT) system, which is capable of reconstructing a volumetric CT image from data collected during a single gantry rotation. The TBCT system comprises a linear scan x-ray source array and a linear detector array that are perpendicular to each other. The x-ray beam from each source is collimated into a narrow fan-beam, and all the collimated beams converge onto a linear detector array. During the scan, fan beams rapidly scan in the z-direction (perpendicular to the gantry rotation plane), while the gantry slowly rotates around the patient. The volume imaged by each tube scan is shaped like a tetrahedron instead of a cone. Due to the fan beam geometry, scattered photons are mostly rejected.
The key component of the TBCT system is the linear scan x-ray tube. A scanning x-ray beam can be realized by steering an electron beam with an electromagnetic field. The scanning beam digital x-ray (SBDX) system8 uses a tube that is capable of generating 2-D raster scanning x-ray beams by this method. It functions similarly to a cathode ray tube (CRT) display, where the tube’s target is analogous to the CRT display screen. The electron beam is steered by the electromagnetic field in order to generate x-ray beams at different locations on the target. Inverse CBCT has been developed9 based on the SBDX technique. Another method to scan the x-ray beam is to build multiple cathodes into a single tube. Each cathode generates a focal spot on the tube’s single anode. A scanning x-ray beam can be achieved by activating the cathodes in sequence. The multiple pixel field emission x-ray (MPFEX) tube has been developed based on carbon nanotube (CNT) field emission technology.10 Traditional x-ray tubes use thermionic cathodes which are heated above 1000 °C during operation. Field emission cathodes, which are often called “cold” cathodes, emit electrons due to the high electric field on the sharp tips of CNTs. Without heaters, field emission cathodes can be easily made into a compact array. MPFEX has been used in a few imaging applications.11, 12, 13 We have developed a TBCT benchtop system using an MPFEX tube. In this note, we report our initial experience and results from the MPFEX tube and TBCT system.
METHOD AND MATERIALS
Carbon nanotube (CNT) based multiple pixel field emission x-ray tube (MPFEX)
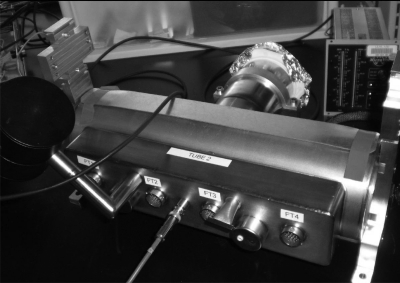
As mentioned above, the linear scan x-ray tube is the key component of the TBCT system. An MPFEX tube is employed in our TBCT benchtop system. This tube is one of the first prototypes made by XinRay Systems (Research Triangle Parks, NC). Figure 1 shows a picture of the MPFEX tube. Although very high CNT field emission current density has been reported,14 this particular tube was designed to produce only a few mA.The tube comprises 75 CNT field emission cathodes, each with an emission area of 1 × 20 mm2. The cathodes are aligned in a linear pattern with 4 mm spacing. The anode is made of tungsten alloy with a 20° anode angle. The x-ray window is made of 2 mm aluminum. Two small ion pumps are used to maintain a vacuum level under 5 × 10⁻⁷ Torr. A common (shared) gun gate grid is placed about 0.2 mm away from the cathodes. The gate grid is connected to a configurable high voltage power supply which provides up to 2500 V gate voltage. The cathodes are connected to high voltage cables through multiple pin vacuum feedthroughs. A 3 kW positive polarity unipolar x-ray generator (XRV, Spellman High Voltage Electronics Corporation, Hauppauge, NY) is used to provide up to 160 kV anode voltage via a standard R24 high voltage receptacle on the tube.
Figure 1.
A multiple pixel field emission x-ray (MPFEX) tube manufactured by Xinray Systems, LLC (Research Triangle Parks, NC). It comprises 75 carbon nanotube (CNT) cathodes to form 75 focal spots in 4 mm spacing.
Tube controller
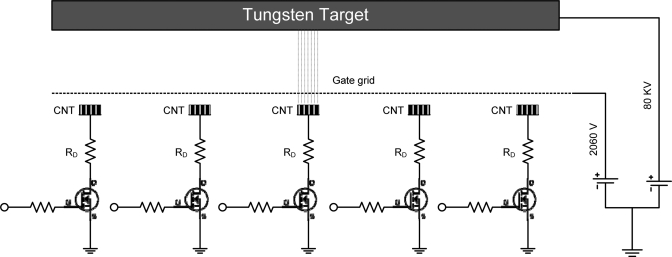
Beam activation is controlled by switching each cathode to either a ground or floating state. When a cathode is connected to ground, the gate voltage (1500–2200 V) is applied between the gate and CNTs. The CNTs then emit electrons due to the strong electric field. On the other hand, when the cathode is in the floating state (high resistance to ground), the potential of the cathode is close to that of the gate. No field emission electron will then be emitted from the CNTs. We used high voltage MOSFETs to switch the cathode potential states. Figure 2 shows the diagram of the control electronics. These MOSFETs have a very high drain-source breakdown voltage Vdss. To accommodate the different emission currents among different cathodes, the drain resistor RD for each channel was adjusted to allow the cathode currents to remain approximately uniform at around 3 mA with 2190 V gate voltage. An FPGA board controlled by a computer is used to activate the cathodes in a programmed sequence.
Figure 2.
Diagram of the MPFEX tube controller that we developed for the TBCT benchtop system. Only 5 out of 75 channels are shown.
CT detector
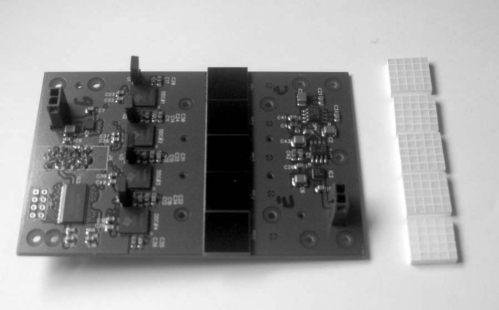
A 5-row CT detector array was developed using silicon photodiodes (S10368, Hamamatsu Photonics, Hamamatsu City, Japan) and CdWO4 scintillators (Saint Gobain Crystals, Hiram, Ohio, USA). The detector array consists of 11 detector boards, and each board includes five 5 × 5 photodiode arrays and matching scintillator arrays. Figure 3 shows one of the detector boards. The photodiode pixel size is 2.54 × 2.54 mm2. Four 32-channel current input 20-bit analog-to-digital converters (ADC) (DDC232 Texas Instruments, Dallas, TX) are employed on each board to integrate and digitize photodiode currents. The detector has a maximum sampling rate of 6 kHz and 20 bit digitization resolution. Detector boards are controlled by an FPGA board, which is connected to a computer via USB port. X-ray pulses and data acquisition are synchronized with another FPGA board. The data from each exposure are stored in the onboard memory of the FPGA board and then transferred to a computer via a high speed USB port.
Figure 3.
One of the 11 detector boards used in our TBCT benchtop system. The five 5 × 5 photodiode arrays can be seen in the middle of the board. The five matching CdWO4 scintillator arrays are also shown in the picture.
Multislot collimator
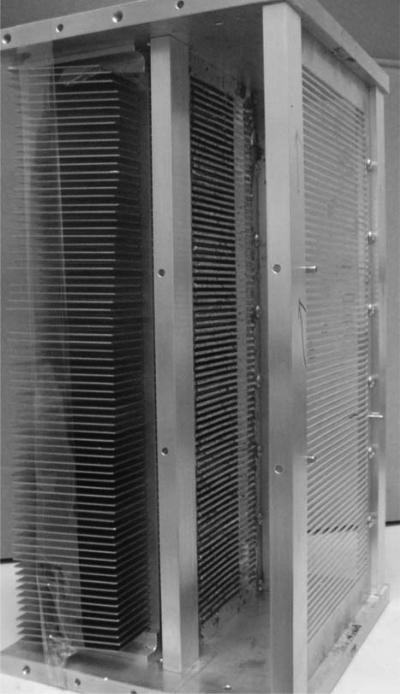
A multislot collimator is used to collimate the shape of each x-ray beam to match the profile of the curved detector in the beam’s-eye-view (BEV) direction. The collimator needs to be deep enough to separate the beams and to avoid the crosstalk between different sources. A picture of the multislot collimator is shown in Fig. 4. The collimator consists of two distinct components. The first component is a stack of brass plates arranged at different angles. These brass plates separate the beams and eliminate the x-ray crosstalk. The second component comprises 2 brass plates, each with 75 precisely machined slots. The slots define the shapes of the fan beams according to the shape of the curved detector in BEV.
Figure 4.
Multislot collimator of the TBCT benchtop. It comprises a stack of brass plates aligned at different angles and two plates with 75 precisely machined slot openings.
TBCT benchtop setup
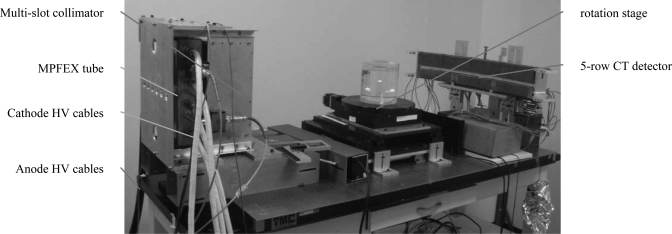
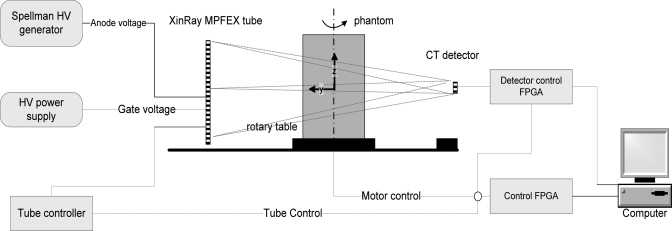
Figure 5 shows a picture of the whole benchtop system. The MPFEX tube is placed vertically, and the detector assembly is placed horizontally. The distances from the phantom rotation center to the central emitter of the tube and to the center of the detector array are 82.5 cm and 62.5 cm, respectively. Figure 6 shows the electronics connection diagram of the system.
Figure 5.
TBCT benchtop system which comprises a 75 pixel MPFEX tube, a multislot collimator, a 5 row CT detector and a rotation stage. High voltage power supplies for anode and gate voltages are not shown in the picture.
Figure 6.
Connection diagram of the TBCT benchtop system.
System alignment
The positions of x-ray tube, multislot collimator, rotary stage, and detector array were carefully aligned using the following procedure:
-
(1)
Level the optical breadboard on the table and the rotation stage to within 0.2° in every direction.
-
(2)
Position the tube and detector. The centers of the x-ray window and of the detector array were 309 mm above the table. A laser was used to align the tube window, rotation stage, and detector centers.
-
(3)
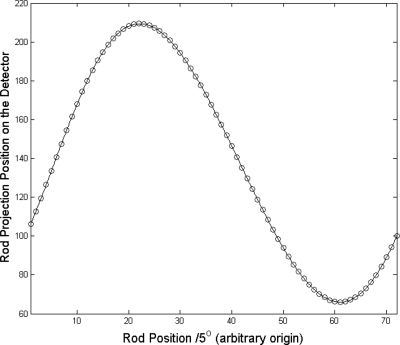
Verify the positioning of the detector and tube. A steel rod was placed on the rotation table vertically about 100 mm away from the rotation center. Images of the rod were taken every 5° giving a total of 72 positions. The projection positions of the rod at the detector were determined with subpixel precision by fitting the image intensity profiles of the rod to a Gaussian function along the horizontal direction. The positions of the 72 projections were then fitted to a curve predicted by the geometry of the system. Figure 7 shows the matching between the predicted curve and the actual measurements.
-
(4)
Verify that the central emitter of the x-ray tube and the central row of the detector form a plane parallel to the rotation plane of the rotation table. A 2 mm ball bearing (BB) was placed on the rotation table 309 mm above the table and 150 cm from rotational center. Two images were taken with the central emitter (#38) near the plane formed by the x-ray emitters and the center pixel of the detector at the two ends of the diameter. The projected positions of the BB at both positions were at the central row of the detector.
-
(5)
Align the collimator. The collimator was installed closely against the x-ray tube window. Its tilt along the detector direction was adjusted to within 0.1°. Then the x-ray images of all emitters were visually inspected. The collimator was adjusted to make sure that all fan beams were collimated onto the central row of the detector.
Figure 7.
Verification of system geometry alignment by a steel rod placed on the rotation stage. Circles: the measured rod positions; Solid line: a curve predicted by the geometry of the system.
Measurements
-
(a)
Focal spot measurement: A commercial star pattern with 2° spoke divergence angle (Model 07-510, Fluke Biomedical, Cleveland, Ohio) was used to measure the focal spot sizes. The pattern was imaged with radiographic films.
-
(b)
Half value layer (HVL) measurement: The HVL of aluminum was measured with an aluminum block wedge with 11 sections of different thicknesses. Images were acquired at the two ends and the middle section of the linear detector. During measurement, the wedge was placed directly in front of the detector.
-
(c)
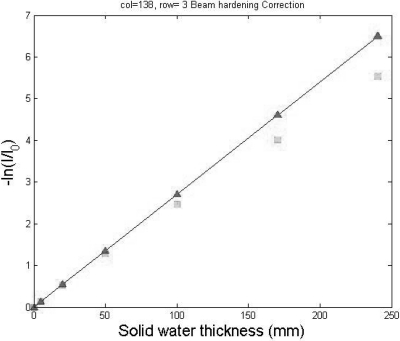
Beam hardening correction measurement: We measured the detector reading for the same x-ray beam that passed through different solid water slabs with known thicknesses (5, 20, 50, 100, 170, and 240 mm). We then fitted the measured data with a polynomial function for each pixel. The parameters of the polynomial functions were stored for the beam hardening correction.
-
(d)
Background and air scans measurements: Detector background was measured 4000 times before each scan. Air scans were measured 100 times both before and after the CT scan for each emitter. The integration time for each measurement was 80 ms (total 320 s for background and 8 s for each emitter in an air scan), which is the same as that of the CT scan. There was always some decrease in x-ray intensity during the scans. To compensate for the x-ray intensity variation, the readings of the pixels at the two ends of the detector array were used to normalize the measurements. These pixels were chosen because they received unattenuated radiation from the emitters.
Phantom scan
A standard CT phantom (Catphan 600, Phantom Laboratory, Salem, NY) was used for the TBCT scans. In order to protect the tube and avoid any potential damage, we ran the tube with very low power and duty cycle settings. The scanning was performed using 80 kVp and 2000 V gate voltage which resulted in the tube producing about 1.0 mA anode current. Each pulse width was 80 ms during CT scanning and a full tube scan from emitter # 1 to 75 took about 20 s. The TBCT scan was in step-and-shoot mode. The phantom rotated 1° after each tube scan. A total of 360 projections/tube scans were acquired in a complete TBCT scan. The total mAs of each scan was about 29 mAs. As the width of the detector array (12.7 mm) is larger than the source pixel spacing (4 mm), the total equivalent mAs of each scan was about 92 mAs. The images were reconstructed with a modified FDK algorithm that was described in a previous publication7.
RESULTS
Figure 8 shows a focal spot measurement for cathode #51 with a star pattern tool. The measurement yielded a focal spot size of 0.9 × 2.2 mm2. Measurements of other focal spots yielded similar results. The larger focal spot dimension along the tube length direction is as expected since no focusing exists in this direction.
Figure 8.
Image of the star pattern for measuring focal spot size of cathode #51. The measurement yields a focal spot size of 0.9 × 2.2 mm2 with magnification factor of 3.
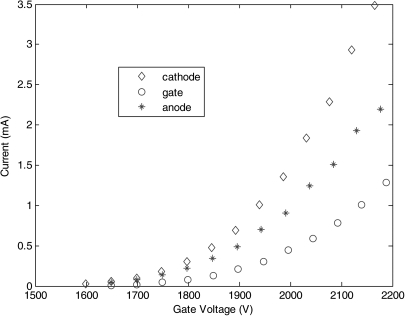
The field emission current is determined by the gate voltage. Figure 9 shows cathode and gate currents changing with gate voltage on one cathode (#75). The anode current is simply the difference between cathode and gate currents. Again, we did not test its maximum output capacity in order to avoid catastrophic damage to the tube.
Figure 9.
Cathode, gate, and anode currents for different gate voltages. With 2160 V gate voltage, this particular source produces around 3 mA cathode and 2 mA anode currents. The gate grid transmission rate is about 67%.
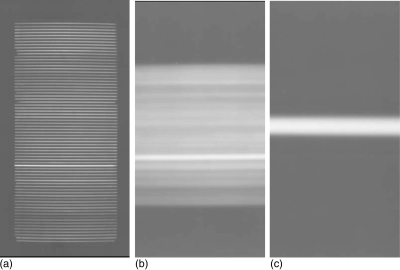
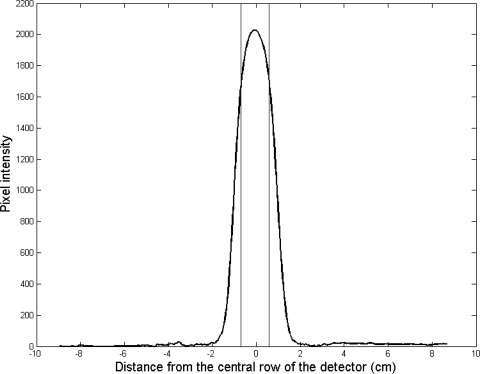
A multislot collimator is used to collimate x-ray beams to the detectors. In order to verify the beam collimation, we placed radiological films at three different locations: one behind the collimator, one near the center of the rotation stage, and one in front of the detector. The gate and anode voltages were set at 2000 V and 80 kV, respectively. Figure 10 shows the images with all sources activated. The image taken right behind the multislot collimator shows both the pattern of slots and the relative intensities of the x-ray beams. Even with the adjustment of MOSFET drain resistors, the intensities of the beams still vary significantly after a period of usage. This does not pose a problem in CT imaging since the measurements are normalized by a reference air scan. A large focal spot in the source-array direction (∼2 mm) generates a large penumbra. This is shown in Fig. 10c, which was taken right in front of the detector. We averaged the intensity of Fig. 10c along the horizontal direction and obtained a line profile, which is shown in Fig. 11. From this line profile, assuming the film responds to the incoming radiation linearly with low x-ray intensity, we measured that the beam FWHM width was 1.9 cm, and about 64% of the radiation was collimated onto the 1.27 cm wide detector. The efficiency of x-ray utilization can be improved by using a wider detector and/or a tube with reduced focal spot size in the source-array direction.
Figure 10.
Radiographic images taken at three locations when all the 75 emitters were activated. (a) Right behind the collimator; (b) near the center of rotation stage; and (c) right in front of the detector.
Figure 11.
Horizontal average profile of Fig. 10c. The edges of the detector (1.27 cm wide) are denoted by the two vertical lines. By numerical integration, we found that about 64% of the radiation was collimated onto the detector.
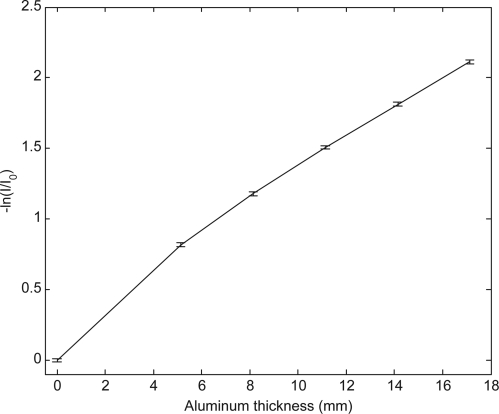
Figure 12 shows the HVL measurement at the middle section. A polynomial fitting to –ln(I/I0) yielded the HVL of 4.3 mm Al. The other two measurements near the two ends of the detector yielded similar results.
Figure 12.
Half value layer measurement at the middle section. The measured transmission values, -ln(I/I0) were fitted to a polynomial. Measurements were done at 80 kV anode voltage and 2060 V gate voltage. This measurement yields an HVL value of 4.3 mm Al.
We also performed beam-hardening measurements using solidwater slabs with different thicknesses. Figure 13 shows the result of these measurements. We fitted the measured data to a polynomial function in order to correct raw projection data before image reconstruction.
Figure 13.
Beam hardening correction for detector pixel (138, 3). The measured transmission values, -ln(I/I0), in squares were fitted to a polynomial and then were brought to values in a straight line (triangles). These corrected values are used to correct raw projection data.
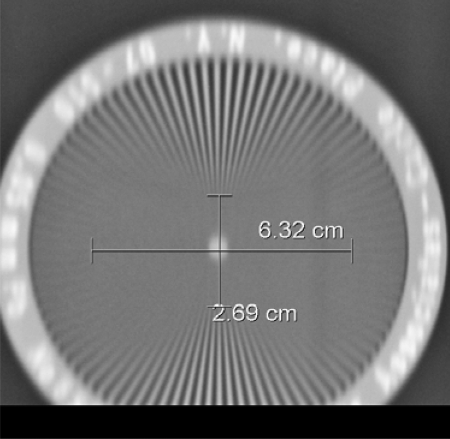
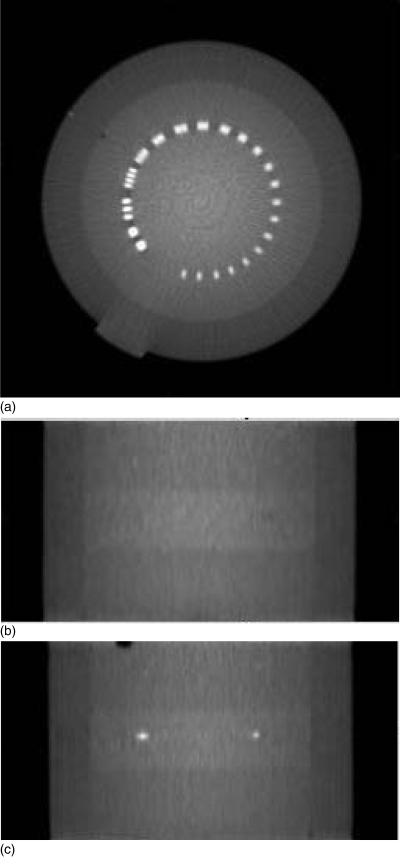
We scanned the CatPhan 600 CT phantom using the TBCT benchtop system. Figure 14 shows the reconstructed images of the phantom CTP 528 module. There are minor ring artifacts near the center of the images. Similar ring artifacts are also seen in diagnostic CT due to detector instability when mAs is insufficient.
Figure 14.
Reconstructed images of a CatPhan 600 Phantom. (a) Transverse view; (b) Coronal view; and (c) Sagittal view.
DISCUSSION AND CONCLUSION
Our MPFEX tube is one of the first tubes that XinRay Systems made. We expect that future improvements on the tube output and focal spot size can further improve image quality and reduce scanning time. Due to budget limitations, the pixel size of the detector we made for the benchtop system is slightly large compared with the detectors of diagnostic CT scanners. Thus, we consider it too early to perform a thorough evaluation of image quality at this time. The purpose of this note is to report our initial experience and results.
This tube was not originally designed for this project. It produces merely a few mA and does not have a forced cooling mechanism. In our previous publication,7 we predicted that a clinical TBCT tube needs to produce more than 300 mA anode current. By using a wider multi-row detector array, we can reduce the anode current requirement to less than 100 mA, which is possibly achievable by CNT field emission. Multiplexing10 is another possible approach to reduce the requirement of cathode current density. By activating multiple cathodes simultaneously at different frequencies, the requirement for tube current can theoretically be reduced by a factor of N/2 where N is the number of cathodes.10 This method requires a higher detector sampling rate to match the highest cathode switching frequency. With a maximum detector sampling rate of 6 kHz, we should be able to reduce the current density by a few times.
We have also encountered arcing problems when the anode voltage was set above 80 kV. The tube manufacturer claimed the arcing problem was improved by a design change. Apparently this issue has been solved, and an anode voltage as high as 160 kV has been achieved in recent MPFEX tubes that XinRay Systems developed.15
TBCT uses the same detector as a diagnostic CT scanner. We have developed a CT detector using CdWO4 scintillators and silicon photodiodes. The pixel size is larger than those of diagnostic CT detectors. In IGRT, it is preferable that the detector array be mounted further away from the rotation center to achieve the large clearance. Hence, a slightly larger pixel size is acceptable. In CBCT, however, due to the limited dimension (∼40 cm), the FPI is mounted closer to the rotation center, which worsens the scatter problem.16 Even so, the FPI has to be moved offset to achieve a large FOV. The gantry has to rotate a full 360° with the offset detector during a CBCT scan. On the other hand, the linear detector in TBCT can be made long so that only half a rotation is necessary.
Due to the low tube output, we did not install a bowtie filter on the TBCT benchtop system. A bowtie filter can prevent saturation of the detector in an unattenuated beam. Due to the low tube output, the detectors of the TBCT benchtop do not saturate with proper sensitivity setting. In the future when a higher power tube is used, a bowtie filter will be installed in the TBCT system. It not only prevents detector saturation but also modulates the radiation dose distributions for an optimal overall noise level.
In conclusion, a TBCT benchtop system has been successfully built with a 75 pixel MPFEX tube. The multiple pixel field emission x-ray tube is fully functioning, but a high tube current is desired for future clinical systems. Preliminary phantom images were successfully acquired. Full image quality evaluation will be performed when a system with a higher power tube and smaller detector pixel size is built.
ACKNOWLEDGMENTS
This work was partially supported by a research grant from NIH under Award No.: 1R21CA130330-01A1.
References
- Jaffray D. A. et al. , “Flat-panel cone-beam computed tomography for image-guided radiation therapy,” Int. J. Radiat. Oncol. Biol. Phys. 53(5), 1337–1349 (2002). 10.1016/S0360-3016(02)02884-5 [DOI] [PubMed] [Google Scholar]
- Letourneau D. et al. , “Cone-beam-CT guided radiation therapy: Technical implementation,” Radiother. Oncol. 75(3), 279–286 (2005). 10.1016/j.radonc.2005.03.001 [DOI] [PubMed] [Google Scholar]
- Endo M. et al. , “Effect of scattered radiation on image noise in cone beam CT,” Med. Phys. 28(4), 469–474 (2001). 10.1118/1.1357457 [DOI] [PubMed] [Google Scholar]
- Siewerdsen J. H. and Jaffray D. A., “Cone-beam computed tomography with a flat-panel imager: Effects of image lag,” Med. Phys. 26(12), 2635–2647 (1999). 10.1118/1.598803 [DOI] [PubMed] [Google Scholar]
- Siewerdsen J. H. and Jaffray D. A., “Cone-beam computed tomography with a flat-panel imager: Magnitude and effects of x-ray scatter,” Med. Phys. 28(2), 220–231 (2001). 10.1118/1.1339879 [DOI] [PubMed] [Google Scholar]
- Fahrig R. et al. , “Dose and image quality for a cone-beam C-arm CT system,” Med. Phys. 33(12), 4541–4550 (2006). 10.1118/1.2370508 [DOI] [PubMed] [Google Scholar]
- Zhang T. et al. , “Tetrahedron beam computed tomography (TBCT): A new design of volumetric CT system,” Phys. Med. Biol. 54(11), 3365–3378 (2009). 10.1088/0031-9155/54/11/006 [DOI] [PubMed] [Google Scholar]
- Speidel M. A. et al. , “Scanning-beam digital x-ray (SBDX) technology for interventional and diagnostic cardiac angiography,” Med. Phys. 33(8), 2714–2727 (2006). 10.1118/1.2208736 [DOI] [PubMed] [Google Scholar]
- Schmidt T. G. et al. , “A prototype table-top inverse-geometry volumetric CT system,” Med. Phys. 33(6), 1867–1878 (2006). 10.1118/1.2192887 [DOI] [PubMed] [Google Scholar]
- Zhang J. et al. , “Multiplexing radiography using a carbon nanotube based x-ray source,” Appl. Phys. Lett. 89, 1–3 (2006). [Google Scholar]
- Cao G. et al. , “A dynamic micro-CT scanner based on a carbon nanotube field emission x-ray source,” Phys. Med. Biol. 54(8), 2323–2340 (2009). 10.1088/0031-9155/54/8/005 [DOI] [PubMed] [Google Scholar]
- Maltz J. S. et al. , “Fixed gantry tomosynthesis system for radiation therapy image guidance based on a multiple source x-ray tube with carbon nanotube cathodes,” Med. Phys. 36(5), 1624–1636 (2009). 10.1118/1.3110067 [DOI] [PubMed] [Google Scholar]
- Qian X. et al. , “Design and characterization of a spatially distributed multibeam field emission x-ray source for stationary digital breast tomosynthesis,” Med. Phys. 36(10), 4389–4399 (2009). 10.1118/1.3213520 [DOI] [PMC free article] [PubMed] [Google Scholar]
- Zhu W. et al. , “High current density electron field emission from carbon nanotubes,” Appl. Phys. Lett. 75, 873–875 (2006). 10.1063/1.124541 [DOI] [Google Scholar]
- Sprenger F. (personal communication, 2010).
- Siewerdsen J. H. and Jaffray D. A., “Optimization of x-ray imaging geometry (with specific application to flat-panel cone-beam computed tomography),” Med. Phys. 27(8), 1903–1914 (2000). 10.1118/1.1286590 [DOI] [PubMed] [Google Scholar]


