Abstract
An accurate and reproducible segmentation of the mitral valve annulus from 3D ultrasound is useful to clinicians and researchers in applications such as pathology diagnosis and mitral valve modeling. Current segmentation methods, however, are based on 2D information, resulting in inaccuracies and a lack of spatial coherence. We present a segmentation algorithm which, given a single user-specified point near the center of the valve, uses max-flow and active contour methods to delineate the annulus geometry in 3D. Preliminary comparisons to manual segmentations and a sensitivity study show the algorithm is both accurate and robust.
Index Terms: mitral, annulus, segmentation, ultrasound
1. Introduction
The shape of the mitral valve annulus (MVA) is clinically useful in assessment of mitral valve function [1], pathology diagnosis [2], and surgical planning [3]. Researchers use the shape in prostheses design and as boundary conditions for mitral valve models [4]. Prior to three-dimensional ultrasound (3DUS), extracting the shape of the MVA was difficult, leading to the perception of the MVA as roughly planar instead of saddle shape as is now apparent [2]. Even with improved visualization of the mitral valve now available in 3DUS, the shape of the MVA is difficult to perceive due to volume visualization limitations and imaging noise, requiring segmentation to extract an accurate and discernible representation.
Current methods to segment the annulus are limited, requiring many researchers and clinicians to resort to manual segmentation of 2D slices [5]. While these segmentations can be accurate, they are time consuming and only allow access to a portion of the available information at each step. This requires the user to mentally interpolate the annulus surroundings, and often results in a lack of spatial coherence. Some methods attempt to correct for the sparse and discontinuous slice-based manual segmentations, but rely solely on the segmented points and do not refer back to the original data (e.g. [5,6]). A semi-automatic segmentation algorithm is presented in [7], however, the method again relies strongly on 2D information and does not appear to take advantage of three-dimensional data – neither from the surroundings nor its own segmentation – while delineating the annulus.
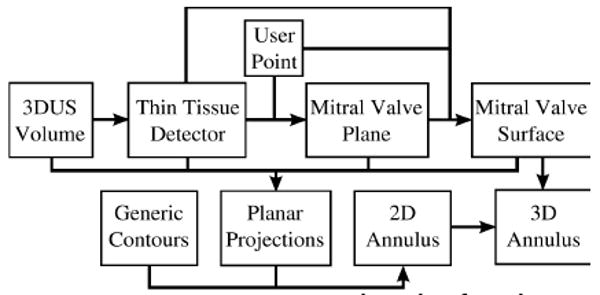
We present a robust semi-automatic algorithm that segments the mitral annulus three-dimensionally (Fig. 1). Due to the inherent difficulty in segmenting the annulus directly from 3DUS, we begin by first segmenting the better defined leaflets. This is done by computing a thin-tissue detector, which localizes the mitral valve leaflets. Using only a single user-provided point, we find a best-fit plane through the leaflets and position and orient a graph. A max-flow algorithm then finds a surface that includes the leaflets and passes through the annulus. Information about the leaflets and the surrounding tissue are then projected onto the best-fit plane. A unique active contour and convergence system then uses the planar projected data to delineate the annulus in 2D. Projecting the 2D annulus onto the 3D surface, a 3D contour representing the mitral annulus is found.
Figure 1. MVA segmentation algorithm flow chart.
2. Materials and Methods
Clinical transesophageal echocardiography data was acquired on an echocardiography system (iE33, Philips Medical Systems, Andover, MA, USA). The 4D (3D+time) data sets were ECG-gated full volume reconstructions, allowing for the visualization of the entire mitral valve. The state of the valve ranged from normal to varying types and degrees of pathology, and its position and orientation within the data volume varied. We stripped the data of patient information and manually selected the frame at which peak systole occurred. This frame, Ω, is an array (224×208×208) with each voxel, vi, containing an intensity value in the range of 0-255.
2.1 Thin Tissue Detector
A thin tissue detector (TTD) highlights tissue at a designated scale and is used to locate the mitral valve leaflets. We construct our TTD using three terms: θ, β, and ψ. θ is the mean angle between gradient vectors in a neighborhood, where the gradient vectors are computed on the Gaussian convolution of Ω, S=G(σ)*Ω. A neighborhood, Ni, is the set of all neighbors, nj, which are voxels contained within the cube of side length p centered at voxel vi, making j∊[1,J] where J=p3 for a cubical neighborhood. The standard deviation, σ, of the Gaussian kernel, G(σ), determines the scale of tissue thicknesses to be detected, and is set to half the thickness (voxels) of the mitral valve leaflets as they appear in the image, with a kernel dimension of 4σ+1.
| (1) |
β measures the net flow across the neighborhood boundaries, where the gradient vectors are interpreted as flow directions. The inward directed unit normal of each boundary face is denoted fq,norm, where q∊[1,6] for a cubical neighborhood. Neighbors with a face adjacent to fq,norm are denoted fk, where k∊[1,K] and K=p2 for a cubical neighborhood.
| (2) |
The last term, ψ, is a Gaussian convolution of the gradient magnitude of Ω and quantifies the proximity of a voxel to a strong edge on the scale of σ. In this work, p=3 and σ=2 is used.
| (3) |
The TTD value (Fig. 2) is (θ β[0,1] ψ)[0,1], where (·)[0,1] signifies that values for that term are normalized to the range 0 to 1. High TTD values indicate that the voxel is potentially part of the thin leaflet surface.
Figure 2.
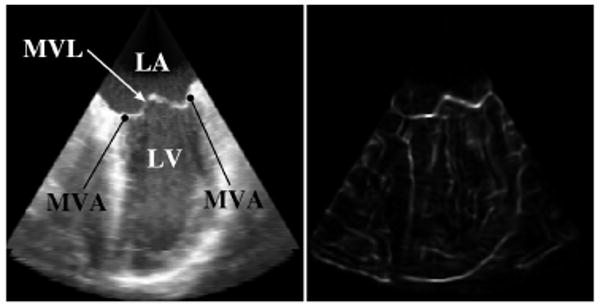
Corresponding views of a slice through a 3DUS volume showing the original intensity (left) and the TTD (right). (LA: Left Atrium; LV: Left Ventricle; MVL: Mitral Valve Leaflets; MVA: Mitral Valve Annulus)
2.2 Mitral Valve Leaflet Surface
Because the annulus surrounds the mitral leaflets, we construct a surface at the location of the leaflets that extends outward through the annulus. We begin by collecting a user-specified point, xc, which should be located near the center of the valve. Within a spherical region of interest of radius rPCA and centered at xc, we cluster the values of the TTD into two clusters using a k-means algorithm. Using the voxel locations of the cluster corresponding to the mitral valve leaflets, we perform a principal component analysis (PCA) to find MVplane, a best-fit plane to the leaflet surface. The normal vector to this plane, nc, is the direction of least variance as determined from the PCA.
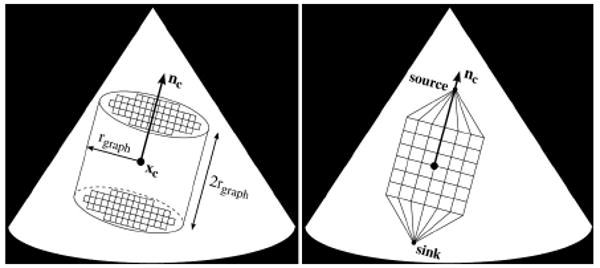
The point, xc, and planar normal, nc, locate and orient a graph, Γ={V,E}. We define the boundary as a cylinder centered at xc with an axis directed along nc, which has radius rgraph and height 2rgraph. Γ consists of a set of nodes, V, spaced one voxel apart, and undirected orthogonal edges, E, which connect the nodes. In addition there are two special nodes called the source and sink. The source connects to all nodes on one face of the cylinder while the sink connects to all nodes on the opposite face. The nodes and edges form a 3D grid which is directed along the axis of the cylinder. A simplified representation of the graph boundaries, position, and orientation relative to xc and nc is shown in Fig. 3. In this work we set rPCA=25 voxels and rgraph=50 voxels.
Figure 3. Example of cylindrical boundary for the graph (left) and a 2D representation of graph position and orientation along with the source and sink nodes (right).
The graph provides a framework in which we implement a max-flow algorithm to find a surface at the location of the leaflets. The algorithm, presented in [8], finds the maximum flow which can leave the source, travel through the graph along edges with predefined capacities, and enter the sink. In doing so, according to the max-flow/min-cut theorem [9], the set of saturated edges define a minimum cut through the graph. As it is desired to find a surface which passes through the leaflets, we define the edge capacities, Eij, such that between node Vi and Vj,
| (4) |
where ω and α are scalar weights. This gives the edges around the leaflets a lower capacity than most other edges, encouraging the min-cut to be located at the leaflets. For edges parallel to the axis of the cylinder, ω=1.5 and α =25, while for all other edges, ω=1 and α =25. This anisotropic edge capacity assignment is similar to [10] and limits surface curvature. We set edge capacity to infinity for those edges in which one of the nodes is either the source or the sink. With the graph constructed, we find the max-flow using the implementation of Kolmogorov [11]. The min-cut then defines a surface, MVsurf, which should pass through the mitral leaflets.
2.3 Annulus Delineation via Active Contours
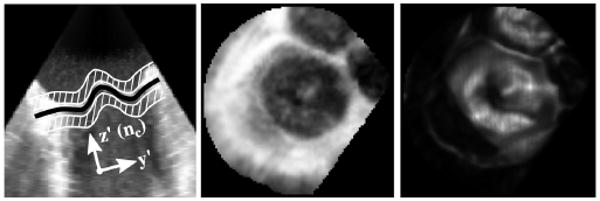
Controlling the curvature of MVsurf using ω, we can say that MVsurf is a regular surface in R3 and can be described as the graph of a function, Zsurf, described on the x′y′-plane (Eq.5). The x′y′z′-coordinate system (Fig. 4) is centered at xc with z′ parallel to nc. The annulus, a closed surface curve on MVsurf, therefore projects to a simple closed plane curve in the x′y′-plane. To help locate this plane curve, we construct two images, PRJINT and PRJTTD (Fig. 4). PRJINT (Eq.6) is the value of Ω in regions above and below MVsurf, excluding a band of thickness 2σ where the leaflets reside, and PRJTTD (Eq. 7) is the value of the TTD at MVsurf.
Figure 4. (Left to Right) 2D view of MVsurf (black) and regions used to form PRJINT (white), PRJINT, and PRJTTD.
| (5) |
| (6) |
| (7) |
We delineate the annulus contour in the x′y′-plane using a snake [12], modified to incorporate prior knowledge about the edge to be captured. By their construction, the mitral valve is located at the centrally located dark region in PRJINT and the bright region in PRJTTD, making the annulus the edges of these regions. As these edges take the shape of a closed contour containing the projected center point, xc′: (xc′,yc′), all snake nodes are initialized on, and restricted to, equally-spaced and stationary radial lines with origin xc′ and which extend to infinity (Fig. 5). This keeps snake nodes approximately evenly spaced, eliminates the need for an elastic energy term, and provides for smooth convergence.
Figure 5. Snake construction (left), and initialization and convergence system with multisnakes (right).
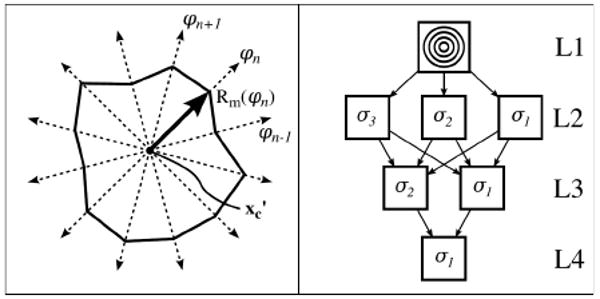
The image forces used to drive a snake, PRJINT and PRJTTD, are noisy and unpredictable due to ultrasound image quality and anatomical variability. To avoid the inherent difficulties with automatically initializing and converging a single snake to the desired location in such an image, we developed a novel multisnake (MS) mechanism in which multiple snakes operate simultaneously on the image. These snakes are initialized at different locations but are designed to converge to the same location in the image. To accomplish this, they are not only driven by image and curvature forces, but they are also attracted to each other. This induces snakes in weak or noisy locations in an image to converge on the desired location.
The energy equation driving a single snake in this construct is
| (8) |
where E(•) are energy terms and ω(•) are scalar weights. To capture the edge of the centrally located dark region in PRJINT and the bright region in PRJTTD, we derive EINT and ETTD from the gradients of PRJINT and PRJTTD, respectively. Curvature of the contour is taken into account in EXY and EZ. EXY accounts for the curvature of the contour in the 2D image plane, while EZ accounts for the curvature of MVsurf at the current location of the snake. For EXY, we use the curvature energy presented by Wagner and Perrin [13], as this form is shown to produce more stable contours in the absence of image forces as compared to other forms of curvature, a few of which are reviewed in [14]. EATT is an attractive energy between the snakes that drives the multiple snakes to a common location, overcoming weak edges and noise in PRJINT and PRJTTD and forcing the multiple snakes to converge to a single snake.
For automatically initializing and converging to the desired location, we developed a novel initialization and convergence system (ICS). The ICS is a scale space approach to provide robustness in the presence of resolution-specific noise. In the context of the ICS, “image σg” will refer to the energies derived from the convolutions of PRJINT and PRJTTD with a Gaussian kernel, defined by a standard deviation of σg and a kernel dimension of 4σg +1. At the top level of the ICS (L1 in Fig. 5) is a generic multisnake initialization, which we define as a set of m evenly distributed circles (m>1) with radii in the range of one to rgraph, based on prior knowledge that the annulus is roughly circular (m=4 in Fig. 5). The generic initialization is then placed into images σm-1 through σ1 (L2). The convergence of the multisnake in each of the images produces a single snake unique to the resolution of the image. The snakes from images σm-1 through σ1 are then combined to form another multisnake, which is then placed into images σm-2 through σ1 (L3). The process is repeated until two snakes are placed into a final image, which after converging produces the final contour (L4).
In this work, m=4 is used with σ3=4.5, σ2=3, and σ1=1.5. The energy minimization parameters used are ωINT=4, ωTTD=1, ωXY=0.07, ωZ=0.2, and ωATT=0.04-0.003σg. ωATT is larger for smaller σg because edges become more defined at finer resolutions, making the derivative at the edges larger with respect to the rest of the image. A larger attractive force is therefore needed to overcome these larger image forces. Forces derived from the minimizations of EINT and ETTD are normalized over the entire image so that their magnitude is less than or equal to one, while Zsurf is normalized to the range [0,1].
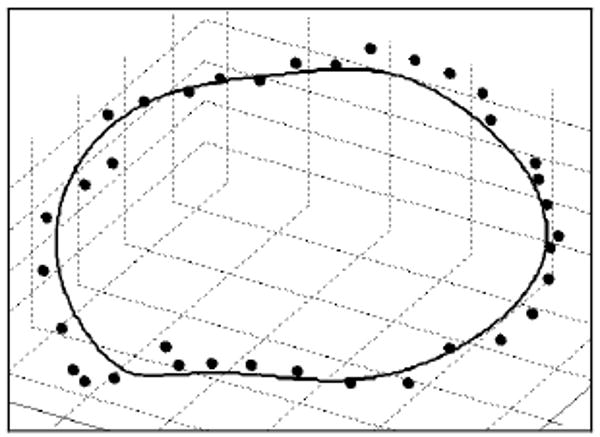
A smooth contour in 3D space representing the location of the MVA (Fig 6.) is constructed using the final snake, MVsurf, and a filtering process. Traversing the (x′,y′) coordinates of the final snake and determining Zsurf(x′,y′) at each coordinate pair, a voxelized representation of the MVA (x′mva, y′mva, z′mva) is obtained. A center point of the MVA is found as the mean of (x′mva, y′mva, z′mva), denoted (x′ca, y′ca, z′ca). The radial and height components of the MVA points as seen in a cylindrical coordinate system, where the radial component is r′mva=((x′mva-x′ca)2+(y′mva-y′ca)2)1/2 and the height component is z′mva, are filtered separately using a low-pass Butterworth filter.
Figure 6. Comparison of a semi-automatically segmented MVA (solid line) to a manually segmented MVA (points).
3. Results
As a preliminary validation, we compared the semi-automatic algorithm results to manual segmentations for four data sets (Table 1). A clinician performed the manual segmentations by selecting points in 2D slices through the image rotated every 10° about an axis (xc,base, nc,base) for each data set. We then computed the shortest Euclidean distances of the manually segmented points to the filtered annulus. To reduce the effects of inter-subject size variations, we also report a normalized distance in Table 1, which is a measure of the distances in millimeters compared to the largest diameter, dmax, of the manually segmented annulus. As an estimate of manual segmentation repeatability, Table 1 also reports a comparison between two separate segmentations made by the same clinician on the same data sets.
Table 1. Absolute (mm) and normalized (%) distance between semi-automatic and manual segmentations (Alg-Clin) and between two manual segmentations by the same clinician (Clin-Clin).
| Data Set | dmax (mm) | Distance (mm) (mean ± std. dev.) |
Distance (%) (mean ± std. dev.) |
||
|---|---|---|---|---|---|
| Alg-Clin | Clin-Clin | Alg-Clin | Clin-Clin | ||
| 1 | 37.97 | 1.09±0.56 | 1.20±0.60 | 2.88±1.48 | 3.17±1.57 |
| 2 | 29.68 | 0.91±0.47 | 1.04±0.54 | 3.05±1.57 | 3.49±1.82 |
| 3 | 29.37 | 1.29±0.89 | 1.31±2.24 | 4.38±3.03 | 4.48±7.61 |
| 4 | 28.04 | 1.30±0.87 | 0.55±0.30 | 4.62±3.12 | 1.96±1.07 |
| Mean | 31.27 | 1.15±0.70 | 1.03±0.92 | 3.73±2.30 | 3.28±3.67 |
We tested the sensitivity of the algorithm to the user-provided center point by running the algorithm 100 times on each data set where the center point, xc, was chosen randomly in a region surrounding xc,base. Tests showed that the algorithm produced accurate results (i.e. mean distance from the baseline segmentation of less than 2 mm) when |xc-xc,base|/ dmax ≤ 15%.
4. Discussion
We have demonstrated the ability to segment the mitral annulus given only a single user-specified point using a combination of graph-cut and active contour techniques. Recognizing the inherent difficulty in segmenting the annulus directly from 3DUS, we first constructed a surface through the leaflets using a max-flow algorithm and novel thin tissue detector. A unique snakes implementation, driven by projected information derived from the surface, delineated a 2D annulus which was then projected onto the 3D surface to find the 3D annulus shape. Previous methods use only a portion of the available information, often in the form of 2D slices from the 3D volume. This often results in inaccuracies and a lack of spatial coherence. The proposed algorithm integrates information from the 3D surroundings of the annulus during segmentation. Results suggest that the method is accurate, with mean difference from manual segmentation of 1.15±0.70 mm, which is comparable to the repeatability of the manual segmentation; further work is planned to fully validate this performance.
The only other 3D annulus segmentation algorithm known to the authors is the work by Wolf et al. [7]. Their algorithm first segments the left atrium from 2D slices, given a user-provided point. Assuming a position and orientation of the valve within the 3DUS volume, they delineate the annulus in 2D slices by finding the location where the tissue thickness at the segmented atrial border changes abruptly. A visual comparison to a manual segmentation was made for a single case, however, quantitative results were not provided. Their results showed a discontinuous segmentation with divergence from the manual segmentation.
Conversely, we have shown that with only a single user-provided point (xc), our algorithm can delineate the shape of the annulus as accurately as a clinician, using the same parameter values for all subjects. A sensitivity study showed that accurate results are obtained when the user chooses xc within a sphere with a diameter as large as 30% the size of the annulus. This suggests that the algorithm could be made fully automatic by using a method such as presented in [15], which automatically detects the left ventricular long axis and mitral valve plane. The intersection of the axis and plane could be used to define xc.
There are several sources of robustness and efficiency in this algorithm. The max-flow algorithm is an efficient and near-exact energy minimization method for graph-cuts [8], well-suited for finding a surface through the mitral leaflets. Results can suffer if large regions of the graph reside outside of the boundaries of the conical US data volume, however, this problem only happens when the mitral valve is near the narrow top of the data volume, and is easily remedied by reducing Rgraph. Also, if specifications for the location or curvature of MVsurf are desired, the algorithm is fast enough that the graph construction parameters (Rgraph, ω, and α) can easily be iterated until the desired results are obtained.
The multisnake (MS) construct and the design of the initialization and convergence system (ICS) make the algorithm robust, and are necessary to overcome noise and unpredictable anatomy. This differs from the usual scale-space approach used with snakes, which initializes a single snake in a low-resolution environment, stabilizes the snake using the image forces, and then proceeds to the next higher resolution image (e.g. [16]). While the MS and ICS are more computationally intensive, the added benefit of redundancy, both within each image scale and in proceeding through the different resolution images, makes the algorithm robust and accurate for challenging ultrasound image segmentation.
Acknowledgments
This work is supported by the US National Institutes of Health under grant NIH R01 HL073647-01 and NIH 5 F32 HL084965-03, and by the National Science Foundation GRFP.
References
- 1.Salgo I, Gorman J, et al. Effect of Annular Shape on Leaflet Curvature in Reducing Mitral Leaflet Stress. Am Heart Assoc. 2002;106:711–717. doi: 10.1161/01.cir.0000025426.39426.83. [DOI] [PubMed] [Google Scholar]
- 2.Jimenez JH, Soerensen DD, et al. Effects of a saddle shaped annulus on mitral valve function and chordal force distribution: an in vitro study. Ann Biomed Eng. 2003 Nov;31:1171–81. doi: 10.1114/1.1616929. [DOI] [PubMed] [Google Scholar]
- 3.Fabricius AM, Walther T, et al. Three-dimensional echocardiography for planning of mitral valve surgery: current applicability? Ann Thorac Surg. 2004 Aug;78:575–8. doi: 10.1016/j.athoracsur.2003.10.031. [DOI] [PubMed] [Google Scholar]
- 4.Lim KH, Yeo JH, et al. Three-dimensional asymmetrical modeling of the mitral valve: a finite element study with dynamic boundaries. J Heart Valve Dis. 2005 May;14:386–92. [PubMed] [Google Scholar]
- 5.Lei Z, Xin Y, et al. Three Dimensional Reconstruction and Dynamic Analysis of Mitral Annular Based on Connected Equi-Length Curve Angle Chain. In: Zhang D, editor. ICMB. Vol. 4901. LNCS; 2007. pp. 298–306. [Google Scholar]
- 6.Ratanasopa S, Bolson EL, et al. Performance of a Fourier-based program for three-dimensional reconstruction of the mitral annulus on application to sparse, noisy data. Int J Card Imaging. 1999 Aug;15:301–7. doi: 10.1023/a:1006184726733. [DOI] [PubMed] [Google Scholar]
- 7.Wolf I, Hastenteufel M, et al. Comp in Cardiology. Rotterdam, Netherlands: 2001. Three-Dimensional Annulus Segmentation and Hybrid Visualisation in Echocardiography; pp. 105–8. [Google Scholar]
- 8.Boykov Y, Kolmogorov V. An experimental comparison of min-cut/max-flow algorithms for energy minimization in vision. IEEE Trans Pattern Anal Mach Intell. 2004 Sep;26:1124–37. doi: 10.1109/TPAMI.2004.60. [DOI] [PubMed] [Google Scholar]
- 9.Ford LR, Fulkerson DR. Flows in Networks. Princeton, NJ: Princeton University Press; 1962. [Google Scholar]
- 10.Roy S. Stereo Without Epipolar Lines: A Maximum-Flow Formulation. Intl J of Comp Vision. 1999;34:147–161. [Google Scholar]
- 11.Kolmogorov V. Software. University College; London - Adastral Park: 2004. [October 1, 2008]. MAXFLOW. [Online] Available: http://www.adastral.ucl.ac.uk/∼vladkolm/software.html. [Google Scholar]
- 12.Kass M, Witkin A, et al. Snakes: Active Contour Models. Intl J Comp Vision. 1988:321–331. [Google Scholar]
- 13.Wagner CR, Perrin DP. SPIE Medical Imaging 2008: Image Processing. San Diego, CA, USA: 2008. Efficient curvature estimations for real-time (25Hz) segmentation of volumetric ultrasound data; pp. 69144H–10. [Google Scholar]
- 14.Williams DJ, Shah M. A fast algorithm for active contours and curvature estimation. CVGIP: Image Underst. 1992;55:14–26. [Google Scholar]
- 15.van Stralen M, Leung KY, et al. Time continuous detection of the left ventricular long axis and the mitral valve plane in 3-D echocardiography. Ultrasound Med Biol. 2008 Feb;34:196–207. doi: 10.1016/j.ultrasmedbio.2007.07.016. [DOI] [PubMed] [Google Scholar]
- 16.Van Raad V. Active contour models - a multiscale implementation for anatomical feature delineation in cervical images. Image Processing, 2004. ICIP '04. 2004 International Conference; 2004; pp. 557–560. [Google Scholar]


