Background: Antidepressant drugs have complex and poorly understood mechanisms of action potentially involving G protein-coupled receptors.
Results: Desipramine binds the α2A-adrenergic receptor, leading to arrestin recruitment and trafficking responses but not signaling.
Conclusion: Desipramine directly drives down-regulation of neuronal α2A-adrenergic receptors in an arrestin3-dependent fashion.
Significance: Arrestin-biased targeting of G protein-coupled receptors may represent a novel therapeutic strategy in the neuropharmacology of depressive disorders.
Keywords: Adrenergic Receptor, G Protein-coupled Receptors (GPCR), G Proteins, Intracellular Trafficking, Signal Transduction, Antidepressants, Arrestin, Desipramine, Down-regulation, Norepinephrine
Abstract
The neurobiological mechanisms of action underlying antidepressant drugs remain poorly understood. Desipramine (DMI) is an antidepressant classically characterized as an inhibitor of norepinephrine reuptake. Available evidence, however, suggests a mechanism more complex than simple reuptake inhibition. In the present study, we have characterized the direct interaction between DMI and the α2A-adrenergic receptor (α2AAR), a key regulator of noradrenergic neurotransmission with altered expression and function in depression. DMI alone was found to be sufficient to drive receptor internalization acutely and a robust down-regulation of α2AAR expression and signaling following prolonged stimulation in vitro. These effects are achieved through arrestin-biased regulation of the receptor, as DMI selectively induces recruitment of arrestin but not activation of heterotrimeric G proteins. Meanwhile, a physiologically relevant concentration of endogenous agonist (norepinephrine) was unable to sustain a down-regulation response. Prolonged in vivo administration of DMI resulted in significant down-regulation of synaptic α2AAR expression, a response that was lost in arrestin3-null animals. We contend that direct DMI-driven arrestin-mediated α2AAR down-regulation accounts for the therapeutically desirable but mechanistically unexplained adaptive alterations in receptor expression associated with this antidepressant. Our results provide novel insight into both the pharmacology of this antidepressant drug and the targeting of the α2AAR in depression.
Introduction
The depressive disorders represent a significant public health burden, with lifetime incidences approaching 12 and 20% for men and women, respectively (1, 2). Consequently, antidepressant drugs are among the most prescribed therapeutic agents (3), although the overall efficacy of antidepressants remains at ∼50% (4), leaving a substantial number of patients inadequately treated. As well, despite the relative prevalence of use of these drugs, their underlying neuropharmacology remains largely mysterious. Filling in the gaps in knowledge of antidepressant pharmacology will contribute to improved design of future therapeutics, and enhance understanding of the neurobiology of depression, which itself remains incompletely understood due largely to tremendous complexity (5).
Desipramine (DMI)2 is a tricyclic antidepressant drug with high potency for blockade of the norepinephrine (NE) transporter (NET) (6). As well, DMI has the strongest selectivity for NET among the tricyclic antidepressants, many of which have more significant activity at the serotonin transporter than at NET (6). DMI, then, functions as an inhibitor of NE reuptake, a process that clears the neurotransmitter from noradrenergic synapses, and is thought to function primarily by modulating noradrenergic neurotransmission in the brain. As with all such drugs, steps beyond reuptake inhibition are unclear. The importance of molecular targets other than NET is emphasized by evidence that the NET knock-out mouse model retains some antidepressant response to DMI (7). Indeed, DMI is known to have affinity for a number of neurotransmitter receptors, including α2ARs, although the potential physiological relevance of such interactions has not been explored (6, 8–10).
α2-Adrenergic receptors (α2ARs), of which the α2AAR is the predominant subtype in the central nervous system (11–13), play a key role in noradrenergic neurotransmission, which is thought to be dysregulated in depression. α2AAR autoreceptors have long been appreciated as the major receptors controlling synthesis and release of NE from noradrenergic terminals (14, 15), whereas more recent evidence has discovered roles for α2AAR heteroreceptors in non-noradrenergic cells (16, 17). Indeed, alleviation of this additional inhibitory input to neuronal function by α2AR antagonist treatment has been shown to enhance the effects of tricyclic antidepressant treatment (18). The importance of the α2AAR in depression is further suggested by a number of studies showing clinical evidence of up-regulated α2AR expression (19–23) and α2AR supersensitivity (24) in patients with depression. As well, several studies have linked chronic exposure to antidepressants including DMI with down-regulation of α2AR expression in experimental models (25–29) and clinically (30). This down-regulation effect has been casually attributed to the actions of NE, although evidence to support this postulation is lacking. In fact, experimental evidence from NET knock-out mice strongly suggests that physiologically elevated NE levels alone do not drive α2AR down-regulation, as these mice in fact have up-regulated α2AR expression (31, 31) despite 2-fold higher basal extracellular NE levels (32).
In the present study, we have hypothesized that the heretofore unexplored pharmacological actions of DMI at the α2AAR directly, independent of NE, influence receptor function with implications for the antidepressant mechanism of action. We have found that DMI serves as an arrestin-biased ligand at the α2AAR, and alone is sufficient to drive dramatic down-regulation of α2AAR expression, with concurrent reduction in endogenous agonist signaling through the receptor. These effects occur in an arrestin-dependent manner. By contrast, a physiologically relevant concentration of NE is unable to drive down-regulation. Significantly, we have observed DMI-driven down-regulation of synaptic α2AAR expression in vivo in wild-type animals, a response that is completely abolished in arrestin3-null mice.
EXPERIMENTAL PROCEDURES
Animals
All mice were house in the AAALAC-accredited Animal Resources Program facility at the University of Alabama at Birmingham (UAB) in accordance with procedures of the Animal Welfare Act and the 1989 amendments to the Act, and all studies followed protocols approved by the UAB Institutional Animal Care and Use Committee. The generation of HA-tagged α2AAR mice (33) and arrestin3-null (Arr3−/−) mice (34) has been described previously. Both transgenic lines were backcrossed over 10 generations to C57BL/6 genetic background. For in vivo studies, male Arr3−/− mice aged 3–5 months and age-matched wild-type (WT, C57BL/6) mice were used.
Heterologous Cell Culture
HEK 293 and mouse embryonic fibroblast (MEF) cell lines stably expressing a N-terminal hemagglutinin (HA) epitope-tagged murine α2AAR were cultured in Dulbecco's modified Eagle's medium (DMEM, Invitrogen) supplemented with 10% fetal bovine serum (FBS, Atlanta Biologicals), 1% penicillin/streptomycin, and 2 mm l-glutamine (Invitrogen), and maintained in a humidified 5% CO2 incubator. HEK 293 cells stably expressing HA-α2AAR at a density of 7–8 pmol/mg were described previously (35). WT and arrestin-deficient (Arr2,3−/−) MEFs were transduced with retroviral vectors encoding HA-α2AAR and cells stably expressing the receptor were selected by puromycin treatment as described previously (36). MEF cells were found to express the α2AAR at an average density of 400 fmol/mg. Cells were serum-starved overnight prior to functional experiments.
Primary Culture of Prefrontal Region Neurons
Dissociated cortical neuron cultures were prepared from the prefrontal region (PFC), isolated from HA-tagged α2AAR knock-in mice. Whole brains of postnatal day 0–1 pups were dissected out and placed into Hanks' balanced salt solution (Invitrogen) containing 25 mm glucose and 20 mm HEPES, pH 7.3. Prefrontal cortical regions were isolated and subjected to digestion with papain (PAP2, Worthington) for 15 min at 37 °C. Neurons were then dissociated by gentle trituration with a fire-polished siliconized Pasteur pipette, with the resulting cell suspension passed through a 40-μm cell strainer (Fisher). The number of live neurons was obtained by a hemacytometer counting with trypan blue dye. Cells were plated to 24-well culture plates pre-coated with 50 μg/ml of poly-d-lysine (Sigma) and maintained in a humidified 5% CO2 incubator. Cells were plated in Neurobasal-A medium (Invitrogen) containing 5% FBS and the following supplements (all obtained from Invitrogen): 2% Glutamax, 2% B27 supplement, and 100 μg/ml of gentamicin. Feeding medium (same as plating medium excluding FBS) was used for medium changes, with 5 μm 5-fluoro-2′-deoxyuridine (Sigma) added on day in vitro 1, to reduce growth of non-neuronal cells. All experiments were performed on days in vitro 10–11.
Drugs
DMI hydrochloride and NE bitartrate salt were obtained from Sigma. Stock solutions were prepared fresh in water prior to each experiment at a concentration of 10 mm. Phentolamine (regitine hydrochloride, CIBA-Geigy) was used as an α2AR antagonist. For functional experiments, all DMI/NE treatments were done in the presence of 1 μm propranolol (βAR antagonist, Sigma) and prazosin (α1 and α2B,C AR antagonist, Sigma). For long-term treatments with DMI/NE, control cells were treated with serum-free DMEM containing propranolol/prazosin only.
Radioligand Binding
Binding of DMI and NE to the α2AAR was assessed by competition for binding with 3H-labeled α2AR antagonist RX821002 ([3H]RX821002, PerkinElmer Life Sciences) in crude membrane preparations from HEK 293 cells as previously described (33, 37). Competition binding experiments were done in the presence of Gpp(NH)p to eliminate regulation of ligand binding by heterotrimeric G proteins. Concentration-response curves were analyzed using GraphPad Prism (GraphPad Software, San Diego, CA) to determine IC50 values. Ki values for DMI and NE were calculated according to the method of Cheng and Prusoff/Chou (38, 39), utilizing the equation: Ki = IC50/[1 + ([radioligand]/Ki radioligand), where [radioligand] is expressed in nanomoles and Ki radioligand = 0.5 nm (40). The orthosteric nature of the binding of DMI to the receptor was confirmed using a method described by Limbird (41). In brief, concentration-response curves for DMI for its competition with [3H]RX821002 were obtained at additional concentrations of RX821002 (2 and 8 nm). Determined IC50 values (normalized to Ki values calculated from those IC50 values as above) were then plotted as a function of radioligand concentration (normalized to its Ki value) and linear regression analysis was performed.
Saturation binding was used to assess receptor density following prolonged treatments of MEF cells with DMI and NE (33, 42). Crude membrane preparations were incubated with a saturating concentration of [3H]RX821002 for 30 min at 25 °C; samples were then harvested and analyzed as in competition binding. Raw radioactivity values (in counts/min) were normalized to total protein content (determined by Bio-Rad DC Protein Assay, according to the manufacturer's instructions).
[35S]GTPγS Binding
Ligand-stimulated coupling of heterotrimeric G proteins to the α2AAR was assessed by a [35S]GTPγS binding assay carried out as previously described (43). Crude membrane preparations from HEK 293 cells were obtained by harvesting cells in membrane preparation buffer (5 mm Tris, pH 7.4, 5 mm EDTA, 5 mm EGTA) and centrifugation at 39,200 × g. After two washes, the preparation was resuspended in assay buffer (50 mm Tris, pH 7.4, 5 mm MgCl2, 100 mm NaCl, 1 mm EDTA) containing 2 μm GDP, 1 μm propranolol, and 320 pm [35S]GTPγS (1250 Ci/mmol, PerkinElmer Life Sciences). Preparations were incubated with either DMI or NE for 60 min, with binding measured by liquid scintillation counting. Ligand-stimulated [35S]GTPγS binding was calculated as a fold-increase in binding over unstimulated (basal) control samples.
Western Blot
Following drug stimulation, cells were lysed in Laemmli buffer (0.8 m Tris, pH 6.8, 0.5% (v/v) β-mercaptoethanol, 4% (w/v) SDS, 20% (v/v) glycerol), and homogenates were separated on 10% SDS-PAGE gel. Primary antibodies were as follows: phospho-p44/42 MAPK (Thr-202/Tyr-204, mouse monoclonal, Cell Signaling), 1:16,000; total p44/42 MAPK (rabbit polyclonal, Cell Signaling); phospho-Akt (Thr-308, rabbit polyclonal, Cell Signaling); β-tubulin (mouse, University of Iowa Hybridoma Bank), 1:50,000; anti-HA (HA11, mouse monoclonal, Covance), 1:4,000; anti-GFP (mouse mixed monoclonal, Roche Applied Science), 1:10,000. HRP-conjugated secondary antibodies were obtained from Millipore, and the signal was detected using the Immobilon Western detection system (Millipore). For total ERK (p44/42 MAPK) blots, membranes were first probed with phosphoantibody, and then stripped (incubated in stripping buffer containing 62.5 mm Tris, pH 6.8, 2% SDS, and 100 mm 2-mercaptoethanol for 30 min at 65 °C) before re-probing with total antibody.
Intact Cell Surface ELISA
Receptor internalization was quantitatively assessed using an intact cell surface ELISA method (44, 45). Briefly, MEF cells (seeded onto 96-well culture plates at 1 × 10⁴ cells/well) were stimulated acutely with DMI or NE, and then subjected to fixation, blocking, primary antibody (HA11, 1:3000), and secondary antibody (HRP-conjugated anti-mouse, 1:2000). Following incubation with o-phenylenediamine substrate (Pierce), surface receptor density was determined by measuring absorbance at 490 nm. The same protocol was adapted for primary neurons by scaling up volumes for a 24-well culture plate.
Immunofluorescent Staining
Receptor internalization was qualitatively assessed with a pre-labeling method for staining of HA-tagged α2AARs as previously described (33, 45). MEF cells (seeded onto glass cover slips in 24-well culture plates at 2 × 10⁴ cells/well) were acutely stimulated with DMI or NE. Surface α2AARs were labeled with HA11 primary antibody (1:125 dilution) prior to stimulation, fixation, permeablization, blocking, and secondary antibody incubation (Alexa 488-conjugated anti-mouse antibody, 1:1000 dilution, Molecular Probes). Cells were visualized by confocal microscopy on a Leica SP2 microscope. For assessment of α2AAR expression in primary neurons, rat anti-HA antibody (Roche Applied Science) was used to label HA-α2AARs.
Co-immunoprecipitation
The ability of DMI to induce complex formation between the α2AAR and arrestin3 (β-arrestin2) was assessed by a co-immunoprecipitation strategy, modified from a previously described method (46). Briefly, HEK 293 cells (stably expressing HA-α2AAR) were transiently transfected with plasmid containing a GFP-tagged arrestin3 (47) using Lipofectamine 2000 (Sigma). After stimulation, cells were lysed in buffer containing 20 mm HEPES, 0.5% Nonidet P-40, 10% glycerol, 2 mm EDTA, and protease inhibitors, and then subjected to immunoprecipitation with rat anti-HA antibody (Roche Applied Science).
FLIM-FRET
Fluorescence lifetime imaging microscopy (FLIM) was used to obtain further evidence for the DMI-stimulated α2AAR/arrestin interaction in the form of FRET. By this method, FRET (detectable only when the two fluorophores are within 10 nm or less of each other) (48) was observed as a decrease in CFP fluorophore lifetime. C-terminal CFP-tagged α2AAR and N-terminal YFP-tagged arrestin2/3 constructs were prepared by PCR amplification and cloning of cDNAs encoding the receptor and each arrestin into pECFP-N1 and pEYFP-C1 vectors (Clontech), respectively. Constructs were verified by sequencing prior to use. HEK cells were transiently transfected using Lipofectamine 2000 with plasmids containing CFP-α2AAR alone (2 μg) or in combination with YFP-arrestin2/3 (1 μg each). Live cells plated onto 8-well microslides (ibidi GmbH) were then subjected to one-photon (confocal) FLIM imaging using a Becker and Hickl Simple Tau Time Correlated Single Photon Counting Module and pulsed diode 405 nm laser (Becker and Hickl GmbH) attached to a Zeiss LSM 710 confocal microscope (Carl Zeiss) and confocal imaging (to detect localization of CFP- and YFP-tagged proteins) using the Zeiss. Single photon counting images were then analyzed using the manufacturer's SPCImage software to obtain CFP intensity and lifetime images. Lifetime images were obtained by selecting a region of interest containing both CFP and YFP and performing double-exponential decay analysis for a single measurement point defined as the color code (green in our experiments) assigned to the fluorescence lifetime population of the donor (CFP). Measurement points were specifically selected at the cell surface. For each treatment group, 5–6 individual cells from 2 to 3 different samples were imaged and analyzed, with the raw readout being CFP lifetime (in picoseconds). FLIM-FRET efficiency (E) was calculated as: E = 1 − (tFRET/tCFP), where tFRET and tCFP are the CFP lifetimes obtained for cells expressing CFP and YFP (unstimulated or stimulated for 10 min with DMI prior to imaging) or CFP alone, respectively.
K+ Depletion Protocol
K+ depletion protocol for blocking clathrin-mediated endocytosis was adapted from previous studies (35, 49). MEF cells seeded for ELISA as above were incubated in hypotonic shock solution (1:1 mixture of serum-free DMEM and distilled water) for 5 min at 37 °C, and then incubated in K+-depleting buffer (100 mm NaCl, 50 mm HEPES, pH 7.4, 1 mm CaCl2, 1 mm MgCl2) for 1 h at 37 °C. Control cells received a sham treatment substituting serum-free DMEM for shock solution and PBScm for K+-depleting buffer.
Long-term DMI Plus NE Re-stimulation Assay
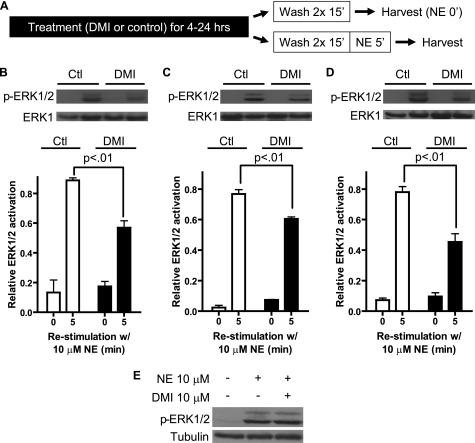
NE-driven signaling (activation of ERK1/2) was assessed following long-term treatments with DMI. DMI- or control-treated MEF cells were washed 2 times, 15 min each in serum-free DMEM, and then either harvested directly (as described above for Western blot) or stimulated with 10 μm NE for 5 min and harvested (see Fig. 7A). Cell homogenates were then subjected to Western blot for ERK1/2 activation, and for HA-α2AAR density as an independent method to assess receptor down-regulation.
FIGURE 7.
DMI-driven α2AAR down-regulation in MEFs results in diminished endogenous agonist signaling through the receptor. A, schematic detailing the long-term DMI plus NE re-stimulation assay used to determine diminished signaling. B–D, blots (upper) and densitometry (lower) representing three independent experiments reveal significant reductions in NE-stimulated, α2AAR-mediated activation of ERK1/2 following long-term exposure to 10 μm DMI. ERK activation was calculated as the ratio of phospho-ERK1/2:total ERK1. 4 (B), 16 (C), and 24 h (D) treatment with DMI reduced NE-stimulated ERK activation by 36, 22, and 42%, respectively, versus control-treated cells. Data are mean ± S.E. and represent three independent experiments. p values are for comparison between 5-min NE re-stimulation samples, control versus DMI-treated. E, Western blot targeting active ERK1/2 in MEF cells following 5 min stimulation with 10 μm NE alone or in combination with 10 μm DMI.
Long-term in Vivo Administration of DMI and Preparation of Crude Synaptosomes
Prolonged exposure of whole animals to DMI was achieved by continuous administration via osmotic minipumps. ALZET pumps (model 1002, 0.25 μl/h, 14-day capacity) were obtained from Durect (Cupertino, CA). Pumps were filled according to the manufacturer's instructions with DMI solution (dissolved in 15% ethanol), diluted to an appropriate concentration such that a dose of 20 mg/kg would be delivered per day, or vehicle (15% ethanol alone). WT and Arr3−/− mice were anesthetized with isoflurane and pumps were implanted subcutaneously according to the manufacturer's instructions. 14 days post-surgery, mice were sacrificed and cortical brain tissue was removed. One-half of the whole cortex was homogenized in 0.32 m sucrose solution containing 4.2 mm HEPES, pH 7.4, 0.1 mm CaCl2, and 1 mm MgCl2. Homogenate was then centrifuged at 1000 × g for 10 min, with the resulting supernatant then centrifuged at 10,000 × g for 20 min. The resulting pellet containing the crude synaptosomal fraction was then subjected to saturation radioligand binding as described above, with the addition of 1 μm prazosin to the reaction to block α2B- and α2CAR subtypes.
RESULTS
DMI Is an Orthosteric Ligand at the α2AAR
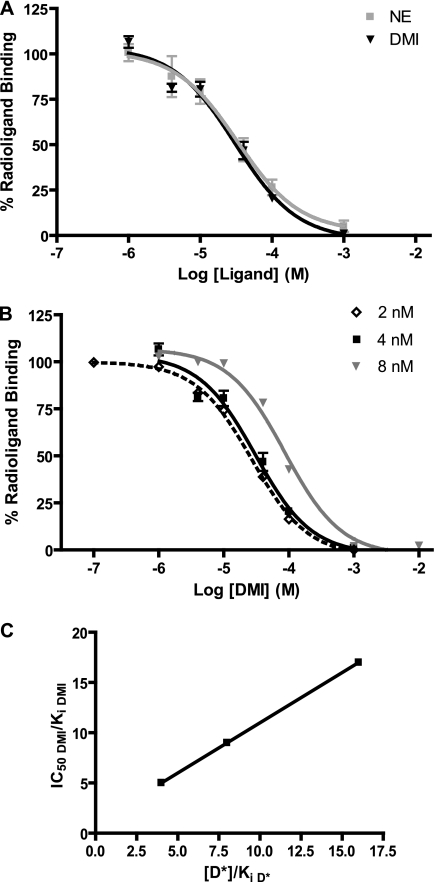
Although previous studies have reported the binding of DMI to α2ARs (6, 8–10), the pharmacological nature of this interaction has not been fully investigated. We began by performing competition radioligand binding analysis in membrane preparations from HEK 293 cells to characterize the binding of DMI and the endogenous ligand NE (for comparison) to the α2AAR subtype specifically using a radioligand concentration of 4 nm (Fig. 1A). We next sought to define the binding of DMI to the α2AAR as orthosteric or allosteric in nature. According to the method described by Limbird (41), competition binding curves for DMI were constructed at two additional concentrations of radioligand (2 and 8 nm) (Fig. 1B). IC50 values for competition with the radioligand determined graphically were used to calculate the Ki values according to the method of Cheng and Prusoff/Chou (38, 39). These values are indicative of the intrinsic affinity of the α2AAR for each ligand. Results of this pharmacological analysis are shown in Table 1. Averaging the three independent determinations of the Ki for DMI returned a value of 4.62 μm, comparable with the 3.63 μm value obtained for NE. In Fig. 1C, the IC50 to Ki ratio for each of three binding curves in Fig. 1B (values in Table 1) have been plotted as a function of radioligand concentration (normalized to its own Ki). The resulting strong linear relationship is characteristic of binding that is orthosteric (i.e. truly competitive) with the radioligand. Table 1 also summarizes the therapeutic range for DMI (typical clinical serum concentrations) for reference, based on previous work in the literature. As well, chronic administration of tricyclic antidepressants at a therapeutic level in rodents has been shown to result in brain concentrations of 1–10 μm (50). On the basis of this information as well as our own pharmacological analysis, we chose to conduct the majority of our experiments using doses of 10 and 1 μm.
FIGURE 1.
DMI is an orthosteric ligand at the α2AAR. A, competition radioligand binding analysis carried out in membrane preparations from HEK 293 cells at a radioligand concentration of 4 nm revealed essentially identical binding profiles (concentration response curves for competition with the radioligand) for DMI and NE at the α2AAR. B, competition concentration-response curves were constructed for DMI at three different concentrations of radioligand (2, 4, and 8 nm). C, IC50 values from each curve in panel A (normalized to calculated Ki values for each, see Table 1 for calculations) were plotted as a function of radioligand concentration ([D*], normalized to its own Ki at the α2AAR). Linear regression analysis returned an r2 value of 1.000. Data are mean ± S.E. and represent n = 3–4.
TABLE 1.
Summary of pharmacological analysis of DMI and NE
IC50 values were determined graphically and Ki values were calculated according to the method of Cheng and Prusoff/Chou (38, 39). [D*] = radioligand concentration (nm). Clinical values found in Ref. 69.
| Parameter | [D*] | DMI | NE |
|---|---|---|---|
| IC50 (μm) | 2 | 26.9 | NDa |
| 4 | 30.4 | 32.7 | |
| 8 | 86.5 | ND | |
| Ki (μm) | 2 | 5.38 | ND |
| 4 | 3.38 | 3.63 | |
| 8 | 5.09 | ND | |
| Average Ki (μm) | 4.62 | 3.63 | |
| IC50/Ki | 2 | 5.00 | ND |
| 4 | 8.99 | 9.01 | |
| 8 | 16.99 | ND | |
| Clinical therapeutic range (ng/ml) | 125–600 | NAb | |
| Clinical therapeutic range (μm) | 0.5–2.3 | NA |
a ND, not determined.
b NA, not applicable.
DMI Does Not Drive G Protein Coupling to the α2AAR or Subsequent Signaling
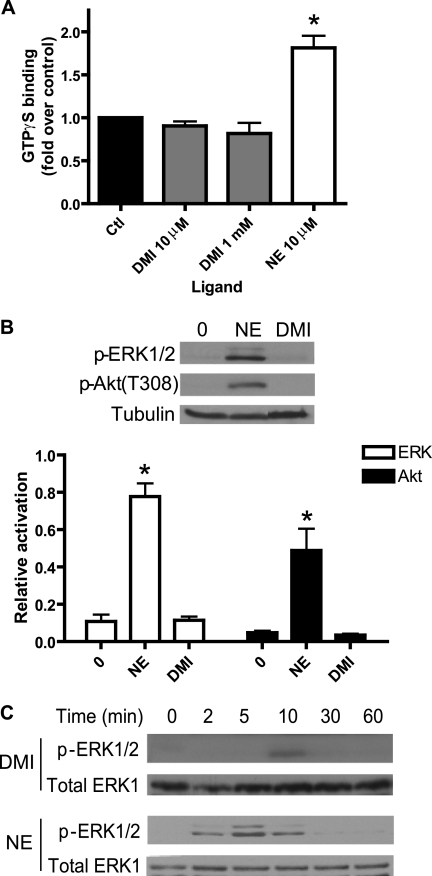
For functional classification of DMI as an α2AAR ligand, we assessed the ability of DMI to drive classical heterotrimeric G protein-mediated signaling by the receptor. We began with a [35S]GTPγS binding assay, again in membrane preparations from HEK 293 cells, which gives a measure of ligand-stimulated G protein activation by the receptor. DMI at either a Ki approximating concentration of 10 μm or a saturating concentration of 10 mm was unable to drive any appreciable GTPγS binding, compared with a robust 2-fold induction in response to 10 μm NE (Fig. 2A). As well, DMI showed no activity in an assay for α2AAR-mediated inhibition of cyclic AMP production (data not shown).
FIGURE 2.
DMI does not activate G protein-mediated signaling at the α2AAR. A, GTPγS binding assay in HEK 293 cells revealed no activation of heterotrimeric G proteins by the α2AAR in response to DMI at either 10 μm or 1 mm. For contrast, 10 μm NE resulted in an ∼2-fold increase in binding versus control (set as 1.0-fold). B, Western blot showed no DMI-stimulated MAP kinase ERK1/2 or Akt signaling in MEFs (10 μm, 5 min stimulation; same treatment with NE included as positive control). Relative activation was calculated as the ratio of phosphokinase to tubulin (total protein control). C, time course analysis for ERK1/2 activation by DMI and NE in MEFs (10 μm). Representative Western blots are shown. Densitometric quantitation carried out over three independent experiments revealed that the weak ERK1/2 activation observed at 10 min for DMI approached but did not reach statistical significance (p = 0.057). Data are mean ± S.E. and represent n ≥ 3 independent experiments. *, p < 0.01 versus time 0 (control).
Furthermore, we examined two downstream targets of α2AAR signaling known to be activated in a Gi-dependent and pertussis toxin-sensitive fashion, ERK1/2 MAP kinase (46, 49) and Akt3 (51). These signaling experiments were carried out in MEF cells stably expressing α2AARs, introduced by retroviral transduction. Although 5 min stimulation with 10 μm NE induced robust activation of both ERK1/2 and Akt, the same stimulation with DMI induced no detectable activation (Fig. 2B). To confirm that this negative result was not simply due to different kinetics of signaling, we performed a time course analysis with 10 μm DMI. We found only a very weak and transient activation of ERK1/2, again compared with robust activation kinetics for NE (Fig. 2C); similar results were observed for Akt (data not shown). These results indicate that DMI is not an effective activator of these G protein-dependent signaling pathways through the α2AAR.
DMI Drives α2AAR Internalization via Clathrin-coated Pits in an Arrestin-mediated Fashion
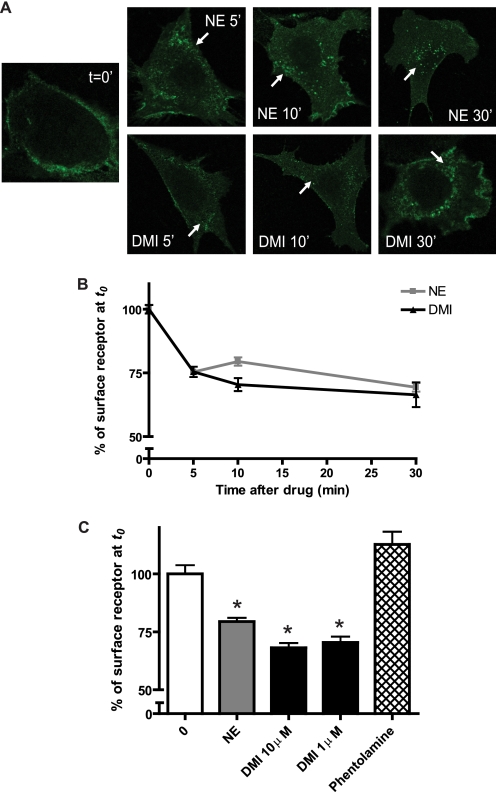
We proceeded to investigate whether DMI could drive receptor internalization, another possible functional consequence of ligand binding. Beginning with the qualitative approach of immunofluorescent staining in MEFs, and using NE as a positive control, we found that 10 μm DMI is in fact able to drive receptor internalization, as indicated by the characteristic perinuclear punctate staining pattern following 5, 10, and 30 min stimulation (Fig. 3A). We further confirmed receptor internalization by the more quantitative approach of cell surface ELISA. Again, DMI stimulated robust receptor internalization, which was essentially indistinguishable from that stimulated by NE (Fig. 3B). Furthermore, the therapeutically relevant DMI concentration of 1 μm drove a similar degree of internalization. By contrast, the α2AR antagonist phentolamine produced no trafficking response (Fig. 3C).
FIGURE 3.
DMI drives α2AAR internalization acutely. A, immunostaining revealed α2AAR internalization in MEFs stimulated acutely by 10 μm NE (upper) or DMI (lower) for the indicated times. Internalization is indicated by the appearance of characteristic perinuclear punctae containing internalized receptors (arrows) as compared with no-stimulation control (t = 0 min). Confocal images (obtained at ×63 magnification) are representative of three independent experiments. B, receptor internalization assessed quantitatively by cell surface ELISA in MEFs, where trafficking is indicated by decrease in percent of surface receptor (with t = 0 set as 100%). Two-way analysis of variance revealed a significant effect of time (p < 0.001). C, comparison of internalization observed by cell surface ELISA following 10 min stimulation with NE and DMI at 10 μm, DMI at 1 μm, and the α2AR antagonist phentolamine (1 μm). DMI-induced internalization is indistinguishable at 10 and 1 μm, and no trafficking response was recorded for the antagonist. Data are mean ± S.E. and represent n = 8–12 replicates. *, p < 0.001 versus time 0.
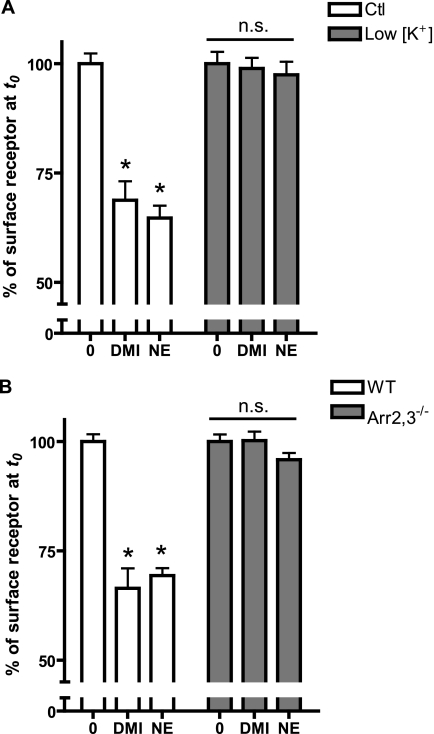
We sought to determine whether the DMI-driven internalization response occurred via the well described mode of endocytosis of GPCRs via clathrin-coated pits (52, 53). The use of a K+ depletion method, which has previously been shown to block formation of clathrin-coated pits (54), completely blocked receptor internalization measured by cell-surface ELISA in response to DMI and NE (Fig. 4A), confirming involvement of this endocytotic pathway.
FIGURE 4.
α2AAR internalization occurs via arrestin-dependent clathrin-mediated endocytosis. A, WT MEFs were exposed to either K+-depletion treatment (low [K+]), which blocks clathrin-coated pit-mediated endocytosis or control sham treatment (Ctl). Cells were stimulated for 30 min with 10 μm DMI or NE and the receptor internalization response was assayed by ELISA, with low [K+] cells exhibiting no trafficking response. B, receptor internalization was assessed by cell surface ELISA in arrestin2,3 double knock-out MEFs (Arr2,3−/−) and matched wild-type (WT) cells following 30 min stimulation with 10 μm DMI or NE. Trafficking response was completely lost in Arr2,3−/− cells. Data are mean ± S.E. and represent n = 8–12 replicates. *, p < 0.001 versus corresponding time 0.
Arrestins (arrestin2/3, also called β-arrestin1/2) are a critical mediator of endocytosis of GPCRs via clathrin-coated pits (55). To determine involvement of arrestins in DMI-induced α2AAR internalization, we performed ELISA in MEFs isolated from arrestin2/3 double knock-out mice (Arr2,3−/−) (56). Both DMI- and NE-stimulated trafficking responses, observed in WT cells, were completely lost in Arr2,3−/− cells (Fig. 4B), strongly suggesting that DMI drives α2AAR internalization via the classical arrestin- and clathrin-mediated endocytosis.
DMI Binding Induces Arrestin Recruitment to the α2AAR
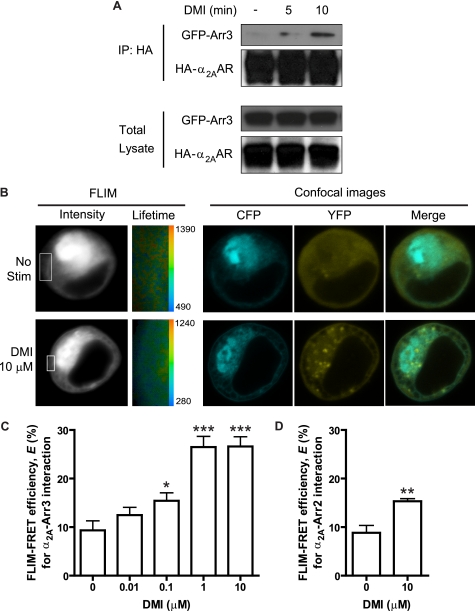
The above results suggest that DMI can stimulate the arrestin binding to the receptor necessary for the observed endocytosis. To directly test this, we performed a co-immunoprecipitation assay using HEK 293 cells coexpressing HA-α2AAR and GFP-arrestin3. Following stimulation with DMI for both 5 and 10 min, immunoisolation of HA-α2AAR lead to co-isolation of GFP-arrestin3 in the same complex (Fig. 5A), indicating that DMI binding is indeed able to drive arrestin recruitment to the receptor.
FIGURE 5.
DMI drives a dose-dependent interaction between the α2AAR and arrestin3. A, arrestin recruitment by the α2AAR is induced with DMI stimulation. Co-immunoprecipitation assay revealed complex formation between the receptor and arrestin3 following 5 and 10 min stimulation of HEK 293 cells with 10 μm DMI, with especially robust association at 10 min. Upper blots represent immunoprecipitated (IP) complexes, whereas lower blots represent total lysate, probed with anti-HA and anti-GFP antibodies to detect HA-α2AAR and GFP-arrestin3 (GFP-arr3), respectively. B, FLIM-FRET analysis provides further evidence for the arrestin-receptor interaction, indicated by increased FRET observed after stimulation of live HEK 293 cells (co-transfected with CFP-α2AAR and YFP-arrestin3) with DMI. Representative images are shown for unstimulated and 10 μm DMI (10 min) stimulated conditions. In FLIM images, intensity is represented in gray scale, with inset areas indicating cell surface and surface-proximal regions of interest selected for decay matrix analysis, resulting in the lifetime images (CFP lifetimes are represented in pseudocolors, with the range given in picoseconds). A single measurement point from the lifetime image at the cell surface corresponding to the fluorescence lifetime population of the donor generated a CFP lifetime value for each cell. Representative confocal images show the localization of CFP-α2AAR and YFP-arrestin3 in these cells. C, FLIM-FRET efficiency (E) values (mean ± S.E.) were calculated based on CFP lifetime values (see “Experimental Procedures”) and obtained over 5–6 cells from 2 to 3 different samples, either unstimulated or stimulated with DMI at the indicated concentrations (0.01–10 μm). D, FLIM-FRET (E) obtained for cells co-transfected with CFP-α2AAR and YFP-arrestin2, demonstrating a weaker (relative to arrestin3) but significant interaction following stimulation with 10 μm DMI. *, p < 0.05; **, p < 0.01; ***, p < 0.001 versus unstimulated (0).
To independently confirm and further investigate this DMI-stimulated arrestin recruitment, we utilized a FLIM-based FRET approach, which allowed us to observe the interaction in live HEK 293 cells and at the cell surface specifically. FRET is detectable in FLIM as a decrease in the donor (CFP) lifetime when the tagged proteins are interacting. Representative images obtained for unstimulated and stimulated (10 μm DMI, 10 min) cells are shown (Fig. 5B). FLIM-FRET efficiency is calculated using CFP lifetime values from a single measurement point at the cell surface. Dose-response analysis illustrated that DMI dose dependently induces the α2AAR-arrestin3 interaction, indicated by increased FLIM-FRET efficiency (Fig. 5C). Given that significant increases in FLIM-FRET efficiency begin at 0.1 μm, DMI is able to induce the α2AAR-arrestin3 over its entire therapeutic range (see Table 1). Confocal images (Fig. 5B) also illustrate a redistribution of arrestin3 from primarily diffuse to clear cell surface localization following DMI stimulation, providing further evidence of arrestin recruitment. Finally, DMI is able to induce interaction between the receptor and arrestin2, but to a much weaker degree than with arrestin3 (Fig. 5D).
DMI Alone Is Sufficient to Drive α2AAR Down-regulation
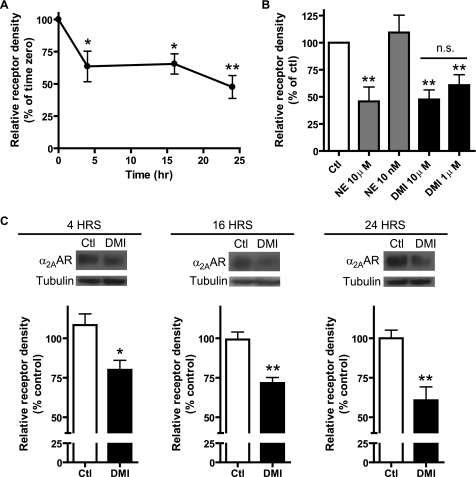
A more persistent and, with regard to the antidepressant effect, significant result of ligand-induced receptor trafficking is the down-regulation of receptor expression that can result from repeated or chronic stimulation (52, 53). Therefore, we next investigated whether long-term exposure to DMI would result in a down-regulation of α2AAR expression by treating MEF cells for 4, 16, or 24 h with 10 μm DMI. As shown in Fig. 6A, these treatments resulted in significant loss of overall receptor density, assessed by saturation radioligand binding, with a maximum effect of ∼50% down-regulation at 24 h. This effect is similar to that induced by NE at the same concentration (10 μm), and the therapeutically relevant level of DMI (1 μm) was also able to induce a comparable level of down-regulation (40–50%, Fig. 6B). Conversely, a physiologically relevant level of NE, 10 nm (corresponding to levels attained after chronic NE reuptake inhibition) (28, 57), failed to sustain any down-regulation response under our assay conditions (Fig. 6B). DMI-driven receptor down-regulation was further confirmed using an independent Western blot approach, which returned similar results (Fig. 6C).
FIGURE 6.
DMI alone is sufficient to drive down-regulation of α2AAR expression in MEFs. A, saturation radioligand binding demonstrated significant reductions in the receptor expression levels following 4, 16, and 24 h exposure to 10 μm DMI, with a maximum effect of ∼50% reduction at 24 h. Relative receptor density obtained by first normalizing to the sample protein content and then calculating the percent reduction from the corresponding control for each time point. B, comparison of receptor down-regulation observed following a 24-h exposure to different concentrations of DMI and NE, measured by saturation binding. Robust down-regulation was observed for 10 μm NE, 10 μm DMI, and 1 μm DMI, whereas no down-regulation was observed for 10 nm NE. C, receptor down-regulation driven by 10 μm DMI at 4, 16, and 24 h was independently confirmed by Western blot. Observed effects were ∼20, 30, and 40% loss of receptor density, closely resembling the saturation binding results. Blots (upper) and densitometry (lower) representing three independent experiments are shown. Data are mean ± S.E. and represent three independent experiments. *, p < 0.05; **, p < 0.01 versus time 0 (control); n.s., non-significant (p = 0.37).
DMI-driven Down-regulation Results in Reduced Signaling through the Receptor and Requires Arrestins
To assess if the DMI-driven α2AAR down-regulation has any consequences to cellular function, we developed a long-term DMI plus NE re-stimulation assay, outlined in Fig. 7A. Following exposure of cells to DMI for 4, 16, and 24 h (along with matched control-treated cells), re-stimulation with 10 μm NE for 5 min was performed to induce ERK1/2 signaling. Western blot revealed significantly diminished NE-stimulated ERK1/2 activation following long-term DMI treatments (Fig. 7, B–D), corresponding to the reductions in receptor expression levels observed in Fig. 6. NE-stimulated ERK1/2 activation in control-treated cells is similar to that shown in Fig. 2B, indicating that the long-term treatment protocol itself does not impact NE-α2AAR signaling. Note that DMI is not able to block NE-induced signaling when the two are given together at the same concentration (10 μm, Fig. 7E), therefore incomplete washout of DMI would not account for the observed reduction in signaling. Together, these results demonstrate that DMI alone drives a level of α2AAR down-regulation sufficient to impact cellular responsiveness to the endogenous agonist.
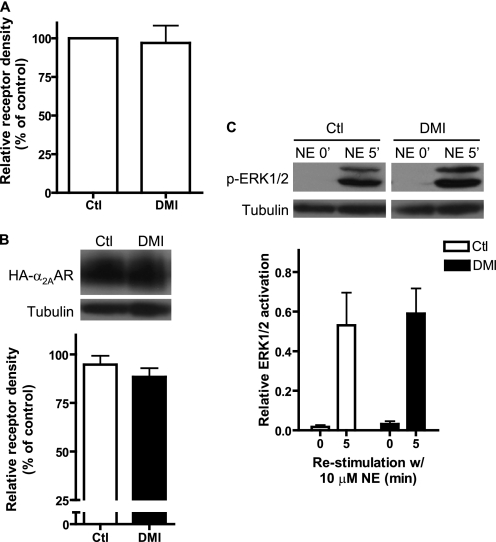
To confirm that the prolonged exposure-induced down-regulation response to DMI was arrestin-dependent as well, we repeated the above experiments with a 24-h 10 μm DMI treatment using the Arr2,3−/− MEFs. Both saturation binding (Fig. 8A) and Western blot (Fig. 8B) approaches confirmed that the α2AAR down-regulation response to DMI is lost with arrestin deficiency. Correspondingly, the reduction in NE-induced signaling after long-term DMI treatment was also lost in the Arr2,3−/− MEFs (Fig. 8C). These data demonstrate that the observed DMI-induced α2AAR down-regulation effects in vitro (Figs. 6 and 7) critically require arrestin.
FIGURE 8.
Down-regulation of α2AAR expression and signaling by DMI in vitro requires arrestins. Down-regulation experiments (24 h stimulation with 10 μm DMI) were repeated in Arr2,3−/− MEFs. A, saturation binding analysis showed that no down-regulation of receptor expression in response to DMI occurs in Arr2,3−/− cells. B, Western blot confirms that no receptor down-regulation occurs in Arr2,3−/− cells. C, endogenous agonist signaling through the receptor is unaffected in Arr2,3−/− cells following prolonged exposure to DMI. Data are mean ± S.E. and represent three independent experiments.
DMI Drives Internalization and Down-regulation of Endogenous α2AARs in Native Neurons
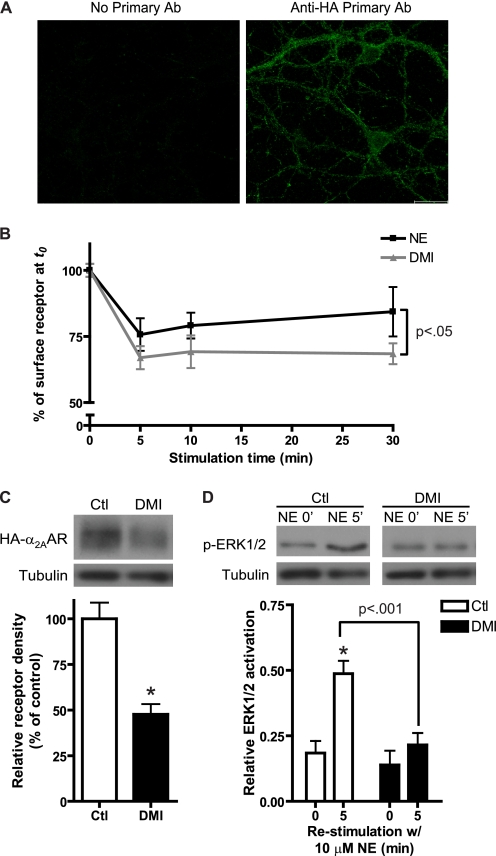
We next sought to determine whether the observed direct ligand effects of DMI at the α2AAR could be observed in native central neurons endogenously expressing the receptor. Using our previously generated HA-α2AAR knock-in mice (33), we prepared primary cultures of neurons from the PFC, a brain region that has been firmly implicated in the circuitry of mood disorders such as depression (5, 58). In addition, primary dissociated PFC cultures contain only non-noradrenergic cortical neurons, eliminating the potential confounds of endogenous NE production and NET expression. Expression of the α2AAR in cultured PFC neurons was confirmed by immunofluorescent staining, using anti-HA antibody to detect HA-α2AARs (Fig. 9A). By means of cell-surface ELISA, we observed acute α2AAR receptor internalization responses induced by both DMI and NE in neurons (Fig. 9B). We further exposed neurons to long-term DMI treatment (10 μm, 24 h), and found that DMI alone is indeed sufficient to drive down-regulation of receptor expression (Fig. 9B). When DMI-treated neurons were re-stimulated with NE, α2AAR-evoked ERK1/2 signaling was significantly reduced compared with control cells (Fig. 9C). These results confirm that DMI alone can directly drive down-regulation of endogenous α2AARs in native neurons.
FIGURE 9.
Direct ligand effects of DMI at the α2AAR can be observed in native neurons with endogenous receptor expression. A, immunofluorescent staining was used to confirm the expression of HA-α2AAR in PFC neurons cultured from HA-α2AAR knock-in mice. Confocal images of no primary antibody control (left) and neurons stained with anti-HA antibody (right) are shown. Scale bar = 20 μm. B, intact cell surface ELISA in primary PFC neurons revealed significant internalization in response to stimulation with 10 μm DMI or NE for the indicated times. Two-way analysis of variance revealed significant effects of time (p < 0.0001) and ligand (p < 0.05). C, Western blot confirmed that significant α2AAR down-regulation occurred in PFC neurons following 24 h exposure to 10 μm DMI. Representative blot (upper) and densitometry (lower) are shown. D, long-term DMI plus NE re-stimulation assay revealed the corresponding diminution in endogenous agonist-stimulated ERK1/2 activation in PFC neurons, as observed in MEFs. Representative blot (upper) and densitometry (lower) are shown. Data are mean ± S.E. and represent n = 4 to 5 independent samples. *, p < 0.01 versus time 0 (control).
DMI Drives Arrestin3-dependent Down-regulation of α2AARs in Vivo
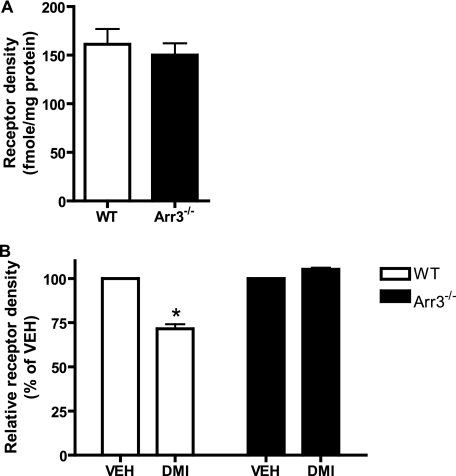
As a final step, we carried out whole animal prolonged administration of DMI using subcutaneous osmotic pumps in mice. Mice were exposed to DMI for 14 days at a dose (20 mg/kg/day) previously demonstrated to result in steady-state serum levels similar to clinical values (59). Crude synaptosomal fractions prepared from cortical brain tissue were subjected to saturation radioligand binding to determine α2AAR density. WT and Arr3−/− mice were found to have the same baseline receptor density (as measured in cortical synaptosomal fractions from vehicle-treated animals) (Fig. 10A). 14-day treatment with DMI led to a clear and significant reduction (∼25–30%) in α2AAR density in the WT mice, an effect that was completely lost in the Arr3−/− mice (Fig. 10B). Therefore, prolonged DMI exposure causes a significant loss of cortical synaptosomal α2AAR expression, and arrestin3 is crucially required for mediating this response in vivo.
FIGURE 10.
DMI drives arrestin-dependent down-regulation of cortical synaptosomal α2AARs in vivo. A, basal receptor density (in femtomoles, normalized to total protein content in milligrams) as measured by saturation radioligand binding in crude synaptosomal preparations from the cerebral cortex of vehicle-treated animals does not differ between WT and Arr3−/− mice (n = 4). B, 14 days exposure to DMI at 20 mg/kg/day (delivered by subcutaneous osmotic pump) results in significant loss of the cortical synaptosomal receptor expression level in WT mice. This response is completely abolished in arr3-deficient animals. Relative receptor density was expressed as a percentage of vehicle (set as 100%). Data are mean ± S.E. and represent n = 4 to 5 animals per group.
DISCUSSION
The tricyclic antidepressant DMI has long been associated with effects on the brain noradrenergic system, given its strong specificity for reuptake inhibition of NE over serotonin. In particular, it has been known to modulate expression levels of adrenergic receptors, an effect that likely contributes to its clinical therapeutic benefit. However, the mechanisms underlying such modulation remain largely unexplored. The present data have shown, for the first time, that DMI acts as an arrestin-biased ligand at the α2AAR whose binding leads to receptor internalization and down-regulation. Our competition binding analysis has revealed that DMI binds to the α2AAR with a similar intrinsic affinity and to the same orthosteric ligand binding site as the endogenous ligand NE. DMI binding fails to drive G protein activation, but does induce arrestin recruitment. Moreover, long-term exposure to DMI causes down-regulation of endogenous α2AAR expression and signaling in native neurons in vitro, and down-regulates synaptic expression of α2AARs in vivo in an arrestin3-dependent fashion. Therefore, these effects of DMI at the α2AAR support our hypothesis that direct regulation of the receptor by DMI makes beneficial contributions to the antidepressant mechanism of action through its arrestin-biased regulation of the receptor. As well, our data provide mechanistic insight into chronic antidepressant-induced alterations in α2AAR expression. However, whether such α2A adrenergic effects are possible for other structurally similar but functionally distinct drugs within the tricyclic class remains to be seen. Investigation of other tricyclic compounds with less specificity for the noradrenergic system is a goal of future studies.
Receptor Pharmacology of DMI at the α2AAR
Competition binding analysis revealed that DMI binds to the α2AAR with an affinity, as indicated by the Ki value, in the micromolar range (Fig. 1A), consistent with a previous report (10). Although the binding of DMI to NET occurs with a much higher affinity (nanomolar), a low micromolar value is nevertheless within the reported physiological therapeutic range of the drug (see Table 1). As well, the intrinsic affinity for DMI is essentially identical to that for the endogenous agonist NE (Fig. 1A and Table 1), which itself implies potential physiological relevance for the interaction. Our analysis has additionally determined that DMI binds to the same orthosteric site as classical ligands rather than a novel allosteric site (Fig. 1C). Such analysis was necessary as allosteric modifiers exhibiting negative cooperativity can appear as simple competitors in a single competition radioligand binding assay (41).
Our functional studies indicate that DMI drives neither coupling of heterotrimeric G proteins to the receptor nor downstream G protein-mediated signaling to ERK1/2 and Akt (Fig. 2) in both HEK293 cells and MEFs. However, DMI is able to induce an acute α2AAR trafficking response (Fig. 3). This functional profile distinguishes DMI from classical α2AAR ligands. As well, the binding of DMI to the orthosteric site on the α2AAR together with its failure to induce G protein coupling suggests that DMI may be able to antagonize NE-mediated signaling. The potential ability of DMI to serve as an α2AAR antagonist will clearly depend on its concentration relative to NE, given that DMI in combination with an equal amount of NE does not impact NE-stimulated ERK activation. In the physiological setting, DMI likely exists at levels 50–100-fold higher than NE (0.5–1 μm versus 10 nm). Additionally, our in vitro signaling assays cannot rule out the possibility that DMI may function differently with regard to α2AAR-mediated G protein activation in the endogenous physiological setting.
Arrestin-biased Regulation Leads to an Acute Receptor Trafficking Response and Subsequent Down-regulation
Arrestins are multifaceted regulators of GPCRs, not only mediating receptor desensitization but also serving as adaptors for receptor internalization and signaling (55, 60). The field has recently come to appreciate that certain GPCR ligands selectively activate arrestin-mediated functions without activating G proteins (61, 62). Such arrestin-biased agonism exposes an entirely new paradigm of GPCR function. Although not driving G protein coupling, DMI is able to stimulate recruitment of arrestin3 to the α2AAR as observed using two independent methods, co-immunoprecipitation and FLIM-FRET (Fig. 5). Thereby, DMI can be defined as an arrestin-biased ligand at the receptor. Our FLIM-FRET experiments have allowed us to demonstrate that DMI stimulation preferentially induces recruitment of arrestin3, although recruitment of arrestin2 is possible (Fig. 5D). As well, these observations in live cells show that DMI induces arrestin recruitment to the receptor, indicated by increased FRET efficiency at and physical redistribution of arrestin to the cell surface (Fig. 5, B and C). As well, we have shown that DMI drives the interaction dose dependently with effective doses covering the full range of clinical therapeutic levels of DMI (Fig. 5C).
To our knowledge, this is the first documented case of an arrestin-biased ligand at the α2AAR specifically. In this case, arrestin recruitment seems to primarily result in receptor endocytosis via the classical clathrin-coated pit pathway (Fig. 4). However, novel signaling mediated by arrestin cannot be ruled out at this time.
Significantly, our data modeling long-term treatment with DMI show that repeated exposures to this ligand result in down-regulation of receptor expression in vitro in MEFs (Fig. 6) and in native neurons (Fig. 9). This loss of receptor expression carries with it a functional consequence, namely a decrease in endogenous agonist-evoked signaling through the receptor (Figs. 7 and 9), which may translate into decreased inhibition of NE synthesis and release in vivo. DMI alone is sufficient to sustain the down-regulation response, and is significantly effective at the therapeutically relevant and Ki-proximal level of 1 μm (Table 1). In arrestin-deficient cells, both the loss of receptor expression and the decrease in NE-evoked α2AAR-mediated signaling are absent (Fig. 8), showing that these processes are dependent on arrestin.
Our in vivo experiments show that prolonged (14 days) exposure to a clinically relevant level of DMI (59) results in significant loss of synaptic α2AAR expression (Fig. 10) in WT animals. The complete loss of this response in arrestin3-deficient animals demonstrates the physiological importance of arrestin3 in mediating DMI-stimulated α2AAR down-regulation, and suggests that DMI-stimulated recruitment of arrestin2 to the α2AAR, whereas possible (Fig. 5D), is not sufficient to overcome the loss of arrestin3. Together, our findings illustrate a novel mechanism whereby DMI down-regulates neurotransmitter receptor-mediated responses via arrestin-biased regulation of the receptor, with arrestin3 specifically as the major player.
Therapeutic Implications of DMI as an α2AAR Ligand in the Antidepressant Mechanism
Beyond inhibition of reuptake, the antidepressant effect likely involves long-term adaptive neurobiological changes, a process suggested by the characteristic lag (3 weeks or more) between the start of antidepressant therapy and the onset of symptom relief (6). One such adaptive change may be alterations in expression of the α2AAR. Although studies of α2AAR density in clinical cases have in general tended to yield inconsistent results, likely because of difficulties and differences in methodology, studies involving suicide completers with diagnosed depression have consistently shown up-regulation of α2ARs in the brain (19–23). Correspondingly, chronic exposure to reuptake inhibitor antidepressants including DMI has been shown to decrease α2AR density (25–30). A mechanistic explanation for this phenomenon has been lacking, although it has been postulated to result from the actions of elevated NE levels in the brain. Experimental evidence suggests that synaptic concentrations of NE are basally around 1 nm, and approach 10 nm following treatment with reuptake inhibitors (28, 57, 63). However, the ability of such a physiological concentration of NE to affect receptor expression has not been shown. In fact, our data suggest that 10 nm NE is not sufficient to drive α2AAR down-regulation with long-term exposure (Fig. 6B), consistent with evidence from the NET knock-out model showing lack of α2AR down-regulation despite elevated extracellular NE levels (31, 32). Taken together, our results along with previous evidence suggest that this DMI-driven down-regulation response may in fact be necessary to attain the desired neuroadaptive changes to α2AAR expression.
Given the evidence outlined above, we strongly believe that the reductions in synaptic α2AAR expression we have observed in vivo are largely, if not exclusively, a result of direct DMI-driven down-regulation. However, a role for NE itself can only be definitively eliminated by combining long-term in vivo exposure to DMI with an NE depletion method (such as treatment with α-methyl tyrosine or reserpine) or by performing the experiment in the NET knock-out mouse model.
Our native neuronal cell model system has demonstrated that DMI directly down-regulates endogenously expressed α2A heteroreceptors in the absence of NE or NET (Fig. 9). In the case of arrestin-mediated receptor down-regulation, the process may proceed differently in presynaptic compared with postsynaptic compartments. Although arrestins are present in both (64), the postsynaptic compartment contains another player, spinophilin (65, 66), which has been shown to functionally antagonize arrestin actions at the α2AAR (49). Herein lies a potential explanation for previous evidence of differential regulation of terminal versus somatodendritic α2AAR expression by chronic antidepressant (28, 63, 67). As well, although heteroreceptors have certainly been implicated in the antidepressant response (18, 68), we have not been able to examine α2A autoreceptors specifically, which remains a goal of future studies.
Taken as a whole, our results indicate that DMI, through its orthosteric and arrestin-biased interaction with the α2AAR, drives down-regulation of receptor expression and signaling, an effect that likely makes an important and necessary contribution to its therapeutic antidepressant effects. We propose targeting of the α2AAR in this arrestin-biased fashion, selecting for receptor trafficking but not signaling, as a worthwhile therapeutic strategy moving forward.
Acknowledgments
We thank Shawn Williams and the University of Alabama at Birmingham High Resolution Imaging Facility for assistance with the FLIM-FRET experiments, Dr. Robert J. Lefkowitz (Duke University) for providing the Arr2,3−/− MEFs and the Arr3−/− mouse line, and Dr. Yin Peng for assistance in preparing the CFP- and YFP-tagged constructs.
This work was supported, in whole or in part, by National Institutes of Health Grant T32 NS061788-03 (to C. C.), Grant MH081917 from the National Institute of Mental Health (to Q. W.), and the University of Alabama at Birmingham Training Program in Neurobiology of Cognition and Cognitive Disorders.
C. Cottingham and Q. Wang, unpublished observation.
- DMI
- desipramine
- NE
- norepinephrine
- AR
- adrenergic receptor
- NET
- norepinephrine transporter
- MEF
- mouse embryonic fibroblast
- GTPγS
- guanosine 5′-O-(thio)triphosphate
- GPCR
- G protein-coupled receptor
- FLIM
- fluorescence lifetime imaging microscopy
- FRET
- fluorescence resonance energy transfer
- CFP
- cyan fluorescent protein
- YFP
- yellow fluorescent protein
- Gpp(NH)p
- 5′-guanylimidodiphosphate
- PFC
- prefrontal cortex.
REFERENCES
- 1. Kessler R. C., Berglund P., Demler O., Jin R., Koretz D., Merikangas K. R., Rush A. J., Walters E. E., Wang P. S. (2003) JAMA 289, 3095–3105 [DOI] [PubMed] [Google Scholar]
- 2. Belmaker R. H., Agam G. (2008) N. Engl. J. Med. 358, 55–68 [DOI] [PubMed] [Google Scholar]
- 3. Cherry D. K., Hing E., Woodwell D. A., Rechsteiner E. A. (2008) Natl. Health Stat. Report 3, 1–39 [PubMed] [Google Scholar]
- 4. Turner E. H., Matthews A. M., Linardatos E., Tell R. A., Rosenthal R. (2008) N. Engl. J. Med. 358, 252–260 [DOI] [PubMed] [Google Scholar]
- 5. Krishnan V., Nestler E. J. (2008) Nature 455, 894–902 [DOI] [PMC free article] [PubMed] [Google Scholar]
- 6. Baldessarini R. J. (2001) in Goodman & Gilman's The Pharmacological Basis of Therapeutics (Hardman J. G., Limbird L. E., Gilman A. G. eds) pp. 447–483, McGraw-Hill, Inc., New York [Google Scholar]
- 7. Dziedzicka-Wasylewska M., Faron-Górecka A., Kuśmider M., Drozdowska E., Rogóz Z., Siwanowicz J., Caron M. G., Bönisch H. (2006) Neuropsychopharmacology 31, 2424–2432 [DOI] [PubMed] [Google Scholar]
- 8. Wong D. T., Threlkeld P. G., Best K. L., Bymaster F. P. (1982) J. Pharmacol. Exp. Ther. 222, 61–65 [PubMed] [Google Scholar]
- 9. Richelson E., Nelson A. (1984) J. Pharmacol. Exp. Ther. 230, 94–102 [PubMed] [Google Scholar]
- 10. Deupree J. D., Montgomery M. D., Bylund D. B. (2007) Eur. J. Pharmacol. 576, 55–60 [DOI] [PMC free article] [PubMed] [Google Scholar]
- 11. De Vos H., Vauquelin G., De Keyser J., De Backer J. P., Van Liefde I. (1992) J. Neurochem. 58, 1555–1560 [DOI] [PubMed] [Google Scholar]
- 12. Sastre M., García-Sevilla J. A. (1994) J. Neurochem. 63, 1077–1085 [DOI] [PubMed] [Google Scholar]
- 13. Wang R., Macmillan L. B., Fremeau R. T., Jr., Magnuson M. A., Lindner J., Limbird L. E. (1996) Neuroscience 74, 199–218 [DOI] [PubMed] [Google Scholar]
- 14. Hein L., Altman J. D., Kobilka B. K. (1999) Nature 402, 181–184 [DOI] [PubMed] [Google Scholar]
- 15. Knaus A. E., Muthig V., Schickinger S., Moura E., Beetz N., Gilsbach R., Hein L. (2007) Neurochem. Int. 51, 277–281 [DOI] [PubMed] [Google Scholar]
- 16. Gilsbach R., Röser C., Beetz N., Brede M., Hadamek K., Haubold M., Leemhuis J., Philipp M., Schneider J., Urbanski M., Szabo B., Weinshenker D., Hein L. (2009) Mol. Pharmacol. 75, 1160–1170 [DOI] [PubMed] [Google Scholar]
- 17. Shields A. D., Wang Q., Winder D. G. (2009) Neuroscience 163, 339–351 [DOI] [PMC free article] [PubMed] [Google Scholar]
- 18. Yanpallewar S. U., Fernandes K., Marathe S. V., Vadodaria K. C., Jhaveri D., Rommelfanger K., Ladiwala U., Jha S., Muthig V., Hein L., Bartlett P., Weinshenker D., Vaidya V. A. (2010) J. Neurosci. 30, 1096–1109 [DOI] [PMC free article] [PubMed] [Google Scholar]
- 19. Meana J. J., Barturen F., García-Sevilla J. A. (1992) Biol. Psychiatry 31, 471–490 [DOI] [PubMed] [Google Scholar]
- 20. Callado L. F., Meana J. J., Grijalba B., Pazos A., Sastre M., García-Sevilla J. A. (1998) J. Neurochem. 70, 1114–1123 [DOI] [PubMed] [Google Scholar]
- 21. García-Sevilla J. A., Escribá P. V., Ozaita A., La Harpe R., Walzer C., Eytan A., Guimón J. (1999) J. Neurochem. 72, 282–291 [DOI] [PubMed] [Google Scholar]
- 22. Ordway G. A., Schenk J., Stockmeier C. A., May W., Klimek V. (2003) Biol. Psychiatry 53, 315–323 [DOI] [PubMed] [Google Scholar]
- 23. Escribá P. V., Ozaita A., García-Sevilla J. A. (2004) Neuropsychopharmacology 29, 1512–1521 [DOI] [PubMed] [Google Scholar]
- 24. González-Maeso J., Rodríguez-Puertas R., Meana J. J., García-Sevilla J. A., Guimón J. (2002) Mol. Psychiatry 7, 755–767 [DOI] [PubMed] [Google Scholar]
- 25. Giralt M. T., García-Sevilla J. A. (1989) Eur. J. Pharmacol. 164, 455–466 [DOI] [PubMed] [Google Scholar]
- 26. Barturen F., Garcia-Sevilla J. A. (1992) Mol. Pharmacol. 42, 846–855 [PubMed] [Google Scholar]
- 27. Mongeau R., de Montigny C., Blier P. (1994) Neuropsychopharmacology 10, 41–51 [DOI] [PubMed] [Google Scholar]
- 28. Mateo Y., Fernández-Pastor B., Meana J. J. (2001) Br. J. Pharmacol. 133, 1362–1370 [DOI] [PMC free article] [PubMed] [Google Scholar]
- 29. Subhash M. N., Nagaraja M. R., Sharada S., Vinod K. Y. (2003) Neurochem. Int. 43, 603–609 [DOI] [PubMed] [Google Scholar]
- 30. De Paermentier F., Mauger J. M., Lowther S., Crompton M. R., Katona C. L., Horton R. W. (1997) Brain Res. 757, 60–68 [DOI] [PubMed] [Google Scholar]
- 31. Gilsbach R., Faron-Górecka A., Rogóz Z., Brüss M., Caron M. G., Dziedzicka-Wasylewska M., Bönisch H. (2006) J. Neurochem. 96, 1111–1120 [DOI] [PubMed] [Google Scholar]
- 32. Xu F., Gainetdinov R. R., Wetsel W. C., Jones S. R., Bohn L. M., Miller G. W., Wang Y. M., Caron M. G. (2000) Nat. Neurosci. 3, 465–471 [DOI] [PubMed] [Google Scholar]
- 33. Lu R., Li Y., Zhang Y., Chen Y., Shields A. D., Winder D. G., Angelotti T., Jiao K., Limbird L. E., Zhou Y., Wang Q. (2009) J. Biol. Chem. 284, 13233–13243 [DOI] [PMC free article] [PubMed] [Google Scholar]
- 34. Bohn L. M., Lefkowitz R. J., Gainetdinov R. R., Peppel K., Caron M. G., Lin F. T. (1999) Science 286, 2495–2498 [DOI] [PubMed] [Google Scholar]
- 35. Schramm N. L., Limbird L. E. (1999) J. Biol. Chem. 274, 24935–24940 [DOI] [PubMed] [Google Scholar]
- 36. Brady A. E., Wang Q., Allen P. B., Rizzo M., Greengard P., Limbird L. E. (2005) Mol. Pharmacol. 67, 1690–1696 [DOI] [PubMed] [Google Scholar]
- 37. MacMillan L. B., Hein L., Smith M. S., Piascik M. T., Limbird L. E. (1996) Science 273, 801–803 [DOI] [PubMed] [Google Scholar]
- 38. Cheng Y., Prusoff W. H. (1973) Biochem. Pharmacol. 22, 3099–3108 [DOI] [PubMed] [Google Scholar]
- 39. Chou T. (1974) Mol. Pharmacol. 10, 235–247 [PubMed] [Google Scholar]
- 40. Alexander S. P., Mathie A., Peters J. A. (2001) Trends Pharmacol. Sci. Nomenclature Suppl. 12, 15–18 [Google Scholar]
- 41. Limbird L. E. (2005) Cell Surface Receptors: A Short Course on Theory and Methods, 3rd Ed., Springer Science+Business Media, Inc., New York [Google Scholar]
- 42. Lu R., Chen Y., Cottingham C., Peng N., Jiao K., Limbird L. E., Wyss J. M., Wang Q. (2010) Mol. Pharmacol. 78, 279–286 [DOI] [PMC free article] [PubMed] [Google Scholar]
- 43. Tan C. M., Wilson M. H., MacMillan L. B., Kobilka B. K., Limbird L. E. (2002) Proc. Natl. Acad. Sci. U.S.A. 99, 12471–12476 [DOI] [PMC free article] [PubMed] [Google Scholar]
- 44. Brady A. E., Wang Q., Colbran R. J., Allen P. B., Greengard P., Limbird L. E. (2003) J. Biol. Chem. 278, 32405–32412 [DOI] [PubMed] [Google Scholar]
- 45. Xu J., Chen Y., Lu R., Cottingham C., Jiao K., Wang Q. (2008) J. Biol. Chem. 283, 14516–14523 [DOI] [PubMed] [Google Scholar]
- 46. Wang Q., Lu R., Zhao J., Limbird L. E. (2006) J. Biol. Chem. 281, 25948–25955 [DOI] [PubMed] [Google Scholar]
- 47. Wang Q., Limbird L. E. (2002) J. Biol. Chem. 277, 50589–50596 [DOI] [PubMed] [Google Scholar]
- 48. Lakowicz J. R. (1999) Principles of Fluorescence Spectroscopy, 2nd Ed., Plenum Press, New York [Google Scholar]
- 49. Wang Q., Zhao J., Brady A. E., Feng J., Allen P. B., Lefkowitz R. J., Greengard P., Limbird L. E. (2004) Science 304, 1940–1944 [DOI] [PubMed] [Google Scholar]
- 50. Glotzbach R. K., Preskorn S. H. (1982) Psychopharmacology 78, 25–27 [DOI] [PubMed] [Google Scholar]
- 51. Murga C., Laguinge L., Wetzker R., Cuadrado A., Gutkind J. S. (1998) J. Biol. Chem. 273, 19080–19085 [DOI] [PubMed] [Google Scholar]
- 52. Tan C. M., Brady A. E., Nickols H. H., Wang Q., Limbird L. E. (2004) Annu. Rev. Pharmacol. Toxicol. 44, 559–609 [DOI] [PubMed] [Google Scholar]
- 53. Hanyaloglu A. C., von Zastrow M. (2008) Annu. Rev. Pharmacol. Toxicol. 48, 537–568 [DOI] [PubMed] [Google Scholar]
- 54. Larkin J. M., Brown M. S., Goldstein J. L., Anderson R. G. (1983) Cell 33, 273–285 [DOI] [PubMed] [Google Scholar]
- 55. Shenoy S. K., Lefkowitz R. J. (2003) Biochem. J. 375, 503–515 [DOI] [PMC free article] [PubMed] [Google Scholar]
- 56. Kohout T. A., Lin F. S., Perry S. J., Conner D. A., Lefkowitz R. J. (2001) Proc. Natl. Acad. Sci. U.S.A. 98, 1601–1606 [DOI] [PMC free article] [PubMed] [Google Scholar]
- 57. Mateo Y., Pineda J., Meana J. J. (1998) J. Neurochem. 71, 790–798 [DOI] [PubMed] [Google Scholar]
- 58. Krishnan V., Nestler E. J. (2010) Am. J. Psychiatry 167, 1305–1320 [DOI] [PMC free article] [PubMed] [Google Scholar]
- 59. Ahern T. H., Javors M. A., Eagles D. A., Martillotti J., Mitchell H. A., Liles L. C., Weinshenker D. (2006) Neuropsychopharmacology 31, 730–738 [DOI] [PubMed] [Google Scholar]
- 60. DeWire S. M., Ahn S., Lefkowitz R. J., Shenoy S. K. (2007) Annu. Rev. Physiol. 69, 483–510 [DOI] [PubMed] [Google Scholar]
- 61. Violin J. D., Lefkowitz R. J. (2007) Trends Pharmacol. Sci. 28, 416–422 [DOI] [PubMed] [Google Scholar]
- 62. Rajagopal S., Rajagopal K., Lefkowitz R. J. (2010) Nat. Rev. Drug Discov. 9, 373–386 [DOI] [PMC free article] [PubMed] [Google Scholar]
- 63. Parini S., Renoldi G., Battaglia A., Invernizzi R. W. (2005) Neuropsychopharmacology 30, 1048–1055 [DOI] [PubMed] [Google Scholar]
- 64. Attramadal H., Arriza J. L., Aoki C., Dawson T. M., Codina J., Kwatra M. M., Snyder S. H., Caron M. G., Lefkowitz R. J. (1992) J. Biol. Chem. 267, 17882–17890 [PubMed] [Google Scholar]
- 65. Allen P. B., Ouimet C. C., Greengard P. (1997) Proc. Natl. Acad. Sci. U.S.A. 94, 9956–9961 [DOI] [PMC free article] [PubMed] [Google Scholar]
- 66. Ouimet C. C., Katona I., Allen P., Freund T. F., Greengard P. (2004) J. Comp. Neurol. 479, 374–388 [DOI] [PubMed] [Google Scholar]
- 67. Sacchetti G., Bernini M., Gobbi M., Parini S., Pirona L., Mennini T., Samanin R. (2001) Naunyn Schmiedebergs Arch. Pharmacol. 363, 66–72 [DOI] [PubMed] [Google Scholar]
- 68. Esteban S., Lladó J., Sastre-Coll A., García-Sevilla J. A. (1999) Naunyn Schmiedebergs Arch. Pharmacol. 360, 135–143 [DOI] [PubMed] [Google Scholar]
- 69. Baldessarini R. J. (1989) J. Clin. Psychiatry 50, 117–126 [PubMed] [Google Scholar]


