

Abstract
Diffusion tensor imaging (DTI) is a powerful and noninvasive imaging method for characterizing tissue microstructure and white matter organization in the brain. While it has been applied extensively in research studies of the human brain, DTI studies of non-human primates have been performed only recently. The growing application of DTI in rhesus monkey studies would significantly benefit from a standardized framework to compare findings across different studies. A very common strategy for image analysis is to spatially normalize (co-register) the individual scans to a representative template space. This paper presents the development of a DTI brain template, UWRMAC-DTI271, for adolescent Rhesus Macaque (Macaca mulatta) monkeys. The template was generated from 271 rhesus monkeys, collected as part of a unique brain imaging genetics study. It is the largest number of animals ever used to generate a computational brain template, which enables the generation of a template that has high image quality and accounts for variability in the species. The quality of the template is further ensured with the use of DTI-TK, a well-tested and high-performance DTI spatial normalization method in human studies. We demonstrated its efficacy in monkey studies for the first time by comparing it to other commonly used scalar-methods for DTI normalization. It is anticipated that this template will play an important role in facilitating cross-site voxelwise DTI analyses in rhesus macaques. Such analyses are crucial in investigating the role of white matter structure in brain function, development, and other psychopathological disorders for which there are well-validated non-human primate models.
1. Introduction
The Rhesus Macaque (Macaca mulatta) is one of the most widely studied non-human primate species. This species has strong similarities to humans in terms of physiology and anatomy. It is the second non-human primate species to have its full genome sequenced (Gibbs et al., 2007), making it attractive for genetic studies. The rhesus has been widely used to study neuroanatomy, neurobiology, neurological and psychiatric illnesses, behavior and social interactions. In particular, the well-developed prefrontal cortex of the rhesus monkey makes it a unique model to study the brain systems implicated in psychopathology (Kalin and Shelton, 2003; Nelson and Winslow, 2009). Moreover, humans and rhesus monkeys share a prolonged period of brain development during childhood and adolescence, which is a critical period for the study of developmental psychopathology. For these reasons, the rhesus monkey is an ideal candidate for studies of brain and behavior relationships across development. Accordingly, noninvasive measurements of the rhesus monkey brain using magnetic resonance imaging (MRI) have been used for nearly 25 years (Chiro et al., 1985). Monkey brain atlases based upon post-mortem histological slices have been developed and made available to the research community (Martin and Bowden, 1996; Paxinos et al., 2009). Only recently has a computational rhesus brain template based upon T1-weighted structural MRI scans been described and made available (McLaren et al., 2009). However, T1-weighted templates alone do not provide accurate localization of white matter regions.
Diffusion tensor imaging (DTI) (Basser et al., 1994) is an exquisitely sensitive method to non-invasively map and characterize the microstructural properties and macroscopic organization of brain white matter (WM) tissues (Jones et al., 1999; Mori et al., 2002). Measurements of water diffusion are highly sensitive to and modulated by changes in brain tissue microstructural elements such as myelin, cellular density, cellular membranes, the cytoskeleton and mitochondria. In WM, which consists of packed axon fibers, the diffusion of water is anisotropic i.e. directionally dependent because the movement of water molecules perpendicular to the axon fibers is more hindered than in the parallel direction. The diffusion tensor is a positive-definite, rank-2 tensor matrix that describes the covariance of water diffusion in the three orthogonal Cartesian directions. From the diffusion tensor one can obtain maps of the diffusion tensor trace, eigenvalues, anisotropy and orientation (Basser and Pierpaoli, 1996). The fractional anisotropy (FA), the most commonly used measure of diffusion anisotropy, is a normalized standard deviation of the eigenvalues that ranges between 0 and 1. The higher the value the more organized (in a primary direction) the WM in that voxel. The trace of the diffusion tensor (TR) is the sum of the three eigenvalues and indicates the total amount of diffusivity in that voxel. It is inversely related to the microstructural density. The axial diffusivity (also known as longitudinal or parallel diffusivity) is the first eigenvalue of the tensor. This measure indicates the amount of diffusion in the primary direction of the WM organization. The radial diffusivity (also known as the transverse or perpendicular diffusivity) is the mean of the second and third eigenvalues. The diffusivities are indicative of the restrictedness of the tissue. These DTI measures have been used to characterize differences in brain microstructure for a broad spectrum of disease processes (e.g., demyelination, edema, inflammation, neoplasia), injury, disorders, brain development and aging, and response to therapy (see Alexander et al., 2007 for a review). The directional diffusion information has been used to estimate and reconstruct the trajectories of WM fiber bundles using tractography (Conturo et al., 1999; Mori et al., 1999; Hofer et al., 2008).
The application of DTI in rhesus monkey research is rapidly growing. DTI has been used in rhesus populations to study brain changes associated with aging (Makris et al., 2007; Bendlin et al., 2010), lesions (Shamy et al., 2010) and neuro-degeneration (Guo et al., 2011). Tractography methods have also been used to reconstruct estimates of white matter pathways (Schmahmann et al., 2007; Hofer et al., 2008; Liu et al., 2009). While several of these DTI studies in monkeys used voxel-based methods (Makris et al., 2007; Bendlin et al., 2010), to our best knowledge, DTI templates for rhesus monkeys are not publicly available. The creation of a standard space DTI template would facilitate the comparison and integration of research studies (Salimi-Khorshidia et al., 2009). To date, most published DTI studies in monkeys with voxel-based analysis have used intensity-based normalization with low to moderate dimensional registration methods (Guo et al., 2011; Makris et al., 2007; Bendlin et al., 2010; Willette et al., 2010; Shamy et al., 2010).
Voxel-based DTI studies in monkeys would benefit from the development of standardized DTI templates similar to human DTI templates (Mori et al., 2008; Zhang et al., 2011). A standardized DTI template may allow for use of tensor-based spatial normalization of the study subjects, which can improve the detection of WM differences in studying WM related pathology (Zhang et al., 2007b; Wang et al. 2011; Van Hecke et al. 2011). Tensor-based spatial normalization benefits from the rich information and heterogeneity of the DTI measurements with anatomy; however, the process of registering full tensor images is technically more complex than with scalar images. Full tensor spatial normalization requires reorientation of the diffusion tensor with the local deformation, while preserving the tensor shapes (Alexander et al., 2001). It has also been shown in human studies that the full diffusion tensor yields the most consistent spatial normalization across subjects (Park et al., 2003).
The purpose of this work was to develop, evaluate and optimize an approach for generating a population-averaged DTI brain template in nonhuman primates. These techniques were used to construct a high quality DTI brain template from 271 young Rhesus Macaques. We also present experimental evidence for using a high-dimensional, tensor-based, image registration technique in the population specific DTI template generation for non-human primates. Such a template can represent an unbiased mean of the large sample to describe the average structural shape, organization and diffusion properties of white matter in young rhesus population (Joshi et al. 2004; Zhang et al. 2007a). The DTI brain template may be used to facilitate whole brain (Smith et al., 2006) and tract-specific analyses (Yushkevich et al., 2008; Zhang et al., 2010). The development of a representative DTI template is also important for the generation of a detailed brain atlas. The template and tractography based reconstructions of five representative WM pathways are made publicly available at http://www.nitrc.org/projects/rmdtitemplate/.
The remainder of the paper is organized as follows: In section 2 we describe the image acquisition, pre-processing, and framework for DTI template construction using DTI-TK. Evaluation measures for comparison of normalization strategies are also described to demonstrate the efficacy of DTI-TK for non-human primates. Section 3 describes results of the comparison of normalization strategies and the details of the final DTI template. In section 4 the potential applications and limitations of our template are discussed.
2. Material and Methods
2.1 Subjects, Data Acquisition and Image Pre-processing
The data were acquired as part of a unique brain imaging genetics study of young nonhuman primates. 271 young rhesus macaques in the age-range of 0.7370 to 4.2027 years with mean age of 2.4011±0.8795 years were scanned. All studies were performed using protocols approved by the University of Wisconsin Institutional Animal Care and Use Committee (IACUC). Before undergoing MRI acquisition, the monkeys were anesthetized with an intramuscular injection of ketamine (15 mg/kg). MRI scanning was performed using a GE SIGNA 3T scanner with a 16 cm diameter quadrature birdcage coil and the head was fixed in the sphinx position using a custom stereotaxic frame that fit inside the coil. DTI scanning was performed using a two-dimensional, echo-planar, diffusion-weighted, spin-echo sequence with the following parameters: repetition time=10s; echo time=77.2 ms; field of view=14 cm; matrix=128×128 (interpolated to 256×256 on the scanner); 2.5 mm thick contiguous slices; echo-planar echo spacing=800 μs. Diffusion-weighted imaging (b=1000s/mm2) was performed in 12 non-collinear directions with one non-diffusion weighted image and the acquisition was repeated six times and averaged. Images were acquired in the coronal plane through the entire monkey brain. A co-planar field map was also obtained using a gradient echo with images at two echo times: TE1=7 ms, TE2=10 ms.
The DWI volumes were eddy-current corrected using FSL (Smith et al., 2004). Echo-planar distortions were corrected using a field mapping procedure (Jezzard et al., 2005), which was based upon the fugue and prelude functions in FSL before performing a non-linear tensor estimation (Alexander and Barker, 2005). The brain tissue was carefully extracted for each subject using a rigorous semi-automatic protocol. We first evaluated two popular brain extraction methods (AFNI’s 3DSkullStrip, FSL’s BET) on a randomly selected subset of 40 volumes (Smith et al., 2002; Smith et al., 2004). 3DSkullStrip performed better according to dice similarity coefficient (Bartosic et al., 2010) and hence it was used for all the 271 subjects. The final masks were then carefully checked and manually adjusted.
2.2 Template construction
A primary challenge in generating a population specific template is spatial normalization, which involves registering (aligning) each individual subject’s image to the others. Spatial normalization of groups of DTI data acquired from different subjects enables accurate mapping of characteristics of the diffusion tensor, such as the diffusivities, anisotropy and orientation within these images.
In this study, the template is constructed using DTI-TK, an advanced DTI spatial normalization and atlas construction tool (http://www.nitrc.org/projects/dtitk). It constructs a template in an unbiased way that captures both the average diffusion features (e.g. diffusivities and FA) and anatomical shape features (tract size) in the population (Zhang et al., 2007a). It performs white matter alignment using a non-parametric, highly deformable, diffeomorphic (topology preserving) registration method (Zhang et al., 2007b) that incrementally estimates its displacement field using a tensor-based registration formulation (Zhang et al., 2006). The tensor-based formulation perform alignment of white matter by taking advantage of similarity measures comparing whole tensors via explicit optimization of tensor reorientation (Alexander et al, 2001, Alexander and Gee, 2000a, Alexander and Gee, 2000b). By computing image similarity on the basis of full tensor images rather than scalar features, the algorithm incorporates local fiber orientations as features to drive the alignment of individual WM tracts. Using full-tensor information as a similarity metric for non-linear warping has been shown to be effective in spatially normalizing tract morphology and tensor orientation (Park et al., 2003, Zhang et al. 2007b).
These combined steps are used to generate a representative rhesus monkey DTI brain template, which can facilitate accurate comparisons of white matter microstructure and brain connectivity across populations. The initial average template is computed as a Log-Euclidean mean of the input DT images (Arsigny et al., 2006). The Log-Euclidean tensor averaging preserves white matter orientation with minimal blurring. The average DTI template is then iteratively optimized by registering the subject images to the current average, and computing a refined average as the mean of the normalized images for the next iteration. This procedure is repeated until the average image converges. The resulting template is unbiased towards any single subject and captures the average diffusion properties of the population at each voxel with a diffusion tensor. Subsequently, the template is “shape-corrected” to ensure that it also represents the average shape of the population (Guimond et al., 2000). This is achieved by first computing an average of the deformation fields that warp each subject into alignment with the template, then warping the template with the inverse of the average deformation field. The overall schematic of the processing pipeline is shown in Fig. 1. Since the brain size of NHP is significantly smaller than that of humans, the scaling parameters in the optimization were adjusted to match the size of the macaque brain. The length scale for humans in computing the piecewise affine deformation field is 1.0 mm while that for monkeys is 0.4 mm. Our DTI template, UWRMAC-DTI271, was generated using the set of DTI data from n=271 monkeys.
Figure 1.

The pipeline for generating the template: After the data are acquired, the DWI images are corrected for eddy current distortions and field in-homogeneities. Then, brain tissue is extracted from the images so further processing is done only on the relevant regions of the images. Tensors are estimated by non-linear optimization. An initial bootstrap template is then computed using the Log-Euclidean mean approach. Finally, the bootstrap template is iteratively improved using three layers: rigid registration, then affine registration and lastly by diffeomorphic registration.
2.3 Efficacy of DTI-TK for non-human primates
The quality of a template is dependent on the anatomical consistency of the normalized images used to generate the template which in turn depends on efficacy of the registration method used. DTI-TK has previously generated very high quality DTI templates in human studies, both for adults (Zhang et al., 2007b; Zhang et al., 2011) and infants (Wang et al., 2011). But its efficacy was not examined in the context of NHP. Hence we demonstrate the effectiveness of DTI-TK, a high-dimensional tensor-based normalization method in comparison to three other commonly used intensity-based normalization strategies for monkey data. We believe such comparisons for non-human primate data can serve a valuable purpose for DTI studies in monkeys. The three other approaches use FA, co-registered FA and T1-weighted images, and co-registered b=0 (T2-weighted) and T1-weighted images from the DTI study. We will refer to as (1) FA-ANTS, (2) FA-T1 and (3) B0-T1, respectively. All the three intensity-based registration methods use a publicly available state-of-the-art intensity-based normalization software suite called Advanced Normalization Tools (ANTS) (Avants et al., 2008, Avants et al., 2006, Avants et al., 2004), which uses diffeomorphic transformations similar to DTI-TK. For both DTI-TK and ANTS we use the default setup of parameters for the diffeomorphic transformations recommened in the online documentation. For ANTS we use the recommended symmetric diffeomorphic mapping (SyN).
FA-ANTS refers to FA-based normalization using ANTS. In this method the individual FA maps are first aligned to the FA of the template (obtained from DTI-TK). ANTS has been demonstrated to be among the most accurate intensity-based normalization method among fourteen different methods (Klein et al., 2009). The estimated transformations are then applied to the individual DTI data. Finally, tensors are reoriented to obtain the tensors in the template space.
FA-T1 and B0-T1 are both T1-based normalization approaches but use different intra-subject registration techniques to map the diffusion data onto T1 space (i.e. FA to T1, B0 to T1). First, the individual FA or B0 maps are aligned to their corresponding T1-weighted images using affine registration. The T1-weighted images are then aligned to a population specific T1 template (Oler et al., 2010) again using ANTS. These transformations are then applied to the individual DTI data by reorienting the tensors as in FA-ANTS.
Although the tensors were reoriented in all the above approaches using an identical state-of-the-art preservation of principle directions (PPD) scheme (Alexander et al., 2001), the key difference between those approaches and DTI-TK is that the tensor reorientation also plays an integral part in estimating the transformations in DTI-TK (Zhang et al., 2006), using a computationally efficient “finite-strain” strategy (Alexander et al., 2001).
2.3.1 Evaluation metrics
The efficacy of a DTI registration method may be measured by the accuracy of the WM alignment. The four registration methods were compared using several metrics (Zhang et al., 2007b, Zhang et al., 2011) that are described below. The brain alignment performance was first evaluated using a subset of n=30 monkeys (called DTI30) for higher computational efficiency relative to the full sample. The following metrics are used to investigate the spatial variance and consistency of the scalar, directional and entire matrix information in the diffusion tensor.
Normalized standard deviation and dyadic coherence
The diffusion anisotropy and the dominant direction of diffusion are two features that account for much of the variations in WM structures (Pierpaoli et al., 1996). Misalignment of WM structures yields large voxelwise variations in either one or both of these features. Therefore, the normalized standard deviation of the FA and the dyadic coherence (Jones et al., 2002) were selected as voxelwise statistics to gauge the normalization quality. The normalized standard deviation of FA, σ̄FA, is defined as the ratio of the standard deviation over the mean of the FA values. The Dyadic coherence, κ, which ranges from 0 to 1 (0 for randomly oriented directions and 1 for identically oriented directions), captures the variability in the dominant direction of diffusion. We calculated σ̄FA and κ at each voxel within the WM regions of the DTI30 templates for all the four methods. We also computed normalized standard deviation of the tensor trace (TR), similar to σ̄FA.
Cross correlations of diffusion measures
Cross correlation between two scalar maps X1 and X2 is computed as
where υ indexes over all the voxels. This value ranges between 0 and 1. The higher the cross correlation, the higher the similarity between two maps. We computed the cross correlations of the WM voxels between the DTI30 subjects and the corresponding template for each of the four normalization methods using both fractional anisotropy (FA) and trace (TR) of the tensors.
Overlap of eigenvalue-eigenvector pairs (OVL)
Eigenvalues and eigenvectors contain complementary information, which together specify the size, shape, and orientation of the diffusion tensor ellipsoid that characterizes diffusion (Basser and Pajevic, 2000). The OVL between two tensors is computed as:
where λ, ε and λ′, ε′ are the eigenvalue-eigenvector pairs of the two tensors respectively. A higher average OVL indicates that the method generates more consistently normalized subjects. The OVL of the WM voxels between DTI30 subjects and the corresponding templates for each of the four normalization methods was computed.
Distances between diffusion tensors
The two distances between diffusion tensors (Zhang et al., 2006) are (a) the Euclidean distance (ED) defined as:
and (b) the deviatoric distance (DD) which is the Euclidean distance between the corresponding deviatoric tensors that takes into account the anisotropic component of the tensors defined as:
Lower tensor distances suggest better accuracy in WM alignment. We computed the above two distances between WM voxels of the DTI30 subjects and the corresponding templates of the four normalization methods.
Statistical comparisons of the four methods were performed with the same white matter mask for all the registration methods. DTI-TK and FA-ANTS already share a same white matter mask. The template FAs of FA-T1, B0-T1 are mapped on to the DTI-TK space, using FSL’s linear image registration tool (FLIRT) (Smith et al., 2004). This removes the size of the white matter mask as a confounding factor in the performance comparison. The set of white matter voxels was defined as those having FA >= 0.2. Histograms (distributions) for all four normalization methods were then generated for each metric. Many of these histograms are skewed and thus violate normality. So paired t-tests would be inappropriate. Hence the distributions were evaluated using the respective empirical cumulative distribution functions (CDF). A CDF is the probability that a variable has a value equal to or higher than a specific value. For each metric we perform Kolmogorov-Smirnov (KS) two-sample tests (Massey, 1951) to estimate statistical significance of the differences between the CDFs. The KS statistic measures the largest possible distance between two CDFs.
3. Results
3.1 Evaluation results
Qualitative comparisons of the FA of the templates using DTI30 for all of the spatial normalization methods are presented in Fig. 2. Visually, it is evident that the full-tensor based (DTI-TK) and FA based (FA-ANTS) templates are the sharpest, while the FA-T1 and B0-T1 templates are much more blurry. Compared to FA-ANTS, some of the finer WM structural details, such as the separation between the internal and external capsule, are better delineated using DTI-TK (see arrows in Fig. 2). In all the quantitative evaluation figures DTI-TK is represented using blue, FA-ANTS using red, FA-T1 using green and B0-T1 using cyan colors.
Figure 2.
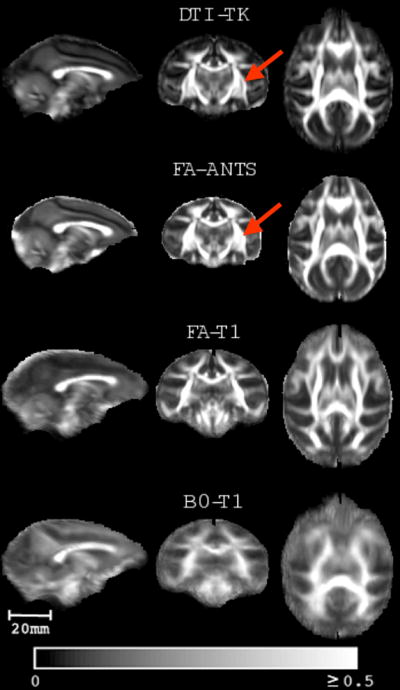
Qualitative comparisons of the mean FA templates for each of the four spatial normalization strategies applied to DTI from 30 monkeys (DTI30). Spatial normalization using T1-weighted images co-registered to FA and B0 (FA-T1 and BO-T1, respectively) generated considerably more blurry FA templates. The full-tensor (DTI-TK) and FA-ANTS yielded similar and sharper FA templates; however, some of the WM structures are better delineated on the DTI-TK map, such as the separation between the internal and external capsule as indicated by the red arrow. The color bar indicates the FA intensity scale (unitless).
Normalized standard deviation and dyadic coherence maps
Good spatial normalization will ideally maximize the anatomical consistency in the imaging measures, which decreases measurement variance, while preserving individual differences. The empirical CDFs and histograms (insets) of the above variables for all four methods are shown in Fig. 3. DTI-TK has the smallest standard deviation in FA and the highest eigenvector coherence. According to this criteria, B0-T1 and FA-T1 perform poorly, as indicated by the right shift in σ̄FA and left shift in κ, compared to DTI-TK and FA-ANTS. Although FA-ANTS is performs similarly in terms of σ̄FA, DTI-TK yields more consistent tensor orientations as demonstrated by higher κ of the tensors.
Figure 3.

Comparisons of the overall performance of the four spatial normalization methods in terms of the empirical CDF of both normalized standard deviation of FA, σ̄FA (left), and the dyadic coherence, κ (right), computed for the voxels within the WM. The corresponding histograms are shown as insets in each plot. In both cases, the CDFs and histograms for DTI-TK demonstrated greatest intersubject consistency. The σ̄FA shows similarity of the performance (left shift) of FA-ANTS and DTI-TK while dyadic coherence shows the better performance (right shift) of DTI-TK in preserving white matter orientations. The improvement in performance is statistically significant (p < 1e-10) as per the two sample KS tests.
The spatial maps of σ̄FA, σ̄TR and κ are shown in Figs. 4 and 5, which visually demonstrate reduced σ̄FA and σ̄TR and increased κ for the DTI-TK and FA-ANTS. σ̄TR is significantly lower than that of FA. This is expected since the contrast between white and gray matter is quite less in TR maps. As can be seen both qualitatively and quantitatively, DTI-TK yielded the lowest inter-subject variance in the scalar measures and higher eigenvector coherence, which we believe is desirable in a DTI spatial normalization method.
Figure 4.

Qualitative comparisons of the normalized standard deviation of FA (left) and TR (right) maps in the white matter for each of the normalization methods. Both lower σ̄FA and lower σ̄TR are desirable and clearly better for both DTI-TK and FA-ANTS relative to the other approaches.
Figure 5.

Qualitative comparisons of the dyadic coherence, κ, maps for the whole brain for each of the normalization methods. Highest κ was observed for DTI-TK, followed by FA-ANTS, which suggests that the tensor-based normalization best preserves the orientation information.
Cross correlations and overlaps
The empirical CDFs and histograms (insets) of the cross-correlations for FA, TR and eigenvalue-eigenvector overlap (OVL) for the four methods are shown in Fig. 6. The plots DTI-TK are shifted furthest to the right, though FA-ANTS has similar performance. These results suggest that DTI-TK yields more consistent tensor information at the voxel level.
Figure 6.

From left to right, empirical CDFs and histograms (insets) of cross correlations with respect to number of subjects: cross correlation of WM FA, cross correlation of WM TR and eigenvalue-eigenvector pair overlap with the template. DTI-TK performs better (indicated by right shift in the plots) with statistical significance of p < 1e-09 according to KS tests.
Tensor distances
The histograms and CDFs of the tensor distance metrics (ED and DD) are shown in Fig. 7. The plots of DTI-TK are significantly shifted to the left. These results support that DTI-TK yields higher between-subject consistency of the full diffusion tensors.
Figure 7.

Empirical CDFs of tensor distances with respect to WM voxels. Left: Euclidean distance (ED) of the tensors to the template. Right: Deviatoric distance (DD) of the tensors to the template. The corresponding histograms are shown in inset plots. DTI-TK has lowest distances indicated by the left-shift of the curves. Euclidean distances (ED) are shown on the left and deviatoric distances (DD) are shown on the right for all the four registration methods. DTI-TK shows better performance as can be seen from the left shift. The two sample KS tests reveal that the shifts are statistically significant with p < 1e-10.
3.2 Features of the UWRMAC-DTI271
In this section example maps of different measures extracted from UWRMAC-DTI271, the template generated from all 271 animals using DTI-TK, are presented. Maps of the average fractional anisotropy, trace, axial diffusivity and radial diffusivity of are shown in Fig. 8. Axial slices (every 5th slice) of our DTI template are shown in Fig. 9 as RGB-encoded fiber orientation maps (Pajevic and Pierpaoli, 1999). The intensities of the colors are modulated by the corresponding FA map. The bottom row of Fig. 9 shows a subset of slices (corresponding to second row) from a registered T1 template (McLaren et al., 2009). The UWRMAC-DTI271 was aligned to the Saleem Logothetis (SL) (McLaren et al., 2009) and Paxinos (Paxinos et al., 2009) space by affine registration (as used in the FA-T1) of our template FA to the corresponding T1 weighted templates. This registration approach (FA-T1), as can be seen, from the evaluation experiments was the next best performing method, in the absence of diffusion tensor data. The tensors in the corresponding T1 spaces were resampled and reoriented using the Log-Euclidean and PPD framework respectively using the implementations in DTI-TK.
Figure 8.
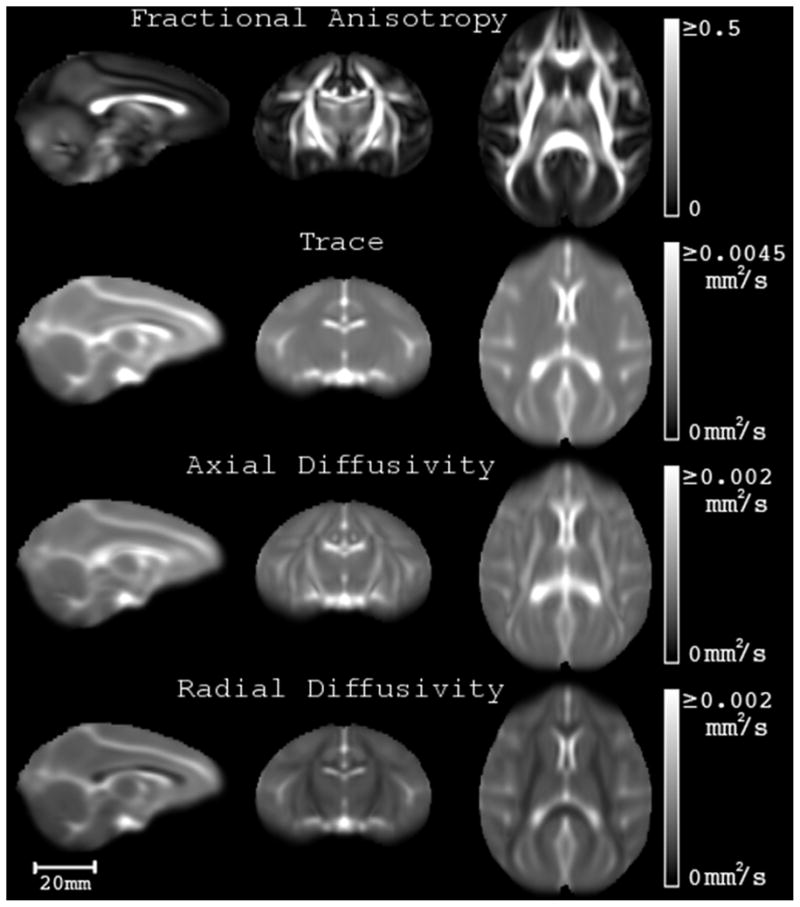
Population averaged, 3D fractional anisotropy (FA), trace, axial diffusivity and radial diffusivity maps of corresponding slices in sagittal (slice 125: position −1.0 mm), coronal (slice 106: position 11.5 mm) and axial (slice 156: position 20.0 mm) planes of the UWRMAC-DTI271 in Saleem and Logothetis (McLaren et al., 2009) atlas space. Each of these represents different average properties of the diffusion tensor and are useful in voxelwise analyses to localize individual differences. The units for trace, axial diffusivity and radial diffusivity are mm2/sec and indicate the rate of water diffusion, while the FA ranges between 0 and 1 and is unitless.
Figure 9.

Axial slices (every 5th slice from slice 123 through 183) of eigenvector color maps from UWRMAC-DTI271 in Saleem and Logothetis atlas space (McLaren et al., 2009). The last row shows corresponding (to the second row: slices from 143 through 163) axial slices of a T1-weighted template (McLaren et al., 2009). The top left frame shows the color mapping of the WM orientation: medial/lateral (right/left) is mapped to red, inferior/superior to blue and anterior/posterior (right/left) to green. The scale of the image is shown on bottom left. The positions of the slices relative to the origin in mm are shown on the bottom right of each slice.
Tractography on the DTI template can be used to estimate the trajectories of white matter pathways (Jones et al., 2002, Park et al., 2003) in the macaque brain. To demonstrate the potential of tractography applications, the UWRMAC-DTI271 was used to reconstruct five major white matter pathways – the corpus callosum, the inferior fronto-occipital fasciculus, the cingulum bundles, the fornix and the uncinate fasciculus. Tracts were generated and selected based on strategies described by Catani et al. (2008) and Mori et al. (2002). These major WM pathways share similar topology with those in humans. Several additional 3D renderings of these tracts are available online as supplementary material.
Finally Fig. 11 shows corresponding axial slices of FA maps of six different subjects and the corresponding slices from the template. It can be seen that the major white matter structures are consistently aligned. Additional movies showing the accurate alignment for an axial and a coronal slice are available as supplementary material. Such consistent alignment is highly desirable for voxel-based analyses.
Figure 11.
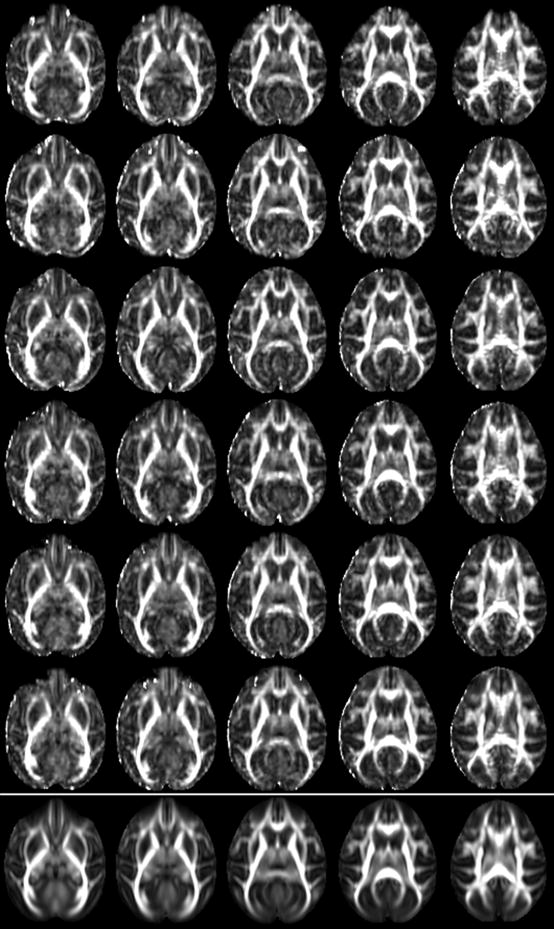
Five corresponding slices (every second one from slice 28 through 36) for six different subjects (one subject per row) and the corresponding slices in the template (bottom most row). The normalized images show high anatomical consistency across subjects.
4. Discussion
In this paper we described the construction of a population-specific DTI template, the UWRMAC-DTI271, for young rhesus macaques. The DTI template was resampled and aligned using affine registration of our template FA to the corresponding T1 weighted templates in both the Paxinos atlas (Paxinos et al., 2009), (241×320×190, 0.25×0.25×0.25 mm3) and the Saleem and Logothetis atlas (McLaren et al., 2009) (256×256×240, 0.5×0.5×0.5 mm3) and is currently available as a free, image-based resource in the standard image NIFTI (.nii) format for researchers worldwide. We believe that it will be of significant interest to investigators in the fields of brain imaging, systems neuroscience, developmental neurobiology, comparative neurobiology, primatology and psychiatry. This template, along with the WM pathways, may be downloaded at http://www.nitrc.org/projects/rmdtitemplate/. It may be loaded and viewed with many publicly available image analyses software packages such as FSL (http://www.fmrib.ox.ac.uk/fsl/), ITK-SNAP (http://www.itksnap.org/pmwiki/pmwiki.php) and AFNI (http://afni.nimh.nih.gov/afni). The WM tracts may be loaded and viewed in TrackVis (http://www.trackvis.org/). The contributing factors to the high image quality of our template are (1) the extremely large sample from which the template was created and (2) the high performance of the spatial normalization across animals.
Consistent with recent DTI template creation studies in humans (Zhang et al., 2007b; Zhang et al., 2011; Wang et al., 2011), this study showed that DTI-TK generated a DTI template of the rhesus macaques with the least inter-subject variability and high anatomical consistency. Although evaluating all possible registration methods is beyond the scope of the current paper, we can conclude that the tensor-based registration with DTI-TK yielded more consistent mapping of the scalar DTI measures, and the tensor orientation (e.g., eigenvectors, full tensor) in particular, compared to intensity based methods. The latter is not too surprising as previous works such as Park et. al. 2003 demonstrated that under common transformation model, using full tensor information performs better than using rotation invariant indices of the tensor. Hence although the improvement of DTI-TK may be due to different implementation of the diffeomorphic transformations the primary reason may be attributed to the use of tensor-based similarity. We also note that FA-ANTS had similar performance for registration of FA (and TR) maps, and that this approach would likely generate similar results when evaluating just scalar DTI measures. The apparently worse performance of the T1 normalization approaches (FA-T1 and B0-T1) is likely caused by poor registration of the DTI to the T1-weighted images, but might also be caused by overall worse performance of normalization using T1-weighted images. We believe that the presented comparisons can help primatologists make informed decisions when choosing a registration method and provide useful guidance in spatial normalization of monkey DTI data.
Although UWMRAC-DTI271 is obtained from a very large number of subjects using a well-tested normalization method there are several limitations that need to be considered. First, the spatial resolution of the original DTI acquisition was not isotropic and was relatively coarse in the slice (anterior/posterior) dimension (2.5 mm). However, both the template and the spatially normalized DTI data of each individual animal (Fig. 8) appear much sharper than the original data, including the slice dimension. Clearly the DTI template benefits from averaging across such a large number of images, resulting in minimal apparent blurring. Second, the field-map based distortion correction prior to spatial normalization (see Methods section for details) cannot completely compensate for highly distorted anatomical areas in the ventral prefrontal areas and temporal lobe regions around the inner ear. This is a limitation with nearly all DTI studies in both monkeys and humans. In the future, an improved DTI template may be constructed with true isotropic resolution and parallel imaging, using the spatial normalization strategies described here. Third, the DTI template was generated using DTI data from monkeys over an age range of 0.7370 to 4.2027 years, which may be suboptimal for use in studies of animals at ages outside the range. Future work is needed to generate either DTI templates at other ages or a DTI template with a temporal dimension to accommodate for age-related changes (Hart et al., 2010; Fonov et al. 2011). Finally, it is well known that the diffusion tensor model has some limitations with regard to describing both the diffusion and geometric properties of the tissue in regions of fiber crossing (Wedeen et al., 2008). Despite this limitation, there is a huge potential for DTI, and it is widely used for most clinical and scientific imaging research studies of white matter.
We would also like to note that, although population averaged computation templates represent anatomical variation in the species with high SNR and low bias (McLaren et al., 2009, Joshi et al., 2004, Zhang et al., 2007a), single-subject post-mortem templates (Martin and Bowden, 1996; Paxinos et al., 2009) are very valuable in cases where DTI/MRI cannot match the histological specificity and precision. Single-subject computational atlases with high SNR have also been developed by averaging repeated acquisitions of a single subject for accurate segmentation and atlas based analyses (Mazziotta et al. 2001; Oishi et al. 2011). Some voxel based analyses (like TBSS), although recommend using population-specific template, provide an option to choose “most representative” single-subject as a template that is then transformed to MNI152 (Smith et al. 2006). Finally, there are more recent Bayesian and multi-atlas approaches that may ultimately result in better representation of population properties (Ma et al. 2008; Natasha et al. 2009; Wu et al. 2011; Koikkalainen et al. 2011).
There are many potential avenues to apply the UWRMAC-DTI271. First, it is an average representation of brain neuroanatomy and diffusion measurements in the monkey, which will be valuable for education, atlasing, anatomic localization, and comparative neuroanatomy (Stephan et al., 2001; Ramnani et al., 2006). Future work will include detailed anatomic labeling of the template similar to the human DTI atlas created by Mori et al. (2008). The UWRMAC-DTI271 template may be useful as a reference template for spatial normalization of other DTI data sets, with matching age-range, for voxel-based analyses. Depending on the age-range and anatomical status of the sample, some monkey DTI studies may still need to use a study-specific template. In such cases, researchers can build upon the thorough evaluations and registration framework presented in this paper and can subsequently map the results onto this template for standardized reporting. By mapping regions-of-interest (ROIs) and/or tract reconstructions onto this template, automated region- and structure- specific analyses may be efficiently performed. Further, since the template is in standardized spaces (Paxinos et al., 2009; McLaren et al., 2009), it is now possible to integrate other brain templates and regional atlases to create multimodal maps of the monkey brain.
Another unique attribute of the UWRMAC-DTI271 template is that the major directional components of the diffusion tensor orientations are preserved. This facilitates the application of tractography in the average template as can be seen by the example reconstructions of five major white matter pathways shown in Fig. 10. We will use this template to reconstruct more of the fiber pathways and create a more complete tractography atlas of the rhesus monkey brain. Importantly, identifying WM pathways may facilitate efficient tract specific analyses (TSA) in nonhuman primates (Yushkevich et al., 2008; Zhang et al., 2010). One clear advantage of DTI studies in the monkey is that tract reconstructions may be compared with tracer studies that are not possible in humans. Spatial standardization will also enable the mapping and comparison of prior tract tracing studies in the CoCoMac database (Croxson et al., 2005), which describes cortical connections in the rhesus macaque. Our template, in conjunction with a reference label atlas (Wisco et al., 2008), can be used for developing in vivo brain connectome models for the rhesus monkey using tractography (Hagmann et al., 2010). This will be a critical step in understanding the influence of connectivity of the primate brain.
Figure 10.

White matter tracts reconstructed on the UWRMAC-DTI271 template by adapting strategies described in Catani et al. (2008) and Mori et al. (2002) for human white matter tracts. The tracts were obtained using the tensor deflection (TEND) tractography algorithm (Lazar et al., 2003) with a step size of 0.025 mm, stopping criteria of FA < 0.1–0.15 and a curvature threshold > 45°–60°. The tracts are overlaid on the slices of the Paxinos T1 atlas (Paxinos et al., 2009). Several additional 3D renderings of the tracts are available online as supplementary material.
In addition to its application in the study of development per se, we believe that the developing rhesus monkey DTI brain template presented here is an important step in furthering the study of psychopathology. In particular, studies demonstrate that several forms of psychopathology often begin during childhood or adolescence (Paus et al., 2008). Moreover, evidence suggests that many adolescent and adult anxiety and affective disorders are chronic developmental illnesses that have their genesis in early childhood (Pine et al., 1998). Thus, early childhood and adolescence are a period of increased risk, and since anxiety disorders are among the most common forms of psychopathology (Kessler et al., 2005), a focus on developmental non-human primate models of brain white matter will be increasingly important to understand the neural bases of anxiety-related psychopathology (Kalin and Shelton, 2003; Nelson and Winslow, 2009).
Supplementary Material
Research highlights.
Important first of its kind DTI template for Rhesus Macaques.
Largest number of animals ever used in generating a DTI template.
Demonstrated efficacy of tensor-based spatial normalization for Rhesus Macaques.
Five major white matter tracts reconstructed on the template.
The template is aligned to Paxinos as well as Saleem-Logothetis atlas spaces.
Acknowledgments
This work was partially supported by NIH grants MH62015, MH084051, MH080826, MH46729, MH81884, MH018931, R03-EB009321 and University of Wisconsin-CIBM-MIR fellowship.
Footnotes
Publisher's Disclaimer: This is a PDF file of an unedited manuscript that has been accepted for publication. As a service to our customers we are providing this early version of the manuscript. The manuscript will undergo copyediting, typesetting, and review of the resulting proof before it is published in its final citable form. Please note that during the production process errors may be discovered which could affect the content, and all legal disclaimers that apply to the journal pertain.
References
- 1.Alexander DC, Gee JC. Spatial transformations for registration of DT-MRIs. Proc. Medical Image Understanding and Analysis; London. 2000a. pp. 203–206. [Google Scholar]
- 2.Alexander DC, Gee JC. Elastic matching of diffusion tensor images. Comput Vis Image Underst. 2000b;77:233–250. [Google Scholar]
- 3.Alexander DC, Pierpaoli C, Basser PJ, Gee JC. Spatial transformations of diffusion tensor magnetic resonance images. IEEE Trans Med Imaging. 2001;20:1131–1139. doi: 10.1109/42.963816. [DOI] [PubMed] [Google Scholar]
- 4.Alexander DC, Barker GJ. Optimal imaging parameters for fibre-orientation estimation in diffusion MRI. NeuroImage. 2005;27:357–367. doi: 10.1016/j.neuroimage.2005.04.008. [DOI] [PubMed] [Google Scholar]
- 5.Alexander AL, Lee JE, Lazar M, Field AS. Diffusion tensor imaging of the brain. Neurotherapeutics. 2007;4:316–329. doi: 10.1016/j.nurt.2007.05.011. [DOI] [PMC free article] [PubMed] [Google Scholar]
- 6.Arsigny V, Fillard P, Pennec X, Ayache N. Log-Euclidean metrics for fast and simple calculus on diffusion tensors. Magn Reson Med. 2006;56:411–421. doi: 10.1002/mrm.20965. [DOI] [PubMed] [Google Scholar]
- 7.Avants B, Gee JC. Geodesic estimation for large deformation anatomical shape averaging and interpolation. Neuroimage. 2004;23:S139–S150. doi: 10.1016/j.neuroimage.2004.07.010. [DOI] [PubMed] [Google Scholar]
- 8.Avants B, Schoenemann PT, Gee JC. Lagrangian frame diffeomorphic image registration: Morphometric comparison of human and chimpanzee cortex. Med Image Anal. 2006;10:397–412. doi: 10.1016/j.media.2005.03.005. [DOI] [PubMed] [Google Scholar]
- 9.Avants B, Epstein CL, Grossman M, Gee JC. Symmetric diffeomorphic image registration with cross-correlation: Evaluating automated labeling of elderly and neurodegenerative brain. Med Image Anal. 2008;12:26–41. doi: 10.1016/j.media.2007.06.004. [DOI] [PMC free article] [PubMed] [Google Scholar]
- 10.Bartosic AM, Ennis CM, Adluru N, Alexander AL. Evaluation of BET and 3DSkullStrip for skull-stripping monkey brain data. Human Brain Mapping Annual Meeting; 2010. pp. 1–8. [Google Scholar]
- 11.Basser PJ, Mattiello J, Bihan DL. Estimation of the effective self-diffusion tensor from NMR spin echo. J Magn Reson. 1994;103:247–254. doi: 10.1006/jmrb.1994.1037. [DOI] [PubMed] [Google Scholar]
- 12.Basser PJ, Pierpaoli C. Microstructural and physiological features of tissues elucidated by quantitative-diffusion-tensor MRI. J Magn Reson. 1996;111:209–219. doi: 10.1006/jmrb.1996.0086. [DOI] [PubMed] [Google Scholar]
- 13.Basser PJ, Pajevic S. Statistical artifacts in diffusion tensor MRI (DT-MRI) caused by background noise. Magn Reson Med. 2000;44:41–50. doi: 10.1002/1522-2594(200007)44:1<41::aid-mrm8>3.0.co;2-o. [DOI] [PubMed] [Google Scholar]
- 14.Bendlin BB, et al. Effects of aging and calorie restriction on white matter in rhesus macaques. Neurobiol Aging. 2010;31 doi: 10.1016/j.neurobiolaging.2010.04.008. [DOI] [PMC free article] [PubMed] [Google Scholar]
- 15.Catani M, Thiebaut de Schotten M. A diffusion tensor imaging tractography atlas for in vivo dissections. Cortex. 2008;44:1105–1132. doi: 10.1016/j.cortex.2008.05.004. [DOI] [PubMed] [Google Scholar]
- 16.Chiro DG, et al. MR cisternography and myelography with Gd-DTPA in monkeys. Radiology. 1985;157:373–377. doi: 10.1148/radiology.157.2.4048444. [DOI] [PubMed] [Google Scholar]
- 17.Conturo TE, et al. Tracking neuronal fiber pathways in the living human brain. Proc Natl Acad Sci. 1999;96:10422–10427. doi: 10.1073/pnas.96.18.10422. [DOI] [PMC free article] [PubMed] [Google Scholar]
- 18.Croxson PL, et al. Quantitative investigation of connections of the prefrontal cortex in the human and macaque using probabilistic diffusion tractography. J Neurosci. 2005;25:8854–8866. doi: 10.1523/JNEUROSCI.1311-05.2005. [DOI] [PMC free article] [PubMed] [Google Scholar]
- 19.Evans A, et al. 3D statistical neuroanatomical models from 305 MRI volumes. IEEE Conference Record, Nuclear Science Symposium and Medical Imaging Conference. 1993;1:1813–1817. [Google Scholar]
- 20.Fonov V, et al. Unbiased average age-appropriate atlases for pediatric studies. NeuroImage. 2011;54:313–327. doi: 10.1016/j.neuroimage.2010.07.033. [DOI] [PMC free article] [PubMed] [Google Scholar]
- 21.Gibbs RA, et al. Evolutionary and biomedical insights from the rhesus macaque genome. Science. 2007;316:222. doi: 10.1126/science.1139247. [DOI] [PubMed] [Google Scholar]
- 22.Guimond A, Meunier J, Thirion JP. Average brain models: a convergence study. Comput Vis Image Underst. 2000;77:192–210. [Google Scholar]
- 23.Guo J, et al. Diffusion tensor MRI for the assessment of cerebral ischemia/reperfusion injury in the penumbra of non-human primate stroke model. Neurol Res. 2011;33:108–112. doi: 10.1179/016164110X12761752770177. [DOI] [PubMed] [Google Scholar]
- 24.Hagmann P, et al. MR connectomics: Principles and challenges. J Neurosci Methods. 2010;194:34–45. doi: 10.1016/j.jneumeth.2010.01.014. [DOI] [PubMed] [Google Scholar]
- 25.Hart, et al. DTI Longitudinal Atlas Construction as an Average of Growth Models. MICCAI, International Workshop on Spatio-Temporal Image Analysis for Longitudinal and Time-Series Image Data; 2010. pp. 1–8. [Google Scholar]
- 26.Hofer S, Merboldt KD, Tammer R, Frahm J. Rhesus monkey and human share a similar topography of the corpus callosum as revealed by diffusion tensor MRI in vivo. Cereb Cortex. 2008;18:1079–1084. doi: 10.1093/cercor/bhm141. [DOI] [PubMed] [Google Scholar]
- 27.Jezzard P, Clare S. Sources of distortion in functional MRI data. Hum Brain Mapp. 1995;8:80–85. doi: 10.1002/(SICI)1097-0193(1999)8:2/3<80::AID-HBM2>3.0.CO;2-C. [DOI] [PMC free article] [PubMed] [Google Scholar]
- 28.Jones DK, Simmons A, Williams SC, Horsfield MA. Non-invasive assessment of axonal fiber connectivity in the human brain via diffusion tensor MRI. Magn Reson Med. 1999;42:37–41. doi: 10.1002/(sici)1522-2594(199907)42:1<37::aid-mrm7>3.0.co;2-o. [DOI] [PubMed] [Google Scholar]
- 29.Jones DK, et al. Spatial normalization and averaging of diffusion tensor MRI data sets. NeuroImage. 2002;17:592–617. [PubMed] [Google Scholar]
- 30.Joshi S, Davis B, Jomier M, Gerig G. Unbiased diffeomorphic atlas construction for computational anatomy. Neuroimage. 2004;23:151–60. doi: 10.1016/j.neuroimage.2004.07.068. [DOI] [PubMed] [Google Scholar]
- 31.Kalin NH, Shelton SE. Nonhuman primate models to study anxiety, emotion regulation, and psychopathology. Ann N Y Acad Sci. 2003;1008:189–200. doi: 10.1196/annals.1301.021. [DOI] [PubMed] [Google Scholar]
- 32.Kessler RC, Chiu WT, Demler O, Merikangas KR, Walters EE. Prevalence, severity, and comorbidity of 12-month DSM-IV disorders in the National Comorbidity Survey Replication. Arch Gen Psychiatry. 2005;62:617–627. doi: 10.1001/archpsyc.62.6.617. [DOI] [PMC free article] [PubMed] [Google Scholar]
- 33.Klein A, et al. Evaluation of 14 nonlinear deformation algorithms applied to human brain MRI registration. NeuroImage. 2009;46:786–802. doi: 10.1016/j.neuroimage.2008.12.037. [DOI] [PMC free article] [PubMed] [Google Scholar]
- 34.Koikkalainen J, et al. Multi-template tensor-based morphometry: Application to analysis of Alzheimer’s disease. NeuroImage. 2011;56:1134–1144. doi: 10.1016/j.neuroimage.2011.03.029. [DOI] [PMC free article] [PubMed] [Google Scholar]
- 35.Lazar M, et al. White matter tractography using diffusion tensor deflection. Hum Brain Mapp. 2003;18:306–321. doi: 10.1002/hbm.10102. [DOI] [PMC free article] [PubMed] [Google Scholar]
- 36.Liu X, Zhu T, Gu T, Zhong J. A practical approach to in vivo high-resolution diffusion tensor imaging of rhesus monkeys on a 3-T human scanner. Magn Reson Imaging. 2009;27:335–346. doi: 10.1016/j.mri.2008.07.004. [DOI] [PubMed] [Google Scholar]
- 37.Ma J, Miller MI, Trouvé A, Younes L. Bayesian Template Estimation in Computational Anatomy. NeuroImage. 2008;42:252–261. doi: 10.1016/j.neuroimage.2008.03.056. [DOI] [PMC free article] [PubMed] [Google Scholar]
- 38.Makris N, et al. Frontal connections and cognitive changes in normal aging rhesus monkeys: a DTI study. Neurobiol Aging. 2007;28:1556–67. doi: 10.1016/j.neurobiolaging.2006.07.005. [DOI] [PubMed] [Google Scholar]
- 39.Martin RF, Bowden DM. A stereotaxic template atlas of the macaque brain for digital imaging and quantitative neuroanatomy. NeuroImage. 1996;4:119–150. doi: 10.1006/nimg.1996.0036. [DOI] [PubMed] [Google Scholar]
- 40.Massey FJ. The Kolmogorov-Smirnov Test for Goodness of Fit. J Am Stat Assoc. 1951;46:68–78. [Google Scholar]
- 41.Mazziotta JC, et al. A Probablistic Atlas of the Human Brain: Theory and Rationale for Its Development. NeuroImage. 1995;2:89–101. doi: 10.1006/nimg.1995.1012. [DOI] [PubMed] [Google Scholar]
- 42.Mazziotta JC, et al. A probabilistic atlas and reference system for the human brain: International Consortium for Brain Mapping (ICBM) Philos Trans Royal Soc. 2001;356:1293–1322. doi: 10.1098/rstb.2001.0915. [DOI] [PMC free article] [PubMed] [Google Scholar]
- 43.McLaren DG, et al. A population-average MRI-based atlas collection of the rhesus macaque. NeuroImage. 2009;45:52–59. doi: 10.1016/j.neuroimage.2008.10.058. [DOI] [PMC free article] [PubMed] [Google Scholar]
- 44.Mori S, Crain BJ, Chacko VP, van Zijl PC. Three-dimensional tracking of axonal projections in the brain by magnetic resonance imaging. Ann Neurol. 1999;45:265–269. doi: 10.1002/1531-8249(199902)45:2<265::aid-ana21>3.0.co;2-3. [DOI] [PubMed] [Google Scholar]
- 45.Mori S, Kaufmann WE, Davatzikos C, Stieltjes B, Amodei L, Fredericksen K, Pearlson GD, Melhem ER, Solaiyappan M, Raymond GV, Moser HW, van Zijl PC. Imaging cortical association tracts in the human brain using diffusion-tensor-based axonal tracking. Magn Reson Med. 2002;47:215–223. doi: 10.1002/mrm.10074. [DOI] [PubMed] [Google Scholar]
- 46.Mori S, et al. Stereotaxic white matter atlas based on diffusion tensor imaging in an ICBM template. NeuroImage. 2008;40:570–582. doi: 10.1016/j.neuroimage.2007.12.035. [DOI] [PMC free article] [PubMed] [Google Scholar]
- 47.Natasha L, et al. Multi-atlas tensor-based morphometry and its application to a genetic study of 92 twins. Mathematical Foundations of Computational Anatomy: Geometrical and Statistical Methods for Biological Shape Variability Model. 2009:48–55. [Google Scholar]
- 48.Nelson EE, Winslow JT. Non-human primates: model animals for developmental psychopathology. Neuropsychopharmacology. 2009;34:90–105. doi: 10.1038/npp.2008.150. [DOI] [PubMed] [Google Scholar]
- 49.Oishi K, et al. Multi-contrast human neonatal brain atlas: Application to normal neonate development analysis. NeuroImage. 2011;56:8–20. doi: 10.1016/j.neuroimage.2011.01.051. [DOI] [PMC free article] [PubMed] [Google Scholar]
- 50.Oler, et al. Amygdalar and hippocampal substrates of anxious temperament differ in their heritability. Nature. 2010;466:864–868. doi: 10.1038/nature09282. [DOI] [PMC free article] [PubMed] [Google Scholar]
- 51.Pajevic S, Pierpaoli C. Color schemes to represent the orientation of anisotropic tissues from diffusion tensor data: Application to white matter fiber tract mapping in the human brain. Magn Reson Med. 1999;42:526–540. [PubMed] [Google Scholar]
- 52.Park HJ, Kubicki M, Shenton ME, Guimond A, McCarley RW, Maier SE, Kikinis R, Jolesz FA, Westin CF. Spatial normalization of diffusion tensor MRI using multiple channels. Neuroimage. 2003;20:1995–2009. doi: 10.1016/j.neuroimage.2003.08.008. [DOI] [PMC free article] [PubMed] [Google Scholar]
- 53.Paus T, Keshavan M, Giedd JN. Why do many psychiatric disorders emerge during adolescence? Nat Rev Neurosci. 2008;9:947–957. doi: 10.1038/nrn2513. [DOI] [PMC free article] [PubMed] [Google Scholar]
- 54.Paxinos G, Toga AW, Huang XF, Petrides M. The rhesus monkey brain in stereotaxic coordinates. Vol. 416. Academic Press; London, England: 2009. [Google Scholar]
- 55.Pierpaoli C, Jezzard P, Basser PJ, Barnett A, Chiro GD. Diffusion tensor MR imaging of the human brain. Radiology. 1996;201:637–648. doi: 10.1148/radiology.201.3.8939209. [DOI] [PubMed] [Google Scholar]
- 56.Pine DS, Cohen P, Gurley D, Brook J, Ma Y. The risk for early-adulthood anxiety and depressive disorders in adolescents with anxiety and depressive disorders. Arch Gen Psychiatry. 1998;55:56–64. doi: 10.1001/archpsyc.55.1.56. [DOI] [PubMed] [Google Scholar]
- 57.Ramnani N, et al. The evolution of prefrontal inputs to the cortico-pontine system: diffusion imaging evidence from Macaque monkeys and humans. Cereb Cortex. 2006;16:811–818. doi: 10.1093/cercor/bhj024. [DOI] [PubMed] [Google Scholar]
- 58.Salimi-Khorshidia G, Smitha SM, Keltnera JR, Wagerb TD, Nichols TE. Meta-analysis of neuroimaging data: A comparison of image-based and coordinate-based pooling of studies. NeuroImage. 2009;45:810–823. doi: 10.1016/j.neuroimage.2008.12.039. [DOI] [PubMed] [Google Scholar]
- 59.Schmahmann JD, et al. Association fibre pathways of the brain: parallel observations from diffusion spectrum imaging and autoradiography. Brain. 2007;130:630–653. doi: 10.1093/brain/awl359. [DOI] [PubMed] [Google Scholar]
- 60.Shamy JL, et al. Alterations of white matter tracts following neurotoxic hippocampal lesions in macaque monkeys: a diffusion tensor imaging study. Hippocampus. 2010;20:906–910. doi: 10.1002/hipo.20737. [DOI] [PMC free article] [PubMed] [Google Scholar]
- 61.Smith SM. Fast robust automated brain extraction. Hum Brain Mapp. 2002;17:143–155. doi: 10.1002/hbm.10062. [DOI] [PMC free article] [PubMed] [Google Scholar]
- 62.Smith SM, et al. Advances in functional and structural MR image analysis and implementation as FSL. NeuroImage. 2004;23:S208–219. doi: 10.1016/j.neuroimage.2004.07.051. [DOI] [PubMed] [Google Scholar]
- 63.Smith SM, et al. Tract-based spatial statistics: voxelwise analysis of multi-subject diffusion data. NeuroImage. 2006;31:1487–1505. doi: 10.1016/j.neuroimage.2006.02.024. [DOI] [PubMed] [Google Scholar]
- 64.Stephan KE, et al. Advanced database methodology for the collation of connectivity data on the macaque brain (CoCoMac) Phil Trans R Soc B. 2001;356:1159–1186. doi: 10.1098/rstb.2001.0908. [DOI] [PMC free article] [PubMed] [Google Scholar]
- 65.Van Hecke W, et al. The effect of template selection on diffusion tensor voxel-based analysis results. NeuroImage. 2011;55:566–573. doi: 10.1016/j.neuroimage.2010.12.005. [DOI] [PubMed] [Google Scholar]
- 66.Wang Y, et al. DTI registration in atlas based fiber analysis of infantile Krabbe disease. NeuroImage. 2011;55:1577–1586. doi: 10.1016/j.neuroimage.2011.01.038. [DOI] [PMC free article] [PubMed] [Google Scholar]
- 67.Wedeen VJ, et al. Diffusion spectrum magnetic resonance imaging (DSI) tractography of crossing fibers. NeuroImage. 2008;41:1267–1277. doi: 10.1016/j.neuroimage.2008.03.036. [DOI] [PubMed] [Google Scholar]
- 68.Willette AA, et al. Age-related changes in neural volume and microstructure associated with interleukin-6 are ameliorated by a calorie-restricted diet in old rhesus monkeys. Neuroimage. 2010;51:987–994. doi: 10.1016/j.neuroimage.2010.03.015. [DOI] [PMC free article] [PubMed] [Google Scholar]
- 69.Wisco JJ, et al. A rhesus monkey reference label atlas for template driven segmentation. J Med Primatol. 2008;37:250–260. doi: 10.1111/j.1600-0684.2008.00288.x. [DOI] [PMC free article] [PubMed] [Google Scholar]
- 70.Wu G, Jia H, Wang Q, Shen D. SharpMean: Groupwise registration guided by sharp mean image and tree-based registration. NeuroImage. 2011;56:1968–1981. doi: 10.1016/j.neuroimage.2011.03.050. [DOI] [PMC free article] [PubMed] [Google Scholar]
- 71.Yushkevich PA, Zhang H, Simon TJ, Gee JC. Structure-specific statistical mapping of white matter tracts. NeuroImage. 2008;41:954–966. doi: 10.1016/j.neuroimage.2008.01.013. [DOI] [PMC free article] [PubMed] [Google Scholar]
- 72.Zhang H, Yushkevich PA, Alexander DC, Gee JC. Deformable registration of diffusion tensor MR images with explicit orientation optimization. Med Image Anal. 2006;10:764–785. doi: 10.1016/j.media.2006.06.004. [DOI] [PubMed] [Google Scholar]
- 73.Zhang H, Yushkevich PA, Rueckert D, Gee JC. Unbiased white matter atlas construction using diffusion tensor images. MICCAI, Lecture Notes in Computer Science. 2007a;4792:211–218. doi: 10.1007/978-3-540-75759-7_26. [DOI] [PubMed] [Google Scholar]
- 74.Zhang H, et al. High-dimensional spatial normalization of diffusion tensor images improves the detection of white matter differences: an example study using amyotrophic later sclerosis. IEEE Trans Med Imaging. 2007b;26:1585–1597. doi: 10.1109/TMI.2007.906784. [DOI] [PubMed] [Google Scholar]
- 75.Zhang H, et al. A tract-specific framework for white matter morphometry combining macroscopic and microscopic tract features. Med Image Anal. 2010;14:666–673. doi: 10.1016/j.media.2010.05.002. [DOI] [PMC free article] [PubMed] [Google Scholar]
- 76.Zhang S, Peng H, Dawe RJ, Arfanakis K. Enhanced ICBM diffusion tensor template of the human brain. NeuroImage. 2011;54:974–984. doi: 10.1016/j.neuroimage.2010.09.008. [DOI] [PMC free article] [PubMed] [Google Scholar]
Associated Data
This section collects any data citations, data availability statements, or supplementary materials included in this article.