Abstract
Background
Refinement of the subthalamic nucleus (STN) coordinates using intraoperative microelectrode recordings (MER) is routinely performed during deep brain stimulation (DBS) surgeries in Parkinson disease (PD). The commonly used criteria for electrophysiological localization of the STN are qualitative. The goal of this study was to validate quantitative STN detection algorithm (QD) derived from the multi-unit activity in a prospective setting.
Methods
Ten PD patients underwent STN DBS surgery. The MUA was obtained by removing large spikes close to microelectrode using wavelet method and integrating the 500-2000 Hz band in the power spectral density. The qualitative intraoperative mapping of the STN using MER (IOM) versus QD was compared using Bland-Altman and Pearson’s correlation analysis.
Results
The clinical efficacy was confirmed in all subjects. The mean difference between IOM and QD of the dorsal/ventral border was 0.31±0.84/0.44±0.47 mm. Using Bland-Altman statistic, only 2/36 (5.6%) differences (one for the dorsal border and one for the ventral border) were out of ±2 sd line of measurement differences. Correlation between dorsal border/ventral borders positions obtained by IOM and QD was 0.79, p<0.0001/0.91, p<0.0001.
Conclusion
Both methods are in reasonable agreement and are strongly correlated. The QD gives objective coordinates of the STN borders at high precision and may be more accurate than IOM. Prospective blinded comparative studies where the DBS leads will be placed using either QD or IOM are warranted.
Keywords: Parkinson disease, subthalamic nucleus, deep brain stimulation, DBS, microelectrode, recordings, multi-unit activity
1.Introduction
High frequency (> 130 Hz) electrical stimulation of the subthalamic nucleus (STN) is an effective treatment of Parkinson disease (PD) [1]. Generally, deep brain stimulation (DBS) surgery is performed via frame-based stereotactic surgery based on targeting coordinates for the STN obtained from a pre-operative MRI. Since the STN is a small (9 × 7 × 4 mm) deep structure and its borders are poorly visualized on conventional imaging, it is a common practice to use the microelectrode recordings (MER) to refine STN targeting. The combination of direct visualization of the STN on MRI with the MER may result in improved clinical outcome [2].
The routine intraoperative mapping of the STN using MER (IOM) relies upon complex and subjective criteria including visual and auditory evaluations of changes in spiking frequencies, background neuronal activity and kinesthetic responses [2,3].
There have been several previous attempts to use quantitative analysis of MER to facilitate the STN localization process [4-7]. MER reflects an extracellular activity that can be divided into three categories: single unit activity, local field potentials (< 500 Hz) and multi unit activity (> 500 Hz). In particular multi unit activity (MUA) has appealing properties. MUA is equal to an aggregate of the spiking activity in the vicinity of the recording electrode [8] and is elevated in the STN compared to neighboring structures [9]. In our previous retrospective study we showed that detection of the STN borders derived from MUA correlates well with the IOM [9]. In addition, the DBS leads were successfully implanted in PD patients where the STN detection was based solely using the MUA [10].
To our knowledge, there are no prospective, head-to-head studies comparing a gold standard IOM with the MUA-based quantitative detection of the STN (QD). In this study, we compared the IOM with the QD prospectively in a blinded fashion. Furthermore, the algorithm for MUA detection was optimized by using an unsupervised wavelet despiking method and we also employed a different MER system to show feasibility with multiple systems.
2. Materials and Methods
2.1 Study design
This was a prospective, single-center blinded study comparing IOM to QD. The Institutional Review Board of the University of Massachusetts approved the study and informed consent for all subjects was obtained.
2.2 Study subjects
Inclusion criterion was PD [11] complicated by significant medication side effects including dyskinesia, motor fluctuations, or inadequate response to medical therapy. Patients had a PD diagnosis at least 5 years prior to implantation and had a Hoehn and Yahr score 2-3. Exclusion criteria were significant depression, psychosis and cognitive deficit. All patients underwent standardized neuropsychological testing and Unified Parkinson disease rating scale (UPDRS) in the on and off state to ensure dopaminergic response preoperatively. All patients undergoing DBS were offered participation in the study.
2.3 Stereotactic surgery
Surgical planning utilized the BrainLab iPlan Stereotaxy 2.6 (BrainLAB AG, Feldkirchen, Germany) which allows for multiplanar imaging of the target and the planned trajectory(s). T2 weighted and gadolinium enhanced T1 weighted sequences were acquired pre-operatively. The burr hole was placed 3-4 cm lateral to the midline and the trajectory was planned to avoid vasculature and penetration of the ventricular ependyma. Typically this resulted in a trajectory of 50-60 degrees from the AC-PC line in the sagittal plane and a coronal angle of 10-15 degrees from the midline depending on ventricular size. In relationship to the midcommisural point, the target was 11-12 mm lateral, 3 mm posterior and 4 mm below [11]. Direct as well as indirect targeting based on the red nucleus as an internal landmark was performed. If there were differences in x, y, or z calculations between indirect and direct targeting, we modified them slightly in the direction of the direct imaging. According to the Schaltenbrand and Wahren atlas [13] the usual trajectory penetrated the following structures: the anterior thalamus, the zona incerta, the H2 field of Forel, STN, and the substantia nigra (SN).
2.5 Intraoperative monitoring
MER was performed using a Guideline 4000 (FHC, Inc. Bowdoin, ME). Neural signals were recorded by using a tungsten monopolar microelectrode (22675Z, FHC, Inc. Bowdoin, ME) with impedance in the range of 0.4 to 0.9 MΩ. The electrode was advanced with the use of a clinical microdrive (microTargeting Drive, FHC, Inc. Bowdoin, ME). MER started 20 mm above the target. The microelectrode was advanced in 0.5 mm increments to between 20 and 10 mm above the target. At 10 mm above the target, the increments were decreased to 0.3 mm. The microelectrode was advanced with a distance smaller than 0.3 mm when the MER encountered increases in neuronal activity. Ten second recordings were obtained at each point. Recordings were band-pass filtered typically at 300 Hz to 5 kHz, digitized at 24 kHz and stored for offline analysis. Occasionally, the high pass filter (300 Hz) was adjusted upward if the interference at the operating room reduced the signal quality but the filter never exceeded 500 Hz.
The evaluation of neuronal signals was performed by observing the neuronal activity on the computer monitor and by auditory recognition. The electrophysiological criteria used to distinguish the STN were an increase in the background activity, an increase in the neuronal firing, and/or alteration of neural firing by passive movement of contralateral limbs. The entry to the STN corresponds to the dorsal border and the exit from the STN to the ventral border. After establishing the borders, the captured length (later on “length”) of the STN was defined as the difference in depth between the dorsal and ventral border.
Another track was undertaken if the STN length was less than 3 mm, if background neuronal activity was lower than expected or if kinesthetic responses were absent. If the track was atypical, e.g. the ventral border was ambiguous due quiet zones, another track was undertaken, and the track with the best kinesthetic responses and broadest STN length was chosen for final electrode implantation. Microstimulation with current up to 100 μA was performed. If no side effects were observed the microelectrode was replaced with the DBS lead (model 3389-40 Medtronic, Minneapolis, MN). Macrostimulation was performed up to 5 volts to confirm contralateral improvement of rigidity, tremor, or bradykinesia.
2.6 Description of the detection algorithm
The STN detection is based on the profile of the MUA that is characteristically elevated within the STN. The recorded signals contain both large spikes and multi-unit activity. Large spikes originating in close proximity to the recording electrode, e.g. the foreground spikes, obscure the MUA. To automatically remove the foreground spikes, (e.g. despiking), we used an unsupervised Daubechies-based wavelet algorithm that is spike oriented modification of the standard wavelet denoising algorithm with soft-thresholding [14]. A variable threshold that is a multiple (k=3-5) of standard deviations of the signal was used. We have improved our previous method [8] that removed the neuronal background together with the large spikes. The new approach by using wavelet algorithm removes only large spikes [14] without changing the background activity.
The MUA was calculated in the frequency domain. The power spectral density was calculated over the 10-second segments of despiked neuronal activity by Welch’s method with a Fourier transform length of 6000 samples per segment weighted by Hamming window. The MUA was obtained by integrating the 500-2000 Hz band in the power spectral density [9].
The criteria for the STN were as follows. The dorsal border was defined as the first site along a track where the MUA exceeds the baseline MUA at least by 50 % and elevation of the MUA is sustained. The baseline MUA was obtained as an average MUA from MER ≥ 10 mm above the target that usually corresponds to the thalamic activity. The ventral border was defined as the last site along a track where the MUA reduction was less than 50 % compared to the average MUA within the STN and the decline in MUA is sustained.
2.7 Study protocol
Prior to surgery, all patients underwent on/off testing, neuropsychological evaluation, and preoperative MRI. All dopaminergic medications were withheld from patients for approximately 12 hours before their surgery. After completing each surgery, the MER data were sent to FHC without identifiers for processing of the QD. The investigators that processed the QD were blinded to the results of the IOM. Final unblinding of the results occurred after completing all surgeries.
2.8 Statistical analysis
The dorsal and ventral borders obtained by each technique were compared using Pearson’s correlation analysis and Bland-Altman statistics [15] to compare the two diagnostic methods. JMP 5.1 (Cary, NC) statistical software was used for all statistical analyses.
3. Results
Ten patients (3 women, 7 men) were enrolled into the study. The mean and standard deviation (sd) age of the subjects was 56.8±10.8 years and age range was 44-77; duration of disease was 10.9±4.9 years with the range 5-18 years; the Unified Parkinson’s Disease Rating Scale motor score (UPDRS-3) in the off/on state was 58.7± 7.9/28.9 ± 10.4 respectively. Nine patients had bilateral procedures; one underwent a planned unilateral STN implantation. All patients tolerated the procedure well. There were no severe complications associated with the surgeries. There were no hemorrhages, new/persistent neurological deficit, prolonged hospitalizations, and/or infection related to the DBS hardware. Intraoperative macrostimulation of the DBS leads up to 4-5 Volts was effective in all subjects. The mean number of tracks was 1.3±0.5 on the left and 1.2±0.4 on the right. The average number of kinesthetic responses were 2.8±0.6 on the left side and 2.8±0.7 on the right. The placement of the DBS leads was verified by postoperative imaging (Fig. 1). The mean and sd location of the bottom of the zero contact of the DBS lead was: left/right: x =11.4±0.39/11.06±0.64, y = -2.8±1.69/-2.51±1.06, z = -3.46±2.81/-3.92±1.06 mm relative to midcommisural point.
Figure 1.
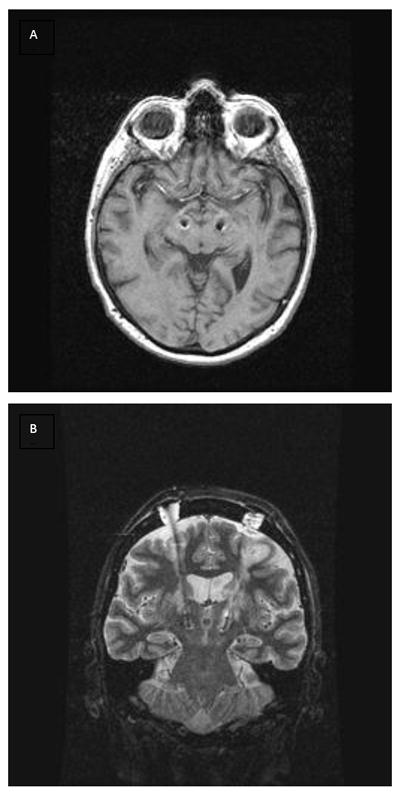
An example of the post-operative imaging with implanted DBS leads. Axial (A) and coronal (B) images showed the DBS leads inside the STN at both sides. Data from subject #5.
Clinical efficacy of DBS was confirmed in all subjects. Levodopa equivalent (mean±sd) was 934.7±410.1 before the surgery and 716.1±257.0 after the surgery. Based on anatomical atlas [13], the active contact with the best response in DBS programming was near the zona incerta - STN interface (typically active contact 2 or 3, depending upon the length of the STN) in 10 STNs and within the STN (usually contact 1 or 2) in the remaining STNs. Fig.2 shows a typical 10-second segment of neuronal data from the STN (upper panel) and the details of a single spike that was removed while the neuronal background was preserved (lower panel).
Figure 2.
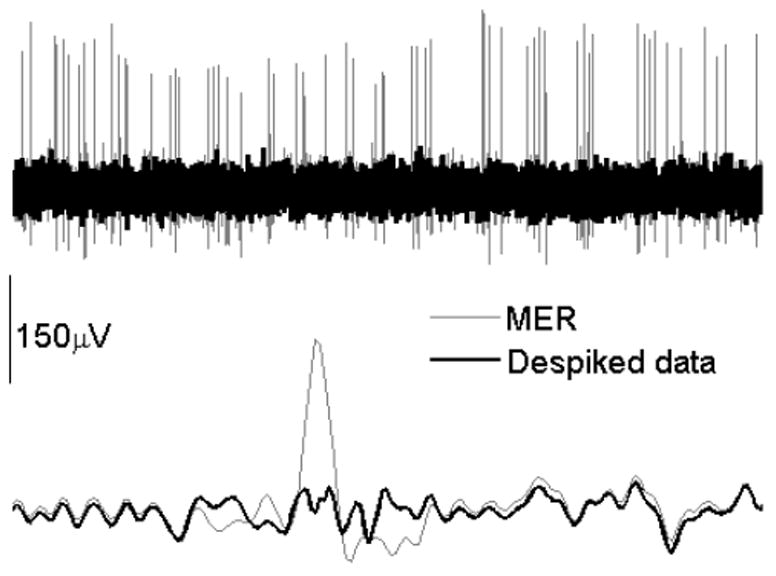
Example of a raw MER and data despiking. Upper panel shows one second of the STN activity superimposed upon the despiked neuronal activity. Lower panel (duration of the signal is 0.007 sec) shows a single spike that was detected and removed from the neuronal signal.
A total 51 tracks were recorded. An optimal length of STN was detected in 36 tracks. Fifteen tracks were considered suboptimal based on the IOM criteria. Here the STN was either missed or the STN length was too small. All of these 15 suboptimal tracks were also determined to be less optimal using QD. In a typical optimal track, the MUA abruptly increased compared to the thalamic/zona incerta activity as the electrode penetrated the dorsal border of the STN (Fig 3). The MUA level varied within the STN but typically remained above the thalamic/zona incerta level.
Figure 3.
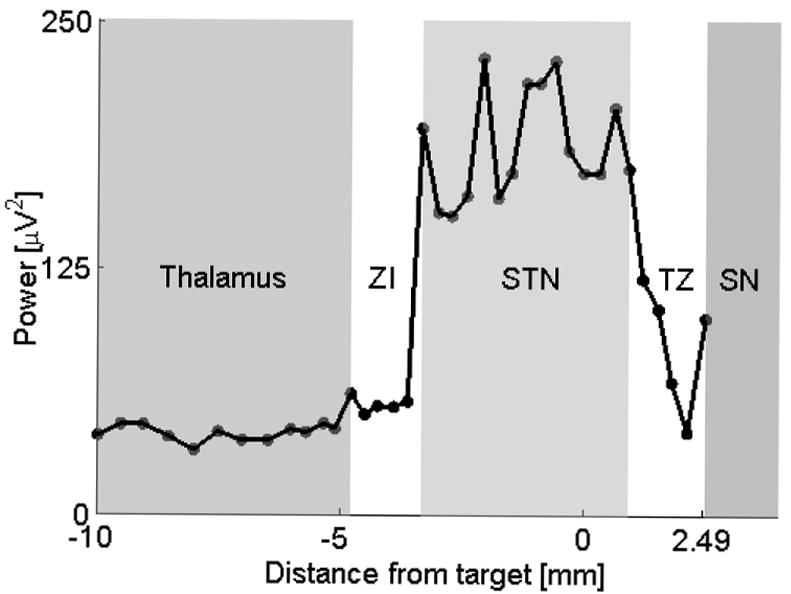
A typical profile of MUA during DBS surgery. The advancing microelectrode moves from left to right towards the anatomical target that is at 0 mm on the x axis. The microelectrode crosses the thalamus, the zona incerta (ZI), STN and the substantia nigra (SN). There is usually a transient zone (TZ) with fluctuating MUA between the STN and SN. The ZI region tends to be variable. Each dot corresponds to an average MUA obtained from 10 seconds of MER. Data from subject #6, right STN.
The MUA then decreased as the microelectrode exited the STN. Examples of MUA activity in various optimal and suboptimal tracks overlaid with the IOM are shown in Figures 4-7. Coordinates of dorsal and ventral borders obtained by both methods are shown in Table 1 (supplementary material) and in Figure 8. The mean differences between IOM and QD of the dorsal/ventral border were 0.31±0.84/0.44±0.47 mm. The largest difference between the two methods was in the estimation of the left STN borders in subject #7, Table 1. The MUA profile with raw MER data of this subject is shown in Figure 9 (supplemental material).
Figure 4.
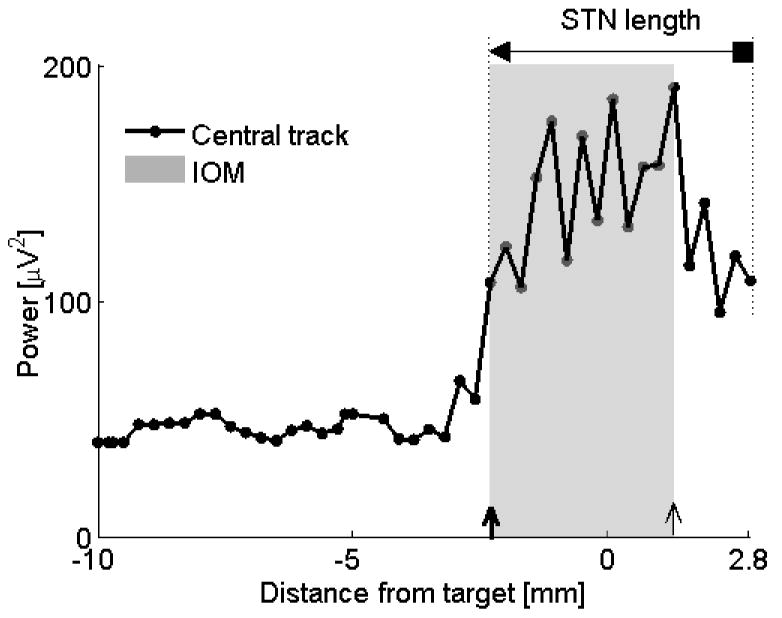
Comparison IOM and QD. In this subject (#10, left STN), the dorsal STN borders obtained by both methods were identical at depth 2.3 mm above the anatomical target. The ventral border obtained by IOM was 1.6 mm below the anatomical target but according to the QD the microelectrode never left the STN and therefore the ventral border was assigned at the deepest MER at 2.8 mm below the anatomical target. ◄ = dorsal border using QD, ■ = ventral border using QD;
 = dorsal border using IOM, ↑ = ventral border using IOM. Shaded rectangle demarcates the STN derived from the IOM.
Figure 7.
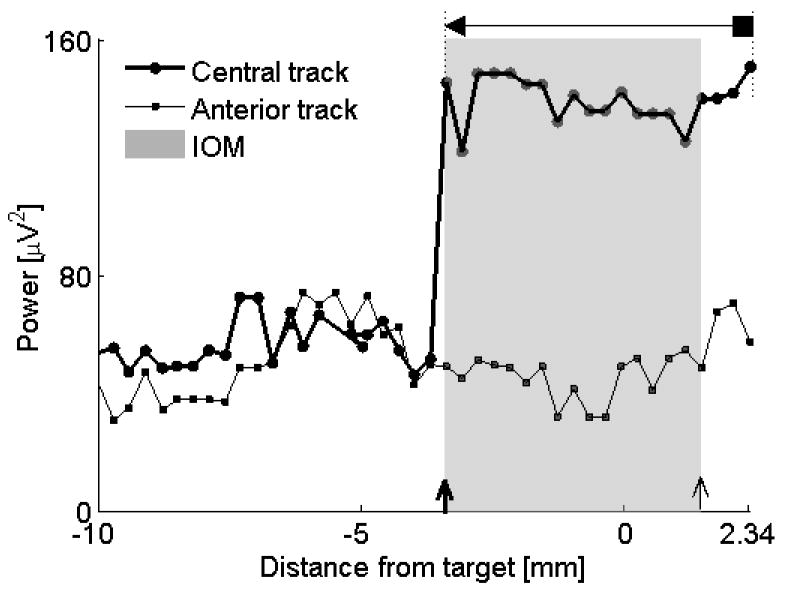
Example of a track that missed the target, subject #9, left STN. The anterior track missed the STN using both IOM and QD criteria. The microelectrode in the central track entered the STN and captured the optimal STN length (4.8 mm using IOM, 5.74 mm using QD). The dorsal borders were identical compared the IOM with the QD. According to the QD, the microelectrode never exited the STN. For descriptions of markers see legend to Figure 4. Data from subject #9, left STN.
Figure 8.
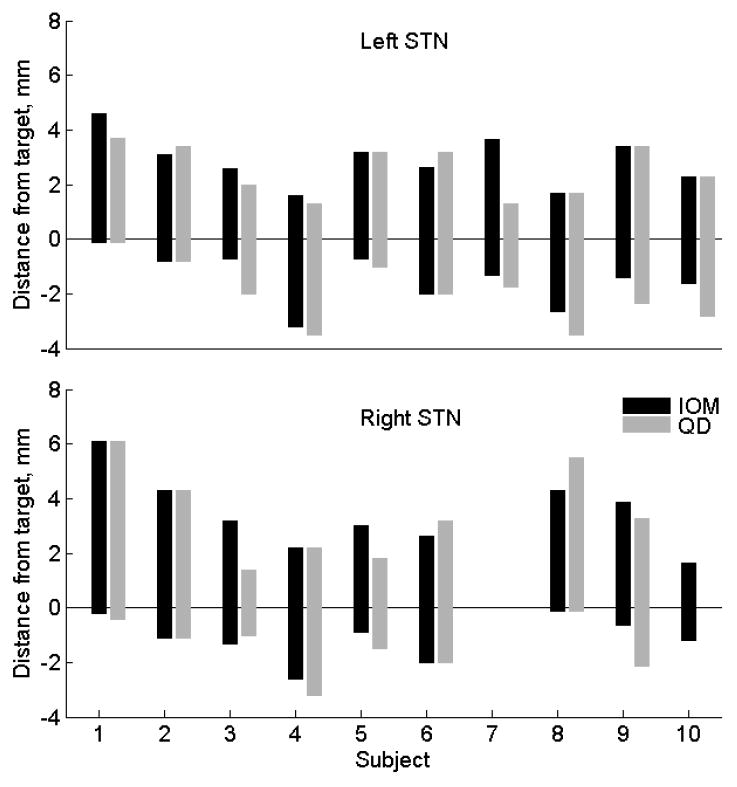
Comparisons of the STN detection by IOM and QD. Each bar represents localization of the STN in one subject. The top of each bar corresponds to the STN entry (dorsal border) and the bottom of the bar corresponds to the exit from the STN (ventral border). The values above the anatomical target (at 0 mm) are positive, values below the target are negative. Only the best track is shown when simultaneously recording more than one track.
For the Bland-Altman statistic, we considered the threshold quality two standard deviations of differences between both methods. Then only 2/36 (5.6%) differences (one for the dorsal border and one for the ventral border) exceeded of ±2 sd line of measurement differences. These results can be interpreted that both methods are in reasonable agreement [15]. Correlation between dorsal/ventral border positions obtained by IOM and QD was 0.79, p<0.0001/0.91, p<0.0001.
4. Discussion
This study directly compared IOM with QD in localization of the STN. Both methods were in reasonable agreement and were strongly correlated. These results indicate that the assessment of the STN borders using QD is not only objective but also accurate. The main strength of our study is its prospective nature. Hence the risk for experimental bias was greatly reduced compared to our previous retrospective study [9]. QD appears to be robust, as indicated by the fact that there were no false positive detections of the STN and there was 100 % agreement in missed tracks using both methods. QD detection can operate regardless of the ability to detect, isolate and hold for longer time single unit activity that is necessary for IOM. The results of QD are available within hundreds of milliseconds and the algorithm can be easy implemented in real time. Our study suggests that 10 seconds of MER is adequate for the STN localization using QD. This is a much shorter period than a consensus of experts that for IOM recommends MER duration equal to one minute at a particular depth [2]. In our protocol, we typically obtain 65 recording sites per track. Thus QD may shorten DBS surgeries by at least 1 hour for each STN pass compared to IOM. However, it is unclear how the shorter surgical time and this methodology affects the outcome. A comparative study (IOM versus QD) can answer this question. Another substantial advantage of QD is that it enables direct and easy comparison of different tracks by simple overlaying of the MUA plots.
QD offers high resolution. We arbitrarily recorded the MUA in 0.3 mm steps when the microelectrode was in close proximity to target. Such a high degree of resolution can be even further increased by selecting smaller steps theoretically down to range of micrometers; however, its clinical value remains to be proven. The DBS active contacts are of size equal to 1.5 mm and are spaced 0.5 – 1.5 mm apart; therefore submillimeter resolution at this time may not give any significant advantage in DBS programming. Nevertheless, high resolution can play a role in feature studies with new stimulation modalities or more advanced DBS leads.
In several subjects the STN borders could only be assigned within a certain range instead of being assigned to an exact position of the microelectrode by the IOM. The QD removed these ambiguities. For example, the transient subjective increase of the neuronal activity at the entry of the STN zone could be due to focally increased thalamic activity, or due to activation of neurons within the white matter, or due injury potentials or it may signify being in close proximity to the STN. The QD is less sensitive to sudden changes in the focal neuronal activity in close proximity to the microelectrode because of the despiking of neuronal signals (see Fig. 9). For those reasons, QD may be more accurate than IOM. The greatest difference between both methods was in subject #7 where the IOM assigned the depth of the left dorsal borders at 3.66 mm while the QD at 1.31 mm above the anatomical target. Postoperative review of MER showed that IOM misidentified injury potentials outside the STN as the STN entry zone.
In general, there was good agreement between both methods in estimation of the dorsal STN borders. There was, nevertheless, some disagreement between both methods in the estimation of the ventral borders. For example, in several STNs the IOM indicated that the microelectrode exited the STN, but according to the QD criteria, the microelectrode was still within the STN. In all of these cases, the length of the STN was more than 3.5 mm at the deepest position of the microelectrode and thus the DBS lead would still effectively be placed so that the active contact would be in the dorsal STN. The best therapeutic benefit is usually achieved with electrode contacts near the dorsal border of the STN [16].
Although IOM remains the gold standard in the STN localization, there are several studies indicating that non-single unit techniques may also be reliable enough. For example, a root mean square (RMS) of MER, a measure of signal power, is elevated within the STN and may be used for STN localization [7]. However, RMS is sensitive to foreground spikes. Therefore, although increasing in spiking is characteristically seen in the STN, any active cell outside the STN, for example injury potentials, can mimic STN and thus elevate RMS. To avoid spurious detection of the STN, RMS was combined with Bayesian a priory probabilities. This combination resulted in remarkable concordance between RMS-based measures and IOM [7]. Another study focused on the elevated neuronal background as a marker of the STN [5]. The background was extracted using a wavelet-derived method that also included despiking. In contrast to our method, the local field potentials (< 500 Hz) were not filtered out. Our algorithm offers advantages over the above studies as we removed foreground spikes to avoid spurious STN detection and we filtered out LFP’s which are often vulnerable to electrical interference in the operating room and tremor artifact. Our previous study [9] (unpublished data) compared the QD with and without despiking and found that despiking markedly improved the QD performance and reduced the spurious STN detections.
Entirely different approach relying on semi-microelectrode recordings was also found to be effective [10]. Microelectrodes are inherently sensitive to bending, structural damage and resulting changes of impedance that can alter the MUA estimation. Semi-microelectrodes are stronger and despiking is not necessary because of their lower impedance they cannot record single-units. The use of semi-microelectrodes and filtering out MUA (> 500 Hz) enabled to perform DBS surgery in generalized anesthesia completely eliminating IOM [10]. A comparison studies using semi-microelectrodes versus microelectrodes should be performed to confirm the clinical value of the semi-microelectrodes especially because semi -microelectrode recordings may have inferior spatial resolution compared to the microelectrode recordings [17].
There are several concerns regarding the QD. As with most of the signal processing methods, substandard signals corrupted by noise, interference and tremor can give spurious results. In fact, we could not analyze the right MER from the subject number 10 because of low signal quality due to severe electrical interference in the operating room that day. In conclusion, this study provides additional evidence that the QD can be used for precise and objective localization of the STN. Prospective blinded comparative studies where the DBS lead will be placed using either QD or IOM are needed.
Supplementary Material
Table 1, supplementary material. Localization of the STN using IOM and QD. All values are in mm and designate the distance from the target. Subject #7 had only left STN implantation. Data from the right STN implantation of subject #10 were excluded from MUA analyses due low signal quality.
Figure 9, supplementary material. In this subject (#7, left STN) , there was the largest discrepancy between the IOM and QD in determination of the dorsal border. Upper panel shows the profile of MUA where labels A-E correspond to the raw MER data at panels A-E. IOM assigned the dorsal border at the depth B (3.66 mm above the target) while the QD at the depth E (1.31 mm above the target). A represents a MER data at the thalamic level. The IOM assigned the dorsal border at the depth B because of subjectively increased signal background. This was believed to be confirmed by increased spiking noted at the depth C. However, despiked MUA remained flat until the depth E. Retrospectively, it became clear that the spikes at the depth C were injury potentials. Note also the reduced MUA at the central track at the depth B that is also consistent with IOM failure at that depth.
Figure 5.
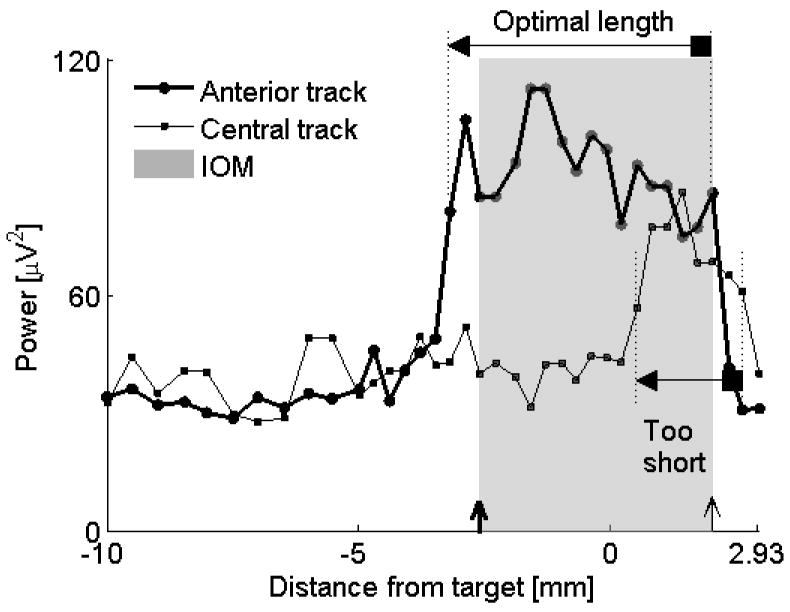
Comparison of optimal and suboptimal tracks. The anterior track gave the optimal length of the STN using both IOM and QD (4.6 versus 5.2 mm). The microelectrode at the central track entered the STN at a much deeper point (0.51 mm below the anatomical target) compared to the microelectrode in the anterior track (3.2 mm above the target). Only a small portion of the STN was captured by the central track. For descriptions of markers see legend to Figure 4. The shaded rectangle applies for the anterior track. Data from subject #6, left STN.
Figure 6.
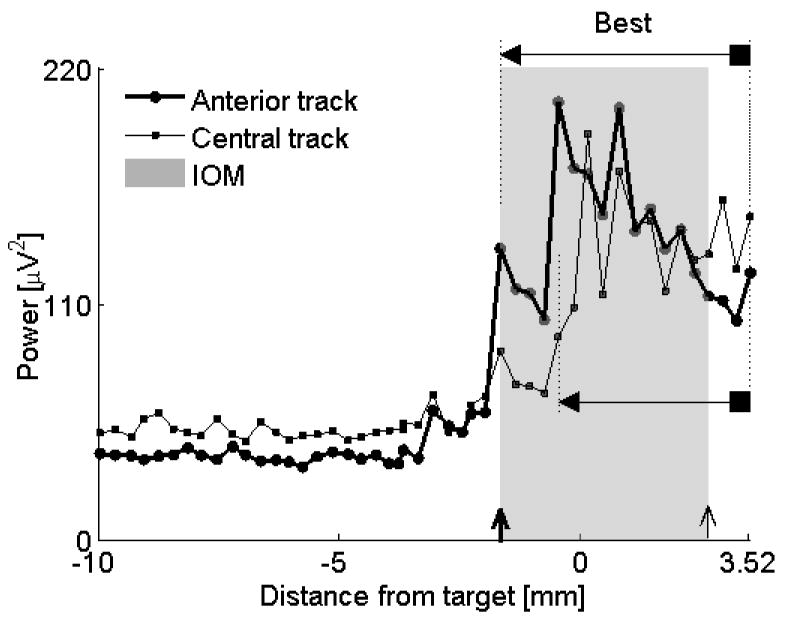
Comparison of two similar tracks. Both anterior and central tracks assign reasonable length to the STN (anterior track = 5.2 mm, central track = 3.98 mm). It was not straightforward using IOM, the golden standard, to decide which track was more optimal. QD shows that the microelectrode in the anterior track entered the STN first while the central track microelectrode entered the STN after advancing the drive deeper by 1.2 mm. Overlay of the MUA of both tracks confirmed that the longer portion of the STN was captured by an anterior track (“Best”). Note also that the MUA remains elevated at the end of recording at the electrode depth 3.52 mm, indicating that the microelectrode was still within the STN. Further advancement of the microelectrode was not done because the sufficient length of the STN has already been captured. For descriptions of markers see legend to Figure 4. Data from subject #8, left STN.
Acknowledgments
The study was funded by NIH #1R43NS064640-01.
Footnotes
Publisher's Disclaimer: This is a PDF file of an unedited manuscript that has been accepted for publication. As a service to our customers we are providing this early version of the manuscript. The manuscript will undergo copyediting, typesetting, and review of the resulting proof before it is published in its final citable form. Please note that during the production process errors may be discovered which could affect the content, and all legal disclaimers that apply to the journal pertain.
Contributor Information
Peter Novak, Dept. of Neurology, University of Massachusetts Medical School.
Andrzej W. Przybyszewski, Dept. of Neurology, University of Massachusetts Medical School, andrzej.przybyszewski@umassmed.edu.
Andrei Barborica, Inc. Bowdoin, ME, abarborica@fh-co.coms.
Paula Ravin, Dept. of Neurology, University of Massachusetts Medical School, ravinp@ummhc.org.
Lee Margolin, Inc. Bowdoin, ME , lmargolin@fh-co.com.
Julie G. Pilitsis, Dept. of Neurosurgery, University of Massachusetts Medical School, jpilitsis@yahoo.com.
References
- 1.Benabid AL, Chabardes S, Mitrofanis J, Pollak P. Deep brain stimulation of the subthalamic nucleus for the treatment of Parkinson’s disease. Lancet Neurol. 2009;8:67–81. doi: 10.1016/S1474-4422(08)70291-6. [DOI] [PubMed] [Google Scholar]
- 2.Marceglia S, Mrakic-Sposta S, Tommasi G, Bartolomei L, Foresti C, Valzania F, Galati S, Stefani A, Tamma F, Priori A. DBS Study Group of The Italian Neurological Society. Multicenter study report: electrophysiological monitoring procedures for subthalamic deep brain stimulation surgery in Parkinson’s disease. Neurol Sci. 2010;31:449–457. doi: 10.1007/s10072-010-0254-0. [DOI] [PubMed] [Google Scholar]
- 3.Benazzouz A, Breit S, Koudsie A, Pollak P, Krack P, Benadib AL. Intraoperative microrecordings of the subthalamic nucleus in Parkinson’s disease. Mov Disord. 2002;17:S145–S149. doi: 10.1002/mds.10156. [DOI] [PubMed] [Google Scholar]
- 4.Pesenti A, Rohr M, Egidi M, Rampini P, Tamma F, Locatelli M, Caputo E, Chiesa V, Bianchi A, Barbieri S, Baselli G, Priori A. The subthalamic nucleus in Parkinson’s disease: power spectral density analysis of neural intraoperative signals. Neurol Sci. 2004;24:367–374. doi: 10.1007/s10072-003-0191-2. [DOI] [PubMed] [Google Scholar]
- 5.Snellings A, Sagher O, Anderson DJ, Aldridge JW. Identification of the subthalamic nucleus in deep brain stimulation surgery with a novel wavelet-derived measure of neural background activity. J Neurosurg. 2009;111:767–774. doi: 10.3171/2008.11.JNS08392. [DOI] [PMC free article] [PubMed] [Google Scholar]
- 6.Kano T, Katayama Y, Kobayashi K, Kasai M, Oshima H, Fukaya C, Yamamoto Detection of boundaries of subhtalamic nucleus by multiple-cell spike density analysis in deep brain stimulation for Parkinson’s disease. Acta Neurochir Suppl. 2006;99:33–35. doi: 10.1007/978-3-211-35205-2_6. [DOI] [PubMed] [Google Scholar]
- 7.Moran A, Gad IB, Bergman H, Israel Z. Real-time refinement of subthalamic nucleus targettin using Bayesian decision-making on the root mean square measure. Mov Disord. 2006;21:1425–1431. doi: 10.1002/mds.20995. [DOI] [PubMed] [Google Scholar]
- 8.Logothetis NK. The underpinning of the BOLD functional magnetic resonance imaging signal. J Neurosci. 2003;15:3963–3971. doi: 10.1523/JNEUROSCI.23-10-03963.2003. [DOI] [PMC free article] [PubMed] [Google Scholar]
- 9.Novak P, Daniluk S, Ellias SA, Nazzaro JM. Detection of the subthalamic nucleus in microelectrographic recordings in Parkinson disease using the high-frequency (> 500 hz) neuronal background. Technical note. J Neurosurg. 2007;106:175–179. doi: 10.3171/jns.2007.106.1.175. [DOI] [PubMed] [Google Scholar]
- 10.Shin M, Lefaucheur JP, Penholate MF, Brugières P, Gurruchaga JM, Nguyen JP. Subthalamic nucleus stimulation in Parkinson’s disease: postoperative CT-MRI fusion images confirm accuracy of electrode placement using intraoperative multi-unit recording. Neurophysiol Clin. 2007;37:457–466. doi: 10.1016/j.neucli.2007.09.005. [DOI] [PubMed] [Google Scholar]
- 11.Hughes AJ, Daniel SE, Kilford L, Lees AJ. Accuracy of clinical diagnosis of idiopathic Parkinson’s disease: a clinico-pathological study of 100 cases. J Neurol Neurosurg Psychiatry. 1992;55:181–184. doi: 10.1136/jnnp.55.3.181. [DOI] [PMC free article] [PubMed] [Google Scholar]
- 12.Benabid AL, Chabardes S, Mitrofanis J, Pollak P. Deep brain stimulation of the subthalamic nucleus for the treatment of Parkinson’s disease. Lancet Neurol. 2009;8:67–81. doi: 10.1016/S1474-4422(08)70291-6. [DOI] [PubMed] [Google Scholar]
- 13.Schaltenbrand G, Wahren W. Atlas for stereotaxy of the human brain. Stuttgart: Georg Thieme; 1977. [Google Scholar]
- 14.Donoho DL. De-Noising by soft-thresholding. IEEE Transactions on information theory. 1995;41:613–627. [Google Scholar]
- 15.Bland JM, Altman DG. Statistical methods for assessing agreement between two methods of clinical measurement. Lancet. 1986;1:307–310. [PubMed] [Google Scholar]
- 16.Maks CM, Butson CR, Walter BL, Vitek JL, McIntyre CC. Deep brain stimulation activation volumes and their association with neurophysiological mapping and therapeutic outcomes. J Neurol Neurosurg Psychiatry. 2009;80:659–666. doi: 10.1136/jnnp.2007.126219. [DOI] [PMC free article] [PubMed] [Google Scholar]
- 17.Garonzik IM, Sherwin EH, Ohara S, Lenz FA. Intraoperative microelectrode and semi-microelectrode recording during the physiological localization of the thalamic nucleus ventral intermediate. Movement Disorders. 2002;17:S135–144. doi: 10.1002/mds.10155. [DOI] [PubMed] [Google Scholar]
Associated Data
This section collects any data citations, data availability statements, or supplementary materials included in this article.
Supplementary Materials
Table 1, supplementary material. Localization of the STN using IOM and QD. All values are in mm and designate the distance from the target. Subject #7 had only left STN implantation. Data from the right STN implantation of subject #10 were excluded from MUA analyses due low signal quality.
Figure 9, supplementary material. In this subject (#7, left STN) , there was the largest discrepancy between the IOM and QD in determination of the dorsal border. Upper panel shows the profile of MUA where labels A-E correspond to the raw MER data at panels A-E. IOM assigned the dorsal border at the depth B (3.66 mm above the target) while the QD at the depth E (1.31 mm above the target). A represents a MER data at the thalamic level. The IOM assigned the dorsal border at the depth B because of subjectively increased signal background. This was believed to be confirmed by increased spiking noted at the depth C. However, despiked MUA remained flat until the depth E. Retrospectively, it became clear that the spikes at the depth C were injury potentials. Note also the reduced MUA at the central track at the depth B that is also consistent with IOM failure at that depth.


