

Abstract
Motor theories of speech perception have been re-vitalized as a consequence of the discovery of mirror neurons. Some authors have even promoted a strong version of the motor theory, arguing that the motor speech system is critical for perception. Part of the evidence that is cited in favor of this claim is the observation from the early 1980s that individuals with Broca’s aphasia, and therefore inferred damage to Broca’s area, can have deficits in speech sound discrimination. Here we re-examine this issue in 24 patients with radiologically confirmed lesions to Broca’s area and various degrees of associated non-fluent speech production. Patients performed two same-different discrimination tasks involving pairs of CV syllables, one in which both CVs were presented auditorily, and the other in which one syllable was auditorily presented and the other visually presented as an orthographic form; word comprehension was also assessed using word-to-picture matching tasks in both auditory and visual forms. Discrimination performance on the all-auditory task was four standard deviations above chance, as measured using d’, and was unrelated to the degree of non-fluency in the patients’ speech production. Performance on the auditory-visual task, however, was worse than, and not correlated with, the all-auditory task. The auditory-visual task was related to the degree of speech non-fluency. Word comprehension was at ceiling for the auditory version (97% accuracy) and near ceiling for the orthographic version (90% accuracy). We conclude that the motor speech system is not necessary for speech perception as measured both by discrimination and comprehension paradigms, but may play a role in orthographic decoding or in auditory-visual matching of phonological forms.
The discovery of mirror neurons in the monkey motor system, which are claimed by some to support action understanding (Rizzolatti & Craighero, 2004), has led to a resurrection of the motor theory of speech perception (D’Ausilio et al., 2009b; Fadiga & Craighero, 2006; Pulvermuller et al., 2006). The motor theory of speech perception holds that recognition of speech sounds relies on mapping acoustic speech input onto motor speech representations in the listener (Liberman, 1957; Liberman, Cooper, Shankweiler, & Studdert-Kennedy, 1967; Liberman & Mattingly, 1985). Despite the fact that a strong version of the motor theory has been all but abandoned by speech scientists (Galantucci, Fowler, & Turvey, 2006), some neuroscientists still promote such a view. For example, Fadiga and Craighero write, “Liberman’s intuition … that the ultimate constituents of speech are not sounds but articulatory gestures … seems to us a good way to consider speech processing in the more general context of action recognition” (Fadiga & Craighero, 2006) p. 489. Consistent with this claim, recent functional imaging and transcranial magnetic stimulation (TMS) work has found that the motor speech system is indeed activated during speech listening (Watkins, Strafella, & Paus, 2003; Wilson, Saygin, Sereno, & Iacoboni, 2004) and TMS interference of motor cortex has been reported to modulate speech perception under some conditions (D’Ausilio et al., 2009b; Meister, Wilson, Deblieck, Wu, & Iacoboni, 2007; Watkins & Paus, 2004).
However, none of these studies provide a conclusive assessment of the causal role of the motor speech system in speech perception1 (Hickok, 2009, 2010; Lotto, Hickok, & Holt, 2009). Functional neuroimaging is purely correlative, making it impossible to determine causality, and the TMS studies to date have demonstrated only very subtle effects on perception. For example, TMS induced modulations have only been reported for partially ambiguous stimuli (speech in noise or category boundary stimuli in a speech continuum) and the effect sizes are relatively small (~10% performance modulation); it is impossible to know whether this is a methodological limitation or an accurate reflection of the effect size.
Stronger evidence of a causal relationship between motor speech systems and the ability to perceive speech sounds is potentially available from lesion studies. Specifically, if the motor system is critical for the perception of speech sounds, then damage to the motor speech system should have a substantial impact on the ability to perceive speech. Research on aphasic patients conducted in the 1970s and 1980s appears to provide this critical evidence and is often cited by those promoting a critical role for the motor system in speech perception (D’Ausilio et al., 2009a; Wilson, 2009). For example, Basso and colleagues (Basso, Casati, & Vignolo, 1977) report that 74% of aphasics were impaired on a phoneme identification task and further that the incidence of impairment was greater for non-fluent aphasics (91% of patients) than fluent aphasics (72% of patients). However, another study of non-fluent Broca’s aphasics reports only a mild deficit if any (~93% accuracy for the most difficult contrasts) on syllable discrimination2 (Baker, Blumsteim, & Goodglass, 1981)3. However, these early studies did not have the benefit of modern neuroimaging methods and therefore could not reliably rule out cases with multiple or bilateral lesions, hemorrhagic stroke, and so on. In addition, these studies used percent correct as their dependent measure, which is subject to response bias, rather than a measure that controls for bias, such as d’ (Green & Swets, 1966). It is therefore unclear whether the reported deficits are due to damage to the motor speech system and/or reflect perceptual discrimination or response bias.
One clue regarding the possibility of bias in these early measurements comes from a study (Baker et al., 1981) in which the data were reported separately for same and different trials in a discrimination task. Reading from their Figure 1, it is clear that for the more difficult place contrast discrimination, Broca’s aphasics are more than 4 times more likely to err on different than same trials, indicating a bias to say “same”. From the graphed values it is possible to calculate d’ and bias measures which indicate good discrimination performance (d’ = 3.78) with a bias to respond “same” (c = .38).4
Figure 1.
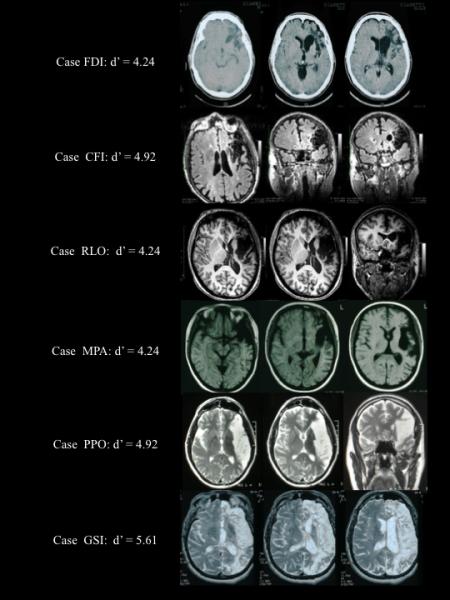
Brain lesions in five participants showing damage to Broca’s area and surrounding tissue. As is clear from these images, sometimes the lesions were quite extensive. Syllable discrimination performance (d’) for each of these participants the auditory-auditory (A-A) task is also provided. Despite extensive lesions, performance was excellent: none of these subjects made more than 2 errors on the 60 item test and d’ values were all 4.24 or better.
A more recent study re-examined the speech perception ability in a set of five case studies of patients with lesions in Broca’s area (Rogalsky, Love, Driscoll, Anderson, & Hickok, 2011). This study reported at or near ceiling performance (>95% correct) on a battery of word comprehension and syllable discrimination tasks in the two patients with lesions that included frontoparietal regions but spared the temporal lobe. The other three patients had lesions that included temporal cortex, but still performed with better than 95% accuracy on the word comprehension tests. Although this study clearly shows that damage to motor speech systems does not cause significant deficits in receptive speech ability, the small sample size limits generalization.
Additional evidence supporting the possibility that frontal lesions and speech production deficits do not predict perceptual deficits comes from another early study that reported a dissociation between perception and production of the voice onset time feature in speech sounds (Blumstein, Cooper, Zurif, & Caramazza, 1977). In this study, 4 out of 5 Broca’s aphasics exhibited normal ability to discriminate VOT despite deficits in producing VOT accurately. Specifically, in these subjects, good VOT discrimination did not correlate with the ability to produce VOT, as they frequently produced phonetic distortions (i.e., VOT values that fell in an intermediate voiced/voiceless range), and less frequently phonemic substitutions (i.e., sounds that were clear voiced <-> voiceless substitutions). But again, the small sample size limits generalization.
The present study sought to revisit the role of the motor speech system in speech perception in a larger series of patients with radiologically confirmed damage to the motor speech system, defined minimally as damage involving Broca’s area.
Methods
Subjects
All of 54 subjects in the patient registry of one of us (GM) were evaluated for damage involving at least a portion of Broca’s region, defined as the pars opercularis and pars triangularis, with 28 cases identified. Patients were excluded if the lesions were caused by traumatic brain injury (N=1), were hemorrhagic (N=1), bilateral (N=1), or in the right hemisphere (N=1) thus leaving 24 cases. All but one of these cases were non-fluent in their speech production. Clinical categorization was consistent with Broca’s aphasia for 19 cases, on the border between Broca’s and conduction aphasia in 5, and conduction aphasia in 1 (the fluent patient). Relevant biographical information is provided in Table 1. An additional group of 13 patients with lesions in the distribution of the left posterior cerebral artery, affecting mesial temporal-occipital regions, were tested as controls; one of these subjects was left handed and therefore was excluded, leaving a total of 12 subjects.
Table 1.
Essential biographic information and degree of dysfluency for each participant.
| Initials | Gender | Age | Years of education |
Etiology | Time post-onset |
Fluency |
|---|---|---|---|---|---|---|
| DAV | M | 47 | 17 | L ICVA | 3 mos | NF +++ |
| DBO | M | 40 | 17 | L ICVA | 72 mos | NF +++ |
| CCO | M | 54 | 10 | L ICVA | 23 mos | NF ++ |
| CDS | F | 43 | 13 | L ICVA | 55 mos | NF +++ |
| FDI | M | 43 | 18 | L ICVA post- aneurysm |
45 mos | NF + |
| CFI | M | 55 | 8 | L ICVA | 19 mos | NF ++ |
| FGI | M | 69 | 8 | L ICVA | 9 mos | NF + |
| GGI | M | 61 | 13 | L ICVA | 48 mos | NF + |
| TGU | F | 41 | 11 | L ICVA post- aneurysm |
24 mos | NF +++ |
| RLO | F | 38 | 17 | L ICVA | 26 mos | NF ++ |
| AMA | F | 67 | 13 | L ICVA | 3 mos | NF + |
| MNE | M | 43 | 13 | L ICVA | 213 mos | NF ++ |
| INI | F | 55 | 8 | L ICVA | 30 mos | NF ++ |
| MPA | F | 29 | 13 | L ICVA | 6 mos | NF ++ |
| VPI | F | 44 | 13 | L AVM | 6 mos | NF + |
| PPO | M | 52 | 13 | L ICVA | 13 mos | NF + |
| DRU | F | 50 | 5 | L ICVA | 3 mos | NF + |
| GSI | M | 59 | 17 | L ICVA | 4 mos | NF ++ |
| PST | F | 74 | 8 | L ICVA | 4 mos | NF + |
| FTE | F | 31 | 15 | L ICVA | 49 mos | NF ++ |
| MTO | F | 48 | 13 | L ICVA | 4 mos | F |
| UTO | M | 74 | 18 | L ICVA | 4 mos | NF + |
| FVA | F | 43 | >18 | L ICVA post- meningioma |
8 mos | NF ++ |
| GZA | M | 44 | 13 | L ICVA | 28 mos | NF +++ |
L= left; ICVA= ischemic cerebrovascular accident; AVM= artero-venous malformation; F = fluent; NF = non fluent; + = mild; ++ = moderate; +++ = severe
Lesion reconstruction
This study reports on patients referred to clinical services, and tested over a 10-year time span. Therefore, the quality of neuroradiological documentation differs greatly across subjects, ranging from MPRAGE protocols to “good quality” images. Only cases with sufficiently detailed MRI documentation (ie, axial, coronal and sagittal slices) as to allow accurate lesion reconstruction were included. Lesions were individually reconstructed by GM and RC, with reference to atlases that allowed the best correspondence between published brain sections and the images available for each subject. The following atlases were used: (Damasio, 2005; Duvernoy, 1999; Mai, Assheuer, & Paxinos, 2004). Disagreements were resolved by discussion. Sample brain images from 5 participants are presented in Figure 1.
Materials and Methods
The tasks described here were part of a larger battery of tasks designed to assess receptive and productive speech and writing abilities in aphasic patients (Miceli, Laudanna, Burani, & Capasso, 2004). We focus here on same-different discrimination tasks involving non-word CV syllables and word comprehension tasks.
The stimuli for the discrimination tasks consisted of six stop consonant CV syllables (/pa/, /ta/, /ka/, /ba/, /da/, /ga/). The stimuli for the two word comprehension tasks consisted of 40 picture pairs (N=40 for each task), representing the target word and a phonological/orthographic foil (N=20 for each task), or the target and a semantic foil (N=20 for each task). Each pair was presented on a computer screen at the same time as a recorded/printed word that corresponded to the target. In each task, phonologically related and semantically related picture pairs were presented in random order. The auditory syllables were recorded by a female speaker (a professional voice coach) and equalized for pitch, intensity and duration. The same speaker recorded also the word stimuli of the auditory word comprehension task. All auditory stimuli were delivered via speakers at a comfortable listening level. Testing was conducted in a quiet room.
Auditory-auditory (A-A) discrimination task
The six syllables were used to construct stimuli for an auditory same-different phoneme discrimination task. The test involved 60 trials, half of which were same pairs and half were different pairs. For “same” trials, the same syllable was presented twice and therefore totaled 5 trials for each of the six CVs. For “different” trials, two different CVs were presented; the syllables differed by voicing (n=10), place of articulation (n=10), or both (n=10). The two syllables in each pair were presented with a 1-second interstimulus interval. Subject responded by saying Yes if they thought the two syllables were identical, No if they thought they were different or, if they preferred, by pointing to the word Yes or No written on the computer screen. None of the participants had any problems understanding the instructions of the test.
Auditory-visual (A-V) discrimination
A second task was also administered in which subjects were asked to decide whether a spoken and visually presented CV syllable was the same or not. This task also involved 60 trials (30 same, 30 different) with the same distribution of pairings as in the A-A discrimination task. Unlike the all auditory task, here the two syllables were presented simultaneously: one syllable was pronounced by the examiner and the other was presented visually, on a computer screen. The written syllable remained on-screen until the participant felt that he could produce a confident response. Subject responded as in the previous test.
Again, in both of the discrimination tests, the subject’s task was to establish whether the two syllables in a stimulus were the same or different. If the subject was unable to make a decision after the first presentation, a second presentation was allowed. Failure to provide a response after the second presentation was considered as an error.
Auditory word comprehension
Auditory word comprehension was assessed using a two-alternative forced choice paradigm in which the subject heard an auditorily presented word and selected the picture that matched (i.e., that the word named) by pointing to it on the computer screen. There were 40 trials: 20 used pictures that represented the target and a phonological foil that differed from the target by one phoneme (e.g., barca-barba, boat-beard) and 20 used pictures that represented the target and a semantic foil (e.g., divano-tappeto, sofa-carpet). The pictures were displayed vertically to minimize effects of hemispatial neglect. The position of the target was counterbalanced across trials.
Visual word comprehension
Visual word comprehension was identical to the auditory word comprehension test except that the word stimuli were presented visually. The target word appeared at the center of the screen, at the same time as the two alternative pictures, that were arranged vertically, one above and one below the written word. Also in this case, the subject responded by pointing to the picture that corresponded to the target. Twenty picture pairs included the target and an orthographic foil that differed from the target word by one grapheme (collo-pollo, neck-chicken), the other twenty pairs consisted of semantically related pictures (fragola-ciliegia, strawberry-cherry). Target position was counterbalanced across trials.
For analysis, d’ was calculated using the formula for same-different paradigms (Macmillan & Creelman, 2005)
where the z transformation is the inverse of the normal distribution function, thus converting a hit or false alarm rate to a z-score (i.e., to standard deviation units), ϕ is the cumulative normal distribution, H is proportion of hits, and FA is the proportion of false alarms. For observed HR and FA values = 1 or 0 (which would result in a d’ value of infinity) we assumed a 1% “inattention” rate and replaced 1 or 0 values with .995 and .005 respectively (these values are used because on half of the “inattention” trials the subject will guess correctly). Thus, the maximum d’ score achievable was 5.6.
Results
Discrimination tasks
Overall performance in the group with Broca’s area lesions (N=24) on the syllable discrimination task was excellent: mean d’ = 4.18, s.d. = .72, median d’ = 4.25, range d’ = 2.54 - 5.61; mean proportion correct = .94, s.d. = .05. Performance on the auditory-visual discrimination task in the subset of subjects who took this task (N=23) was worse but still well above threshold: mean d’ = 3.40, s.d. = 1.08, median d’ = 3.69, range d’ = 1.09-4.92; mean proportion correct = .87, s.d. = .11. A paired t-test revealed that the difference between the A-A and A-V discrimination tests is reliable (t(21) = 3.54, p = 0.002).
The scatterplot in Figure 2 shows the relation between performance on the A-A and A-V discrimination tests (N=22; two subjects did not take the A-V task). Notice that d’ scores on the A-A discrimination task are predominantly clustered between 4 and 5 with only three patients performing in the 2.5-3 range. Conversely, the d’ scores on the A-V discrimination task spread more evenly across a wider range from 1-5. This full range of scores on the A-V task is evident even within the main cluster of scores (4-5) on the A-A task. In short, there appears to be little relation between A-A and A-V discrimination. A regression analysis confirmed what is visually apparent (r (20) = 0.34, p = 0.12, n.s.); whatever relation that is hinted at with these values evaporates when the one outlier (the subject who is at ceiling on both tests) is removed (r (19) = 0.24, p = 0.30). The fact that performance on these two tasks was not correlated is surprising given that both are commonly used to assess “speech perception”. Apparently, these tasks are tapping non-identical cognitive networks.
Figure 2.
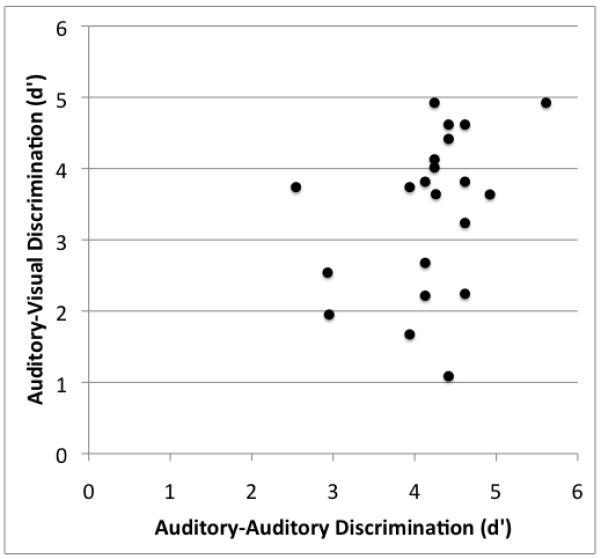
Scatterplot showing the relation between auditory-auditory (A-A) syllable discrimination and auditory-visual (A-V) syllable discrimination in patients with lesions involving Broca’s area. Note that performance on the A-A task clusters at d’ values between 4 and 5, whereas on the A-V task there is greater spread between d’ values between 1 and 5. As is evident from this graph, performance on these two tasks was not significantly correlated.
The syllable discrimination test includes both minimal pair items (syllables differ by a single feature, n=20) and non-minimal pair items (syllables differ by two features, n=10). Because items that are more similar are harder to discriminate, we calculated discrimination performance using only the minimal pair items. Discrimination was still remarkably good: mean d’ = 4.10, s.d. = 0.76, median d’ = 4.13, range d’ = 2.12-5.61; mean proportion correct = .94, s.d. = .05.
In the patients who were non-fluent (N=23), the degree of nonfluency was ranked in terms of severity as mild (N=9), moderate (N=8), or severe (N=6). This ranking was done blind to speech discrimination performance based on spontaneous speech samples collected from each subject. Fluency ratings were used as levels in a one-way ANOVA to explore the effects of fluency on A-A discrimination performance. This analysis revealed no effect of fluency on auditory syllable discrimination (F(2,20) = 0.99, p = .39). This non-effect held for the minimal pair subset as well (F(2,20) = 1.41, p = .27). Figure 3A shows this result graphically.
Figure 3.
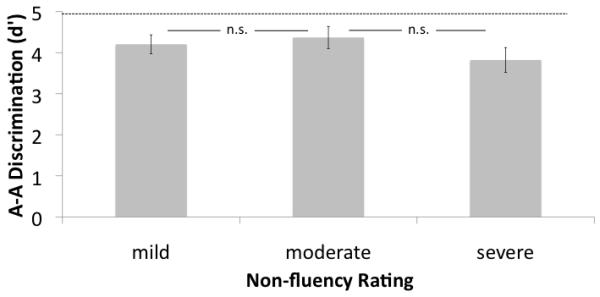
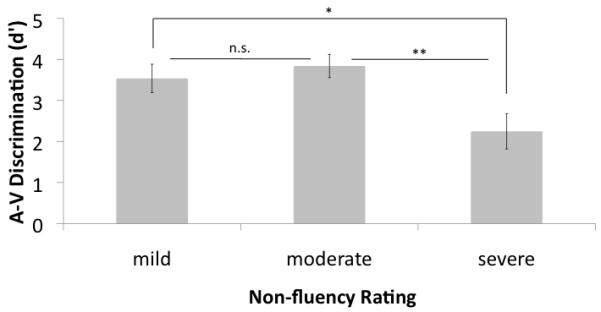
Syllable discrimination (d’) as a function of degree of non-fluency. A. auditory-auditory (A-A) discrimination task. No effects of degree of non-fluency were found. Dashed line represents the mean performance of the medial temporal-occipital lesioned control group B. auditory-visual (A-V) discrimination task. The severely non-fluent group performed significantly more poorly than the other two groups.
While the degree of nonfluency did not affect performance on the A-A discrimination task, it did affect performance on the A-V discrimination task. Non fluent patients who took the A-V discrimination task (N=21) were divided into groups according to their nonfluency ranking: mild (N=8), moderate (N=8), and severe (N=5). These categories were used as levels in a one-way ANOVA to explore the effects of fluency on A-V discrimination performance. This analysis revealed a significant effect of fluency (F(2,18) = 5.01, p = 0.019). Planned contrasts revealed that this effect is primarily due to significantly depressed A-V discrimination performance in the severe non-fluent group relative to both the moderate group (t(11)= 3.24, p= 0.008, 2-tailed) and the mild group (t(11) = 2.33, p = 0.04, 2-tailed) (Figure 3B).
The group of control patients (N=12) with left mesial temporal-occipital lesions performed exceptionally well on the auditory syllable discrimination task (mean d’ = 4.98, s.d. = 0.72, median d’ = 5.27, range d’ = 3.74-5.61; mean proportion correct = .98, s.d., .03). In fact, a two-sample t-test showed that they performed significantly better than the patients with lesions that involved Broca’s area (t(34) = 3.17, p = .003, 2-tailed).
Comprehension tasks
Performance on the auditory word comprehension test was effectively at ceiling (mean proportion correct = 0.97, s.d. = 0.05), whereas it was worse on the visual word comprehension test (mean proportion correct = 0.90, s.d. = 0.10). A paired t-test showed that this difference was highly reliable (t(23) = 4.42, p = 0.0002, 2-tailed). Non-fluency rating did not have a significant effect on either auditory word (F(2,20) = 0.426, p = 0.67) or visual word (F(2,20) = 2.33, p = 0.12) comprehension (Figure 4). Errors were equally distributed across the phonemic and semantic foil trials (p-values > 0.40).
Figure 4.
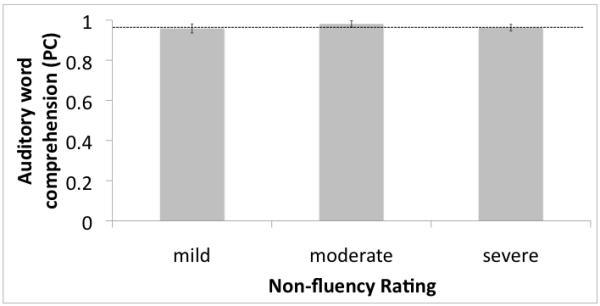

Auditory comprehension (proportion correct) as a function of degree of non-fluency. A. auditory word presentation. No effects of degree of non-fluency were found. Dashed line represents the mean performance of the medial temporal-occipital lesioned control group. B. Visual word presentation. No effects of degree of non-fluency were found..
Patients with Broca’s area lesions performed as well as patients with mesial temporal-occipital lesions on the auditory word comprehension test (proportion correct = 0.97 and 0.96, respectively, t(31) = 0.72, p = 0.48).
Discussion
The present study examined the speech perception ability of a group of 24 patients with damage involving Broca’s area. On the auditory (A-A) discrimination task, performance was excellent overall with mean d’ values above 4.05 even for minimal pair auditory discrimination. This performance level is consistent with a recent small scale study (Rogalsky et al., 2011) as well as with a reanalysis of previously published larger-scale studies (noted above and in (Hickok, 2010)). Our sample of patients was selected on the basis of lesion location -- Broca’s area involvement was a criterion for inclusion -- so that we could assess the claim that Broca’s area is involved in speech perception. But because of this, the speech output fluency of our patients varied from severely non-fluent cases typical of severe Broca’s aphasia to patients with minimal or mild non-fluency. To assess the functional claim that motor speech ability is critical for speech perception, we also assessed the relation between fluency and speech discrimination scores on the assumption that fluency is a measure of the integrity of motor speech system as suggested by the correlation between non-fluent speech and frontal lesions (Kreisler et al., 2000); no effect of fluency was found. From these findings we conclude that neither damage to Broca’s region nor functional disruption of motor speech ability has a dramatic effect on speech perception as measured using a same-different discrimination paradigm.
The high level of discrimination performance in our sample contradicts some previous studies from the older aphasia literature (Basso et al., 1977; Miceli et al., 1980). This could be due to several factors including the use of signal detection methods (although our percent correct values were quite high as well), patient selection and grouping. For example, in our sample we excluded subjects with multiple or hemorrhagic strokes, which likely reduced variance due to more diffuse brain injury. Previous studies grouped patients on the basis of aphasic syndrome (e.g., Broca’s aphasia) and particular symptoms such as phonemic output disorder (Miceli et al., 1980). Lesions associated with these groupings can be highly variable and may have included temporal lobe structures, which would be expected to affect perception somewhat as well as other receptive language functions (Bates et al., 2003; Dronkers, Wilkins, Van Valin, Redfern, & Jaeger, 2004; Rogalsky et al., 2011). Our findings are consistent, however, with some older reports (Baker et al., 1981) as well as more recent studies which report good discrimination performance following lesions involving Broca’s area and surrounds (Caplan, Gow, & Makris, 1995; Rogalsky et al., 2011).
Auditory word comprehension was also well-preserved in patients with Broca’s area lesions. Average performance was at the 97% accuracy level. This too is consistent with previous work (Baker et al., 1981; Miceli et al., 1980; Rogalsky et al., 2011) and with the fact that Broca’s aphasia is defined by well-preserved auditory comprehension, at least at the word level (Damasio, 1992; Goodglass, Kaplan, & Barresi, 2001). We also investigated the relation between auditory comprehension and non-fluency rating and found no effect, as with the all-auditory discrimination task.
The finding that damage to Broca’s area does not yield substantial deficits in speech perception measured using both syllable discrimination and auditory comprehension is consistent with previous work, as noted. However, it contradicts another recent group study that assessed the single word comprehension of Broca’s aphasics and found that, with degraded speech, single word comprehension deficits were associated with Broca’s area lesions (Moineau, Dronkers, & Bates, 2005). However, this study defined their group based on clinical category, Broca’s aphasia, rather than lesion location, which, as noted, could affect the outcome. In addition, this study failed to take response bias into account, using only proportion correct as their dependent measure. Interestingly, they calculated proportion correct in the “same” (match) versus “different” (mismatch) trials and actually found a significant difference in the Broca’s aphasia group, thus demonstrating the presence of response bias: Broca’s aphasics performed better on the different trials than same trials indicating a bias to respond “no”. Given the finding of bias, it is unclear whether the performance correlation with Broca’s area damage resulted from receptive speech deficits or from response bias (Hickok, 2010). Relevant to this point, a recent behavioral study found that fatiguing the vocal motor system by asking subjects to perform repetitive lip or tongue movements affected bias measures in a syllable discrimination task, but did not affect perceptual discriminability (d’) (Sato et al., in press). Further, explicitly manipulating bias by changing the ratio of same to different trials has been found to be correlated with functional activation changes in motor regions in the left hemisphere, including Broca’s area (Venezia, Saberi, & Hickok, 2011). Thus, it seems likely that motor system function contributes more to response bias than to discriminibility.
Performance on the cross-modal auditory-visual (grapheme) discrimination task was somewhat different. Here performance was significantly worse than on the all-auditory discrimination task. Similarly, performance on the visual word comprehension task was found to be significantly worse than on the auditory word comprehension task. Previous studies involving Broca’s aphasics have also found relatively poorer performance on tasks involving orthographic forms compared to auditory stimuli (Baker et al., 1981). Somewhat surprisingly, discrimination scores on the present all-auditory and auditory-visual discrimination tasks were not correlated. The source of the de-coupling between the two tasks is likely attributable to the reading component in the A-V task with the lesions affecting either the ability to read the orthographic forms themselves or the ability to perform cross-modality matching between acoustic-phonetic and orthographic representations. Consistent with this interpretation is the observation that impaired nonword reading has been observed in the presence of damage to perisylvian regions, including prefrontal structures (Cloutman, Newhart, Davis, Heidler-Gary, & Hillis, 2011; Demonet et al., 1992; Philipose et al., 2007; Rapcsak et al., 2009; Xiao et al., 2005). The implication of this finding is that using an auditory-visual grapheme discrimination task may underestimate speech perception ability and indeed may be measuring something other than speech perception.
While the present finding clearly indicates that the ability to perceive speech sounds dissociates from the ability to produce speech, it is also true that discrimination performance was significantly worse in the group with Broca’s area lesions (d’ = 4.18) compared to a control group of patients with lesions in the mesial temporal-occipital region (d’ = 4.98). This result indicates that perisylvian damage that includes Broca’s area can result in a very mild decline in performance on syllable discrimination. There are several possible sources of the deficit. From an anatomical standpoint we cannot determine unequivocally that the mild deficit results from the motor speech system because the lesions in our sample sometimes extended into the temporal lobe as well as into prefrontal cortex. Thus, one might expect perceptual deficits due to sensory system disruption or executive (e.g., attentional, working memory) dysfunction. Although a same-different discrimination task might seem to impose minimal demands on higher-order cognitive processes, it is nonetheless a fairly complicated task once one considers the operations involved: attend to and perceive stimulus #1 → maintain stimulus #1 in some form of active memory → attend to and perceive stimulus #2 (while continuing to maintain stimulus #1) → compare stimulus #1 and #2 along the relevant similarity dimension → make a response decision → execute a response. Empirically, it has been demonstrated that same-different discrimination can underestimate perceptual ability in some populations. Bishop and colleagues studied the speech perception abilities of a group of individuals with cerebral palsy who had associated anarthria. Using d’ as the dependent measure, performance on a same-different syllable discrimination task was below that of carefully matched controls. However, when the same stimuli were assessed using a different paradigm -- subjects judged whether a spoken stimulus correctly “named” a pictured object or was “misspoken” (a minimal pair non-word) -- performance improved such that d’ scores for individuals with cerebral palsy were at the level of the control group (Bishop, Brown, & Robson, 1990). Consistent with the Bishop et al. findings we found no difference on our auditory word comprehension test between patients with Broca’s area versus mesial temporal-occipital lesions suggesting that speech recognition is largely unaffected by Broca’s area lesions. In short, the very mild decrement in performance in the present sample of patients with Broca’s area lesions relative to our control group cannot be ascribed unequivocally to a perceptual analysis deficit.
The present finding adds to a growing body of evidence that shows that the motor speech system is not necessary for speech perception, in contrast to recent claims. This body of evidence has documented high levels of speech perception ability in (i) patients with acquired damage to the motor speech system, i.e., non-fluent aphasics and/or lesions involving Broca’s area (Baker et al., 1981; Blumstein et al., 1977; Rogalsky et al., 2011), (ii) individuals with developmental anarthria (Bishop et al., 1990; Lenneberg, 1962; Weller, 1993), (iii) individuals with acute and complete functional deactivation of the motor speech system via the Wada procedure (Hickok et al., 2008), (iv) healthy infants who have not yet acquired the ability to control their motor speech system (Eimas, Siqueland, Jusczyk, & Vigorito, 1971), and (v) non-human animals who do not have the biological capacity for speech (Kuhl & Miller, 1975; Lotto, Kluender, & Holt, 1997). Clearly a strong version of a motor theory of speech perception is untenable given the weight of the empirical evidence. It is possible that the motor system may modulate activity in the auditory speech system and augment perception via forward predictive coding under some listening conditions (Bever & Poeppel, 2010; Callan, Jones, Callan, & Akahane-Yamada, 2004; Hickok, Houde, & Rong, 2011; Poeppel & Monahan, 2010; Wilson, 2009; Wilson & Iacoboni, 2006). However, much of the evidence documenting the influence of the motor system on speech perception is derived from studies employing dependent measures that are potentially biased and/or use tasks that may tap higher-order processes such as attention or working memory.
Highlights.
We assess the speech sound discrimination ability of stroke patients with lesions involving Broca’s area.
We find that using signal detection methods damage to Broca’s area does not result in substantial speech perception deficits.
We conclude that the mirror system is not critically involved in speech perception.
Acknowledgements
Supported in part by NIH grant DC03681 (GH) and by a grant from PAT (Provincia Autonoma di Trento).
Footnotes
“Speech perception” is underspecified term that is variously used to refer to the ability to discriminate speech sounds, the ability to access phonological forms in the process of lexical access, or more generally to any operation involving the perceptual analysis of speech. It is empirical fact that the task used to assess “speech perception”, e.g., discrimination vs. recognition/comprehension, not only affects performance, but in fact can double dissociate (Miceli, Gainotti, Caltagirone, & Masullo, 1980); for reviews see (Hickok & Poeppel, 2000, 2004). Here we will use the term generically to refer to any task that involves analysis of speech signals and will qualify the term as needed to refer to specific operations or tasks.
A reviewer pointed out that discrimination tasks may not require the participants to use categorical speech information, implying that such tasks may not be assessing normal speech processing systems as they are used in word recognition. We agree completely that discrimination and recognition do not involve identical operations (see Footnote 1), but do not agree that discrimination tasks, as they are typically used, do not involve analysis of or access to categorical information as is demonstrated by category boundary effects reported in many discrimination studies (see (Diehl, Lotto, & Holt, 2004) for review).
This value is calculated from the raw mean error rates reported only in figure form for place contrasts. Note that this value of 93% differs from the value calculated by (Hickok, 2010), 85%, which was incorrect.
Again the d’ value differs from that calculated in (Hickok, 2010) which was incorrectly indicated as 4.8.
To get an intuitive sense of what this value means it is helpful to note that d’ values are in units of standard deviation, e.g., a d’ value of 1 is 1 standard deviation away from a d’ value of 2. So a d’ value of 4 can be conceptualized as 4 standard deviations above change performance (i.e., d’ = 0).
Publisher's Disclaimer: This is a PDF file of an unedited manuscript that has been accepted for publication. As a service to our customers we are providing this early version of the manuscript. The manuscript will undergo copyediting, typesetting, and review of the resulting proof before it is published in its final citable form. Please note that during the production process errors may be discovered which could affect the content, and all legal disclaimers that apply to the journal pertain.
References
- Baker E, Blumsteim SE, Goodglass H. Interaction between phonological and semantic factors in auditory comprehension. Neuropsychologia. 1981;19:1–15. doi: 10.1016/0028-3932(81)90039-7. [DOI] [PubMed] [Google Scholar]
- Basso A, Casati G, Vignolo LA. Phonemic identification defects in aphasia. Cortex. 1977;13:84–95. doi: 10.1016/s0010-9452(77)80057-9. [DOI] [PubMed] [Google Scholar]
- Bates E, Wilson SM, Saygin AP, Dick F, Sereno MI, Knight RT, Dronkers NF. Voxel-based lesion-symptom mapping. Nat Neurosci. 2003;6(5):448–450. doi: 10.1038/nn1050. [DOI] [PubMed] [Google Scholar]
- Bever TG, Poeppel D. Analysis by synthesis: a (re-)emerging program of research for language and vision. Biolinguistics. 2010;4:174–200. [Google Scholar]
- Bishop DV, Brown BB, Robson J. The relationship between phoneme discrimination, speech production, and language comprehension in cerebral-palsied individuals. Journal of Speech and Hearing Research. 1990;33:210–219. doi: 10.1044/jshr.3302.210. [DOI] [PubMed] [Google Scholar]
- Blumstein SE, Cooper WE, Zurif EB, Caramazza A. The perception and production of voice-onset time in aphasia. Neuropsychologia. 1977;15:371–383. doi: 10.1016/0028-3932(77)90089-6. [DOI] [PubMed] [Google Scholar]
- Callan DE, Jones JA, Callan AM, Akahane-Yamada R. Phonetic perceptual identification by native- and second-language speakers differentially activates brain regions involved with acoustic phonetic processing and those involved with articulatory-auditory/orosensory internal models. Neuroimage. 2004;22(3):1182–1194. doi: 10.1016/j.neuroimage.2004.03.006. [DOI] [PubMed] [Google Scholar]
- Caplan D, Gow D, Makris N. Analysis of lesions by MRI in stroke patients with acoustic-phonetic processing deficits. Neurology. 1995;45:293–298. doi: 10.1212/wnl.45.2.293. [DOI] [PubMed] [Google Scholar]
- Cloutman LL, Newhart M, Davis CL, Heidler-Gary J, Hillis AE. Neuroanatomical correlates of oral reading in acute left hemispheric stroke. Brain and Language. 2011;116(1):14–21. doi: 10.1016/j.bandl.2010.09.002. [DOI] [PMC free article] [PubMed] [Google Scholar]
- D’Ausilio A, Pulvermuller F, Salmas P, Bufalari I, Begliomini C, Fadiga L. Speech Perception May Causally Depend from the Activity of Motor Centers: Reply to Hickok. 2009a.
- D’Ausilio A, Pulvermuller F, Salmas P, Bufalari I, Begliomini C, Fadiga L. The motor somatotopy of speech perception. Curr Biol. 2009b;19(5):381–385. doi: 10.1016/j.cub.2009.01.017. [DOI] [PubMed] [Google Scholar]
- Damasio AR. Aphasia. New England Journal of Medicine. 1992;326:531–539. doi: 10.1056/NEJM199202203260806. [DOI] [PubMed] [Google Scholar]
- Damasio H. Human brain anatomy in computerized images. Oxford University Press; Oxford: 2005. [Google Scholar]
- Demonet J-F, Chollet F, Ramsay S, Cardebat D, Nespoulous J-L, Wise R, Rascol A, Frackowiak R. The anatomy of phonological and semantic processing in normal subjects. Brain. 1992;115:1753–1768. doi: 10.1093/brain/115.6.1753. [DOI] [PubMed] [Google Scholar]
- Diehl RL, Lotto AJ, Holt LL. Speech perception. Annu Rev Psychol. 2004;55:149–179. doi: 10.1146/annurev.psych.55.090902.142028. [DOI] [PubMed] [Google Scholar]
- Dronkers NF, Wilkins DP, Van Valin RD, Jr., Redfern BB, Jaeger JJ. Lesion analysis of the brain areas involved in language comprehension. Cognition. 2004;92(1-2):145–177. doi: 10.1016/j.cognition.2003.11.002. [DOI] [PubMed] [Google Scholar]
- Duvernoy HM. The human brain: surface, three-dimensional sectional anatomy with MRI, and blood supply. Springer; New York: 1999. [Google Scholar]
- Eimas PD, Siqueland ER, Jusczyk P, Vigorito J. Speech perception in infants. Science. 1971;171(968):303–306. doi: 10.1126/science.171.3968.303. [DOI] [PubMed] [Google Scholar]
- Fadiga L, Craighero L. Hand actions and speech representation in Broca’s area. Cortex. 2006;42(4):486–490. doi: 10.1016/s0010-9452(08)70383-6. [DOI] [PubMed] [Google Scholar]
- Galantucci B, Fowler CA, Turvey MT. The motor theory of speech perception reviewed. Psychon Bull Rev. 2006;13(3):361–377. doi: 10.3758/bf03193857. [DOI] [PMC free article] [PubMed] [Google Scholar]
- Goodglass H, Kaplan E, Barresi B. The assessment of aphasia and related disorders. 3rd ed Lippincott Williams & Wilkins; Philadelphia: 2001. [Google Scholar]
- Green DM, Swets JA. Signal Detection Theory and Psychophysics. Wiley; New York: 1966. [Google Scholar]
- Hickok G. Eight problems for the mirror neuron theory of action understanding in monkeys and humans. Journal of Cognitive Neuroscience. 2009;21(7):1229–1243. doi: 10.1162/jocn.2009.21189. [DOI] [PMC free article] [PubMed] [Google Scholar]
- Hickok G. The role of mirror neurons in speech perception and action word semantics. Language and Cognitive Processes. 2010;25:749–776. [Google Scholar]
- Hickok G, Houde J, Rong F. Sensorimotor integration in speech processing: computational basis and neural organization. Neuron. 2011;69(3):407–422. doi: 10.1016/j.neuron.2011.01.019. [DOI] [PMC free article] [PubMed] [Google Scholar]
- Hickok G, Okada K, Barr W, Pa J, Rogalsky C, Donnelly K, Barde L, Grant A. Bilateral capacity for speech sound processing in auditory comprehension: evidence from Wada procedures. Brain Lang. 2008;107(3):179–184. doi: 10.1016/j.bandl.2008.09.006. [DOI] [PMC free article] [PubMed] [Google Scholar]
- Hickok G, Poeppel D. Towards a functional neuroanatomy of speech perception. Trends in Cognitive Sciences. 2000;4:131–138. doi: 10.1016/s1364-6613(00)01463-7. [DOI] [PubMed] [Google Scholar]
- Hickok G, Poeppel D. Dorsal and ventral streams: A framework for understanding aspects of the functional anatomy of language. Cognition. 2004;92:67–99. doi: 10.1016/j.cognition.2003.10.011. [DOI] [PubMed] [Google Scholar]
- Kreisler A, Godefroy O, Delmaire C, Debachy B, Leclercq M, Pruvo JP, Leys D. The anatomy of aphasia revisited. Neurology. 2000;54(5):1117–1123. doi: 10.1212/wnl.54.5.1117. [DOI] [PubMed] [Google Scholar]
- Kuhl PK, Miller JD. Speech perception by the chinchilla: Voiced-voiceless distinction in alveolar plosive consonants. Science. 1975;190:69–72. doi: 10.1126/science.1166301. [DOI] [PubMed] [Google Scholar]
- Lenneberg EH. Understanding language without ability to speak: a case report. Journal of Abnormal and Social Psychology. 1962;65:419–425. doi: 10.1037/h0041906. [DOI] [PubMed] [Google Scholar]
- Liberman AM. Some results of research on speech perception. Journal of the Acoustical Society of America. 1957;29(1):117–123. [Google Scholar]
- Liberman AM, Cooper FS, Shankweiler DP, Studdert-Kennedy M. Perception of the speech code. Psychol Rev. 1967;74(6):431–461. doi: 10.1037/h0020279. [DOI] [PubMed] [Google Scholar]
- Liberman AM, Mattingly IG. The motor theory of speech perception revised. Cognition. 1985;21:1–36. doi: 10.1016/0010-0277(85)90021-6. [DOI] [PubMed] [Google Scholar]
- Lotto AJ, Hickok GS, Holt LL. Reflections on Mirror Neurons and Speech Perception. Trends Cogn Sci. 2009;13:110–114. doi: 10.1016/j.tics.2008.11.008. [DOI] [PMC free article] [PubMed] [Google Scholar]
- Lotto AJ, Kluender KR, Holt LL. Perceptual compensation for coarticulation by Japanese quail (Coturnix coturnix japonica) J Acoust Soc Am. 1997;102(2 Pt 1):1134–1140. doi: 10.1121/1.419865. [DOI] [PubMed] [Google Scholar]
- Macmillan NA, Creelman CD. Detection theory: A user’s guide. 2nd ed Lawrence Erlbaum Associates, Inc.; Mahwah, New Jersey: 2005. [Google Scholar]
- Mai JK, Assheuer J, Paxinos G. Atlas of the human brain. 2nd ed Elsevier; Amsterdam: 2004. [Google Scholar]
- Meister IG, Wilson SM, Deblieck C, Wu AD, Iacoboni M. The essential role of premotor cortex in speech perception. Curr Biol. 2007;17(19):1692–1696. doi: 10.1016/j.cub.2007.08.064. [DOI] [PMC free article] [PubMed] [Google Scholar]
- Miceli G, Gainotti G, Caltagirone C, Masullo C. Some aspects of phonological impairment in aphasia. Brain and Language. 1980;11:159–169. doi: 10.1016/0093-934x(80)90117-0. [DOI] [PubMed] [Google Scholar]
- Miceli G, Laudanna A, Burani C, Capasso R. Batteria per l’analisi dei deficit afasici. EMS; Bologna: 2004. [Google Scholar]
- Moineau S, Dronkers NF, Bates E. Exploring the processing continuum of single-word comprehension in aphasia. J Speech Lang Hear Res. 2005;48(4):884–896. doi: 10.1044/1092-4388(2005/061). [DOI] [PubMed] [Google Scholar]
- Philipose LE, Gottesman RF, Newhart M, Kleinman JT, Herskovits EH, Pawlak MA, Marsh EB, Davis C, Heidler-Gary J, Hillis AE. Neural regions essential for reading and spelling of words and pseudowords. Annals of Neurology. 2007;62(5):481–492. doi: 10.1002/ana.21182. [DOI] [PubMed] [Google Scholar]
- Poeppel D, Monahan P. Feedforward and feedback in speech perception: Revisiting analysis-by-synthesis. Language and Cognitive Processes. 2010 [Google Scholar]
- Pulvermuller F, Huss M, Kherif F, del Prado Martin F. Moscoso, Hauk O, Shtyrov Y. Motor cortex maps articulatory features of speech sounds. Proc Natl Acad Sci U S A. 2006;103(20):7865–7870. doi: 10.1073/pnas.0509989103. [DOI] [PMC free article] [PubMed] [Google Scholar]
- Rapcsak SZ, Beeson PM, Henry ML, Leyden A, Kim E, Rising K, Andersen S, Cho H. Phonological dyslexia and dysgraphia: cognitive mechanisms and neural substrates. Cortex. 2009;45(5):575–591. doi: 10.1016/j.cortex.2008.04.006. [DOI] [PMC free article] [PubMed] [Google Scholar]
- Rizzolatti G, Craighero L. The mirror-neuron system. Annual Review of Neuroscience. 2004;27:169–192. doi: 10.1146/annurev.neuro.27.070203.144230. [DOI] [PubMed] [Google Scholar]
- Rogalsky C, Love T, Driscoll D, Anderson SW, Hickok G. Are mirror neurons the basis of speech perception? Evidence from five cases with damage to the purported human mirror system. Neurocase. 2011;17(2):178–187. doi: 10.1080/13554794.2010.509318. [DOI] [PMC free article] [PubMed] [Google Scholar]
- Sato M, Brisebois A, Grabski K, Basirat A, Menard L, Glenberg AM, Gattaneo L. Articulatory bias in speech categorization: Evidence from use-induced motor plasticity. Cortex. doi: 10.1016/j.cortex.2011.03.009. (in press) [DOI] [PubMed] [Google Scholar]
- Venezia JH, Saberi K, Hickok G. Activation in motor speech regions tracks with experimentally induced bias; Paper presented at the Cognitive Neuroscience Society; San Francisco. 2011. [Google Scholar]
- Watkins K, Paus T. Modulation of motor excitability during speech perception: the role of Broca’s area. J Cogn Neurosci. 2004;16(6):978–987. doi: 10.1162/0898929041502616. [DOI] [PubMed] [Google Scholar]
- Watkins KE, Strafella AP, Paus T. Seeing and hearing speech excites the motor system involved in speech production. Neuropsychologia. 2003;41(8):989–994. doi: 10.1016/s0028-3932(02)00316-0. [DOI] [PubMed] [Google Scholar]
- Weller M. Anterior opercular cortex lesions cause dissociated lower cranial nerve palsies and anarthria but no aphasia: Foix-Chavany-Marie syndrome and “automatic voluntary dissociation” revisited. J Neurol. 1993;240(4):199–208. doi: 10.1007/BF00818705. [DOI] [PubMed] [Google Scholar]
- Wilson SM. Speech perception when the motor system is compromised. Trends Cogn Sci. 2009;13:329–330. doi: 10.1016/j.tics.2009.06.001. [DOI] [PMC free article] [PubMed] [Google Scholar]
- Wilson SM, Iacoboni M. Neural responses to non-native phonemes varying in producibility: evidence for the sensorimotor nature of speech perception. Neuroimage. 2006;33(1):316–325. doi: 10.1016/j.neuroimage.2006.05.032. [DOI] [PubMed] [Google Scholar]
- Wilson SM, Saygin AP, Sereno MI, Iacoboni M. Listening to speech activates motor areas involved in speech production. Nat Neurosci. 2004;7:701–702. doi: 10.1038/nn1263. [DOI] [PubMed] [Google Scholar]
- Xiao Z, Zhang JX, Wang X, Wu R, Hu X, Weng X, Tan LH. Differential activity in left inferior frontal gyrus for pseudowords and real words: an event-related fMRI study on auditory lexical decision. Human Brain Mapping. 2005;25(2):212–221. doi: 10.1002/hbm.20105. [DOI] [PMC free article] [PubMed] [Google Scholar]