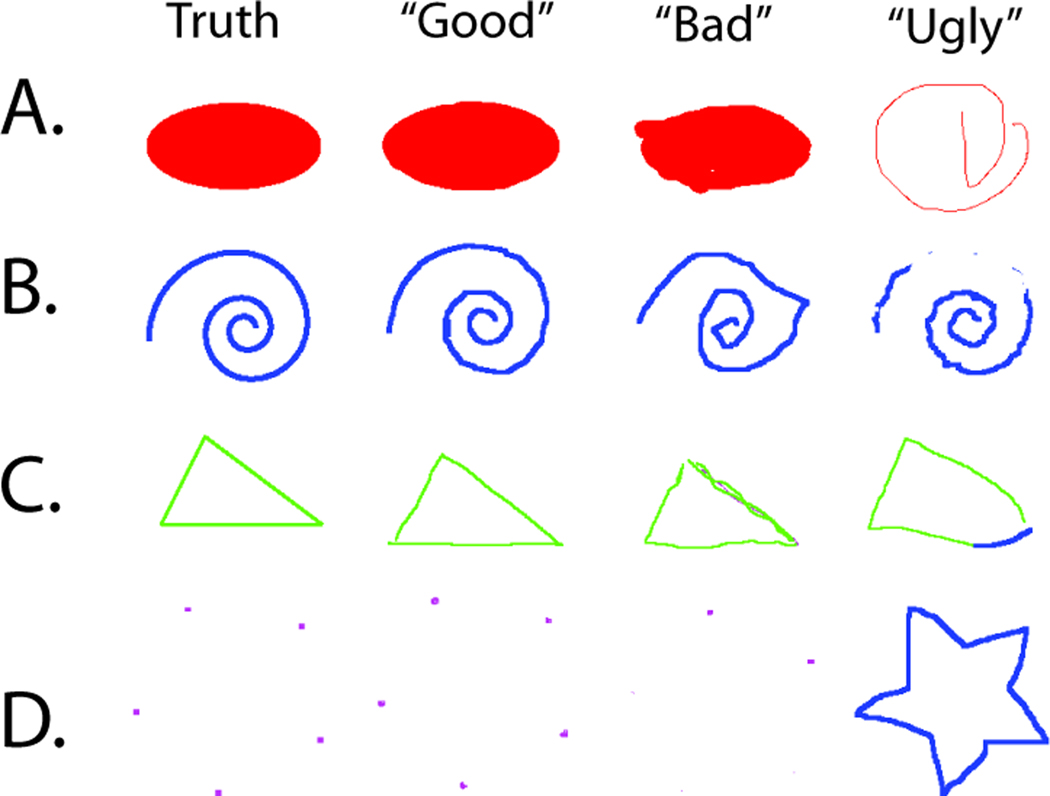
Figure 3.
Representative labeling results for the interface study. For illustrative purposes, we show the range of observations divided into visually good classification (generally precise), bad classification (rules were followed but the labeled images are not visually close to the truth), and ugly classification (inconsistent with the expected ground truth).

