

Abstract
The five-factor model organizes personality traits into five factors: Neuroticism, Extraversion, Openness to Experience, Agreeableness, and Conscientiousness. Measures of these personality traits predict people’s behaviors and important outcomes of their lives. Therefore, understanding the neural correlates of these personality traits is important. This study assessed the relationships between white matter (WM) integrity and personality traits among 51 healthy participants using diffusion tensor imaging (DTI) and the revised NEO Personality Inventory (NEO-PI-R). Neuroticism correlated positively while Openness and Agreeableness correlated negatively with DTI mean diffusivity (MD) in the corona radiata and superior longitudinal fasciculus, tracts which interconnect prefrontal cortex (PFC), parietal cortex, and subcortical structures. Furthermore, Neuroticism correlated positively with MD in the anterior cingulum and uncinate fasciculus, tracts interconnecting PFC and amygdala. Openness correlated negatively with MD of WM adjacent to the dorsolateral PFC in both hemispheres. These findings suggest that greater Neuroticism associates with worse integrity of WM interconnecting extensive cortical and subcortical structures including the PFC and amygdala and that greater Openness associates with better integrity of WM interconnecting extensive cortical and subcortical structures including the dorsolateral PFC.
Keywords: DTI, Neuroimaging, NEO, Neuroticism, Openness, Diffusion Tensor Imaging
Introduction
Personality traits refer to individual tendencies to express specific patterns of cognition, emotion, and behavior (Fleeson 2001). The five-factor model (FFM) organizes personality traits into five domains: Neuroticism (N), Extraversion (E), Openness to Experience (O), Agreeableness (A), and Conscientiousness (C) (Costa 1992). These traits predict patterns of daily behaviors, subjective well-being, mental and physical health, quality of relationships with peers and family members, and occupational performance and satisfaction (Diener et al 2003; Fleeson & Gallagher 2009; McAdams & Olson 2010; Ozer & Benet-Martinez 2006; Roberts et al 2007). Therefore, the FFM provides a meaningful, structured approach for assessing and describing personality traits that relate to important areas of life functioning. Knowledge of the brain mechanisms underlying each of these personality traits holds significant implications for understanding the neurobiological factors related to behavioral tendencies and subjective well-being. Modern neuroimaging methods provide excellent opportunities for studying the neural correlates of personality traits.
Neuroimaging studies have reported significant correlations between FFM personality traits and brain function and structures. For example, N correlated significantly with response in the prefrontal cortex (PFC) and amygdala to emotional stimuli (Cremers et al 2010; Haas et al 2008; Haas et al 2007; Hooker et al 2008), and with task-related function connectivity between PFC and amygdala (Cremers et al 2010). E and N correlated significantly with gray matter (GM) volumes in the PFC and amygdala (DeYoung et al 2010; Jackson et al 2009; Omura et al 2005; Wright et al 2006). Furthermore, recent diffusion tensor imaging (DTI) studies reported that personality traits such as novelty seeking, reward dependence, and creativity correlated significantly with the integrity and/or strength of white matter (WM) tracts interconnecting brain regions including hippocampus, amygdala, striatum, and PFC (Cohen et al 2009; Takeuchi et al 2010b). While previous neuroimaging studies have provided initial insight into neural correlates of personality traits, the current knowledge of relationships between brain function and structures and personality traits is still very limited. For example, only a few studies have assessed the relationships between several selected personality traits and WM integrity (Cohen et al 2009; Takeuchi et al 2010b), and no studies have systematically assessed the relationships between FFM traits and DTI measures of WM integrity. WM mediates communications in the brain and is critical for the integrity of brain function. The knowledge of relationships between WM integrity and personality traits will help us to understand how the integrity of anatomical connections in the brain relates to emotion, cognition, and behaviors. Therefore, further assessment of the relationships between FFM personality traits and WM integrity are needed.
DTI assesses WM integrity by calculating water diffusivities parallel and perpendicular to axons (e.g., axial diffusivity, λ1 and radial diffusivity, λT) from measures of water diffusion in multiple directions (Assaf & Pasternak 2008). It generates a fractional anisotropy (FA) value by calculating the normalized standard deviation of axial (λ1) and radial diffusivities (λT) to index the degree to which the water diffusion deviates from isotropic diffusion in the WM, and a mean diffusivity (MD) value by averaging λ1 and λT to index the overall diffusivity (Assaf & Pasternak 2008; Neil 2008). FA correlates positively with the ratio of λ1 and λT, while MD correlates positively with the sum of λ1 and λT. Therefore, FA and MD are sensitive to different patterns of changes in λ1 and λT. For example, an increase in both λ1 and λT may significantly increase MD without significantly changing FA, and a decrease in λ1 along with an increase in λT may significantly decrease FA without significantly changing MD. Therefore, both FA and MD are regularly used as indexes of WM integrity, and a decreased FA and/or an increased MD value in the WM is usually interpreted as reflecting poorer WM integrity (Alexander et al 2007). Furthermore, it has been demonstrated that different pathological processes in the brain may influence λ1 and λT differently. For example, axonal degeneration mainly associates with changes in λ1 value (Concha et al 2006; Sidaros et al 2008), while demyelination mainly associates with increased λT value (Song et al 2002). Therefore, several recent DTI studies assessed aging-related changes in λ1 and λT along with FA and MD and analyzed the potential physiological and/or pathophysiological processes underlying aging-related decreases in WM integrity based on observed patterns of changes in these DTI parameters (Bennett et al 2010; Burzynska et al 2010; Zhang et al 2010). Based on afore mentioned studies, we assessed FA and MD using a voxel-wise whole-brain analysis in the current study. For exploring the neurobiological processes underlying FFM traits as related to differences in WM measures, we further analyzed the relationships among λ1, λT, FA, and MD within clusters showing significant correlations between FFM traits and FA and/or MD,
The main aim of this study was to assess the relationships between each FFM personality trait and WM integrity using the revised NEO-Personality Inventory (NEO-PI-R) and DTI, respectively (Costa 1992). In the following sections of the introduction, we first briefly review existing data on the neural correlates of each FFM personality trait, and then present our hypotheses regarding the relationships between WM integrity and the personality traits. The neural correlates of N and E have been studied extensively and a comprehensive review of all data is beyond the scope of this introduction. Therefore, we reviewed data closely related to the current aim for generating hypotheses. However, the neural correlates for other FFM traits such as A and C are less well studied relative to N and E. For generating hypotheses on relationships between WM integrity and these traits, we reviewed available data on neural correlates of these traits and on personality traits closely related to them (e.g., creativity and theory of mind).
N measures tendencies to experience negative affects such as fear, sadness, anger, and embarrassment, and associates with anxiety and depression (Costa 1992; Costa & McCrae 1980; Larsen & Ketelaar 1991). In functional MRI (fMRI) studies, N scores positively correlate with activation in the amygdala, anterior cingulate (AC), and dorsomedial prefrontal cortex (PFC) in response to negative emotional stimuli (Haas et al 2007; Harenski et al 2009; Hooker et al 2008). It has been hypothesized that the increased activation in the amygdala of persons with high N reflects decreased top-down control of the PFC over amygdala reactivity (Canli 2008). Consistently, N scores correlate negatively with effective connectivity between the amygdala and AC when subjects view negative emotional stimuli (Cremers et al 2010). Based on these data, we predicted that N scores would negatively correlate with the integrity of WM interconnecting the PFC and amygdala such as anterior cingulum and uncinate fasciculus.
E assesses tendencies related to being outgoing, seeking novelty and sensations, and depending on external stimulation for arousal, and this factor associates with reward sensitivity and positive emotion (Costa 1992; Depue & Collins 1999). E scores correlate positively with resting metabolism in the putamen and orbitofrontal cortex (OFC) (Deckersbach et al 2006; Kim et al 2008), and with activity in the AC, PFC, and temporal lobes in response to positive emotional stimuli (Haas et al 2006; Mobbs et al 2005). E scores associate with greater functional connectivity between the AC and the inferior parietal lobule during the viewing of positive emotional stimuli (Haas et al 2006). Furthermore, a recent DTI tractography study reported significant correlations between two E related personality traits and the strength of fiber tracts connecting specific brain regions. More specifically, this study reported that novelty-seeking scores in healthy adults correlates positively with DTI measures of the strength of fiber tracts connecting the ventral striatum, hippocampus and amygdala, and that reward-dependence scores correlate positively with measures of WM fiber tract strength between the striatum and a cortical network including the OFC, dorsolateral PFC, and supplemental motor cortex (Cohen et al 2009). Based on these findings from fMRI and DTI studies, we predicted that E scores would positively correlate with the integrity of WM interconnecting the PFC, parietal cortex, and striatum including corona radiata (CR) and superior longitudinal fasciculus (SLF).
O measures propensities related to aesthetic sensitivity, cognitive flexibility, abstract imagination, and willingness to entertain novel ideas, and O scores associate with intelligence, creativity, and divergent thinking (Costa 1992; Schretlen et al 2010). It has been hypothesized that O reflects the function of dopaminergic projections from the midbrain to the PFC including the AC (DeYoung et al 2005). Consistently, O scores correlate positively with performance measures on cognitive tasks involving dorsolateral PFC function (DeYoung et al 2005). A positron-emission tomography (PET) study found that O scores in healthy older adults correlated positively with resting activity in the PFC in women, in the AC in men, and in the OFC in both genders (Sutin et al 2009). Takeuchi et al (2010a, b) assessed an O-related trait (creativity) using a divergent thinking test and its neural correlates using voxel-based morphometry (VBM) and DTI. They reported that scores on creativity in healthy adults correlated positively with gray matter (GM) volumes in the dorsolateral PFC, striatum, and ventral tegmental area/substantia nigra (VTA/SN) of the midbrain (Takeuchi et al 2010a), and with the integrity of WM in the body of the corpus callosum (CC) and WM adjacent to the PFC, tempoparietal junction, inferior parietal lobule, and basal ganglia (Takeuchi et al 2010b). Therefore, we predicted that O scores would positively correlate with the integrity of WM interconnecting the two hemispheres (i.e., CC), and WM interconnecting PFC, parietal and temporal cortices, and basal ganglia including CR and SLF.
A assesses tendencies related to altruism, social cooperation, mindfulness of others’ needs and rights, and willingness to help others (Costa 1992). Only a few neuroimaging studies have reported neural correlates of A. A scores in healthy adults correlate positively with GM volumes in the posterior cingulate and right fusiform gyrus and negatively with GM volumes in the right superior temporal gyrus and sulcus (DeYoung et al 2010). In patients with frontotemporal dementia (FTD), A scores correlate positively with GM volumes in the right OFC and negatively with GM volumes in the left OFC (Rankin et al 2004). As A is associated with understanding others’ intentions and their emotional and mental states, it may reflect tendencies or capacities related to theory of mind (ToM) (Graziano et al 2007; Nettle & Liddle 2008). Positive correlations between ToM performance measures in older adults and integrity of WM in the centrum semiovale have been reported (Charlton et al 2009). The centrum semiovale includes the CR interconnecting cortical and subcortical structures and the SLF interconnecting the PFC and parietal cortex (Mori et al 2005; Schmahmann & Pandya 2007; Schmahmann et al 2008). Therefore, we predicted that the integrity of WM in the CR and SLF would positively correlate with A scores.
C measures propensities related to deliberateness, self-discipline, effortful control, and motivation to engage in goal-directed behaviors (Digman & Takemoto-Chock 1981). Little neuroimaging data are available regarding neural correlates of C relative to N and E. C correlated positively with GM volumes in the lateral PFC and OFC among healthy adults, and higher C scores associated with less aging-related volumetric decreases in WM, amygdala and parahippocampus among senior adults (DeYoung et al 2010; Jackson et al 2009). In 11–14 year-old adolescents, a C-related personality trait, effortful control, positively correlates with the volumes of OFC and hippocampus (Whittle et al 2008). Individuals with multiple sclerosis show significant reductions in C scores relative to healthy controls, and their decreases in C scores correlate with the extent of cortical atrophy (Benedict et al 2008; Benedict et al 2001). Therefore, we predicted that C scores would correlate positively with the integrity of WM interconnecting the PFC, parietal cortex, amygdala, and hippocampus including anterior cingulum, uncinate fasciculus, CR, and SLF.
Methods
Participants
We acquired both DTI and self-reported data on NEO-PI-R from 56 healthy adults. Individuals were recruited by media ads and provided written informed consent to participate in the protocol that was approved by the Yale Human Investigations Committee. Participants were screened using the Structured Clinical Interview (SCID) (First et al 1997; First et al 1996) and provided urine samples to assess recent use of cocaine, opioids, stimulants, marijuana and benzodiazepines. Participants were excluded if any metabolites of these substances were positive in their urine samples. Handedness was assessed by asking participants which hand they usually use, and left-handed individuals were excluded. Other exclusionary criteria included pregnancy, current psychiatric diagnoses, or unstable medical conditions. Two independent postdoctoral fellows, who were blind to the identity of DTI images, independently examined the quality of each image in the original space. Images from five participants were rated as poor quality due to excessive noise by both investigators and were excluded from further analysis. The final sample includes 51 adults (21 women) with a mean age of 29.6 (standard deviation (SD)=10.0, range: 18 – 54) years, and a mean education of 15.0 (SD=2.0, range: 12 – 20) years.
FFM Personality Traits
The self-report version of the revised NEO Personality Inventory (NEO-PI-R) with 240-items was used to assess personality traits (Costa 1992). NEO-PI-R generates a score for each of N, E, O, A, and C. Each trait includes six facets. SPSS was used to calculate Cronbach’s alphas for each trait and correlations among scores on the five traits.
Scanning Procedures
DTI data were acquired with a 3.0T Siemens Trio scanner at the Yale Magnetic Resonance Research Center. Diffusion sensitizing gradients were applied along 32 directions using b values of 0 (b0 image) and 1000 s/mm2 (TR = 7400, TE = 115, matrix = 128 × 128, FOV = 256 × 256 mm2). Forty contiguous slices parallel to the AC-PC line were acquired, and each slice was 3.0 mm thick (Xu et al 2010). Two repetitions were acquired for averaging. A high-resolution T1 image was routinely acquired and examined by a neuroradiologist to identify any structural anomolies.
Image Processing
The procedure for DTI processing was described recently (Xu et al., 2010). FMRIB’s Diffusion Toolbox (FDT 2.0) and Tract-Based Spatial Statistics (TBSS 1.2) (Smith et al 2007; Smith 2004; Smith et al 2006) from FMRIB’s Software Library (FSL 4.1.4, (Smith et al 2004; Woolrich et al 2009) http://www.fmrib.ox.ac.uk/fsl/) were used for image analyses. A set of mean images was created by aligning and averaging the two image sets from each subject and were used to construct the diffusion tensor using FDT. FDT typically generates maps of fractional anisotropy (FA), parallel eigenvalue (λ1), mean diffusivity (MD), lamda_2 (λ2), and lamda_3 (λ3). The map of the perpendicular eigenvalue (λT) was generated by averaging the maps of λ2 and λ3.
TBSS was used to register FA map of each subject into Montreal Neurological Institute (MNI) template space. A mean FA map was created by averaging registered FA images from all subjects, and a mean FA skeleton was created by thinning the mean FA image (Smith et al 2007; Smith 2004; Smith et al 2006). The aligned FA data of each participant were projected onto the mean skeleton by searching the area around the skeleton in the direction perpendicular to each tract, finding the highest local FA value, and assigning this value to the skeleton. The transformation matrices created for FA map registration were used to register λ1, λT, and MD maps. Skeletons for λ1, λT, and MD were created using the same procedures for creating the FA skeleton.
We performed voxel-wise whole brain analyses for assessing the correlations between scores on personality traits and values of FA and MD using participants’ gender and age as covariates. Image analyses were executed using the “randomise” program with 5000 permutations. The “randomise” program uses permutation-based, non-parametric inferences to perform voxel-wise cross-subject statistics (Nichols & Holmes 2002). Statistical thresholds for all image analyses were voxel level t > 2.0 and cluster p < .05, FWE-corrected for multiple comparisons of the voxel-wise whole brain analysis. JHU ICBM-DTI-81 White-Matter Labels and JHU White-Matter Tractography Atlas provided by FSLVIEW (3.1.2) were used to identify the anatomical location of significant clusters in the brain (Mori et al 2009; Mori et al 2008). The function “fslmeants” from FSL was used to extract means of FA, λ1, λT, and MD from significant clusters surviving correction for multiple comparisons during whole-brain analysis. The Pearson’s correlations between these mean values and scores on related personality tratits were assessed using SPSS 18.0. The purpose of these correlation analyses was to estimate the relative extent of changes in λ1 and λT, i.e., greater or smaller changes in λ1 relative to λT within each cluster, and therefore no correction for multiple comparisons were performed.
Results
Table 1 presents the means (SD), Cronbach’s alpha coefficients, and inter-correlations of scores on each NEO factor. The alpha coefficients range from 0.79 to 0.85, indicating high internal consistency of these scores. The mean of each factor is equivalent to corresponding data acquired from healthy male and female participants as presented in the NEO-PI-R manual (Costa 1992). The following sections and table 2 present correlations between DTI parameters and scores on each NEO factor after controlling for age and gender. Table 3 presents the correlations between mean values of FA, MD, λ1, and λT within each significant cluster and scores on related personality traits.
Table 1.
Mean (SD), internal consistency coefficients, and inter correlations of scores on five NEO factors.
| Mean (SD) | α | N | E | O | A | C | |
|---|---|---|---|---|---|---|---|
| N | 66.1 (21.3) | .85 | −.29* | −.46** | −.69** | −.64** | |
| E | 116.2 (20.8) | .81 | .55** | .19 | .15 | ||
| O | 118.6 (21.1) | .79 | .35* | .18 | |||
| A | 121.7 (21.0) | .83 | .45** | ||||
| C | 130.6 (21.7) | .79 |
p < .05;
p < .01;
Abbreviations: α: Cronbach’s alpha coefficients; N: Neuroticism; E: Extraversion; O: Openness to Experience; A: Agreeableness; C: Conscientiousness.
Table 2.
Correlations between scores on NEO factors and values of DTI parameters.
| Size | t-value* | MNI Coordinates | ||||
|---|---|---|---|---|---|---|
| L/R | Voxels | x | y | z | ||
| Neuroticism | ||||||
| MD--Positive | ||||||
| Forceps Minor, CC Body, CR A Cingulum, IFOF | R | 1033 | 4.9 | 18 | 29 | 38 |
| CR, SLF | L | 681 | 5.8 | −11 | 37 | 49 |
| CR, P Cingulum, CC Body | L | 627 | 5.0 | −23 | −27 | 48 |
| Forceps Minor, A Cingulum | L | 376 | 5.4 | −17 | 42 | 6 |
| SLF, CR | L | 284 | 3.7 | −22 | −41 | 45 |
| IFOF, Uncinate | L | 266 | 4.1 | −29 | 37 | 2 |
| Openness | ||||||
| MD--Negative | ||||||
| SLF, CR | L | 625 | 4.9 | −14 | 12 | 51 |
| CC Body, Forceps Minor, CR, A Cingulum | R | 602 | 4.6 | 7 | 12 | 21 |
| SLF | R | 514 | 4.4 | 44 | −4 | 32 |
| CR, SLF | R | 389 | 4.2 | 18 | 25 | 42 |
| Forceps Minor, A Cingulum, IFOF | L | 382 | 4.1 | −17 | 41 | 15 |
| CR, SLF | L | 341 | 5.2 | −24 | −31 | 48 |
| CR, SLF | L | 333 | 5.2 | −21 | 1 | 44 |
| CR, SLF | L | 245 | 4.9 | −27 | 4 | 29 |
| Agreeableness | ||||||
| MD--Negative | ||||||
| CR, SLF, A Cingulum | R | 549 | 5.1 | 15 | 4 | 54 |
| CR, SLF | L | 307 | 4.7 | −21 | −19 | 55 |
t value of the peak voxel.
Abbreviation: A: anterior; CC: corpus callosum; CR: corona radiata; IFOF: inferior frontal occipital fasciculus; L: left hemisphere; MNI: Montreal Neurological Institute; R: right hemisphere; SLF: superior longitudinal fasciculus.
Table 3.
Correlations between personality traits and mean values of DTI parameters in each significant cluster
| Neuroticism | ||||
|---|---|---|---|---|
| Cluster Location | DTI Parameters | |||
| FA | λ1 | λT | MD | |
| Right Forceps Minor, CC Body, CR, A Cingulum & IFOF | −.21 | .64** | .48** | .64** |
| Left CR & SLF | −.21 | .75** | .57** | .74** |
| Left CR, P Cingulum & CC Body | .23 | .67** | .18 | .59** |
| Left Forceps Minor & A Cingulum | −.36* | .54** | .51** | .56** |
| Left SLF & CR | −.023 | .66** | .32* | .54** |
| Left IFOF & Uncinate | −.26 | .59** | .51** | .59** |
| Openness to Experience | ||||
| Left SLF & CR | .38** | −.42** | −.58** | −.61** |
| Right CC Body, Forceps Minor, CR & A Cingulum | .55** | −.37** | −.63** | −.65** |
| Right SLF | .56** | −.51** | −.64** | −.65** |
| Right CR & SLF | .47** | −.33* | −.57** | −.58** |
| Left Forceps Minor, A Cingulum & IFOF | .45** | −.42** | −.61** | −.62** |
| Left CR & SLF | .28* | −.36* | −.54** | −.63** |
| Left CR & SLF | .38** | −.45** | −.54** | −.58** |
| Left CR & SLF | .34* | −.32* | −.58** | −.59** |
| Agreeableness | ||||
| Right CR, SLF & A Cingulum | .14 | −.55** | −.40** | −.60** |
| Left CR & SLF | .32* | −.57** | −.50** | −.62** |
p < .05,
p < .01,
Abbreviation: A: anterior; CC: corpus callosum; CR: corona radiata; IFOF: inferior frontal occipital fasciculus; L: left hemisphere; SLF: superior longitudinal fasciculus.
Neuroticism
N scores positively correlated with MD but not with FA (Table 2 & Fig. 1). Six clusters in the MD map showed significant correlations. These clusters involved the anterior cingulum, body of corpus callosum (CC), forceps minor, corona radiata (CR), superior longitudinal fasciculus (SLF), and inferior frontal occipital fasciculus (IFOF), bilaterally, and left uncinate fasciculus. All significant clusters showed positive correlations between N scores and mean values of λ1 and λT (Table 3), except the cluster at the left CR and posterior cingulum did not reach statistical significance in its correlation between N and λT. The cluster at the left forceps minor and anterior cingulum was the only cluster that showed a significant negative correlation between N and FA.
Figure 1.
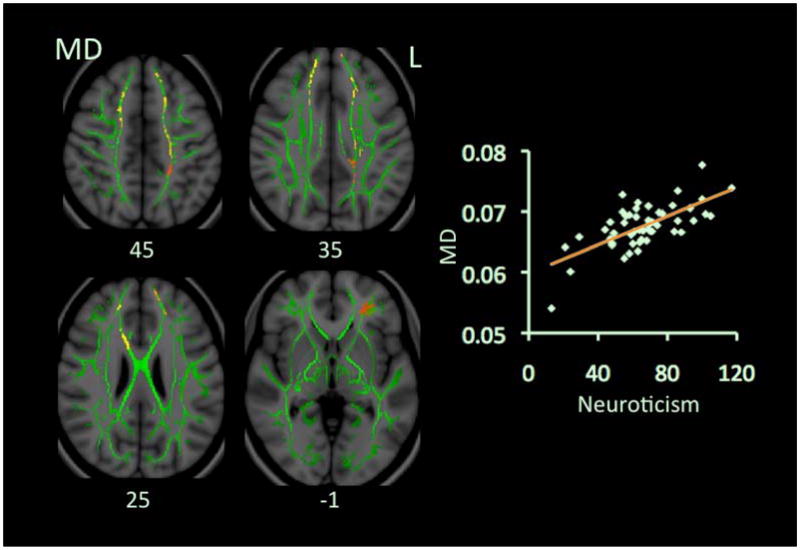
Correlations between scores on Neuroticism and values of MD. Red-Yellow color on Montreal Neurological Institute (MNI) T1 template indicates brain regions exhibiting significant correlations between scores on Neuroticism and values of MD. In this figure and all other figures in this paper, green color shows “group mean_FA_skeleton”, and the number below each brain image indicates Z coordinate in MNI space, and only clusters surviving correction for multiple comparisons of voxel-wise whole brain analysis are shown on brain images. Scatter-plots demonstrate correlations between mean MD values (y-axis) and scores on Neuroticism. Mean MD values in this figure and all other figures in this paper were calculated from all voxels from all significant clusters of each participant. Abbreviation: L: left.
Openness
O scores negatively correlated with MD but not with FA (Table 2 & Fig. 2). Eight clusters in the MD map showed significant correlations. They involved the SLF, CR, anterior cingulum, and forceps minor, bilaterally, and right CC body, and regions adjacent to the middle (MFG) and inferior frontal gyrus (IFG) in both hemispheres. All significant clusters showed negative correlations between O scores and mean values of λ1 and λT and positive correlations between O and FA (Table 3).
Figure 2.
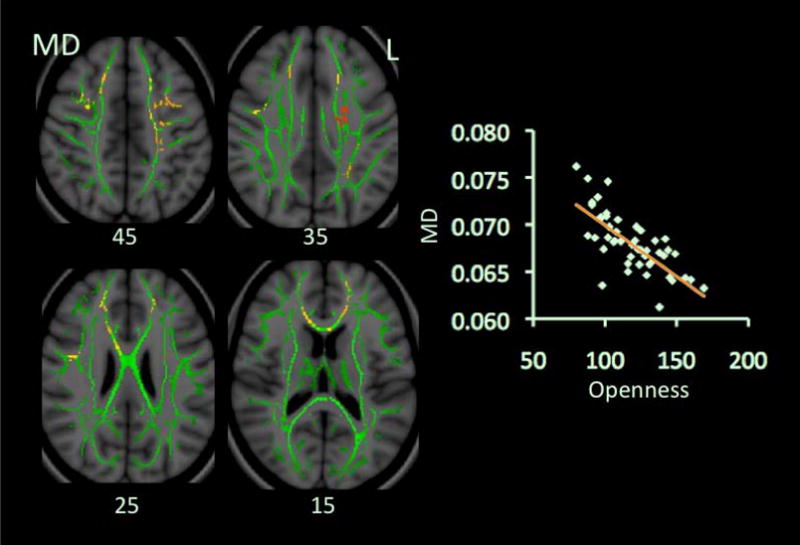
Correlations between scores on Openness and MD values. Red-Yellow color on Montreal Neurological Institute (MNI) T1 template indicates brain regions exhibiting significant correlations between scores on Openness and MD values. Scatter-plots demonstrate correlations between mean MD values (y-axis) and scores on Openness. Abbreviation: L: left.
Agreeableness
A scores negatively correlated with MD but not with FA (Table 2 & Fig. 3). Two clusters in the MD map showed significant correlations. They involved the CR and SLF, bilaterally, and right anterior cingulum. They overlapped with the clusters showing significant correlations with O or N scores at bilateral CR and SLF. Both significant clusters showed negative correlations between A scores and mean values of λ1 and λT. The cluster at the right CR and SLF showed a positive correlation between A and FA (Table 3).
Figure 3.
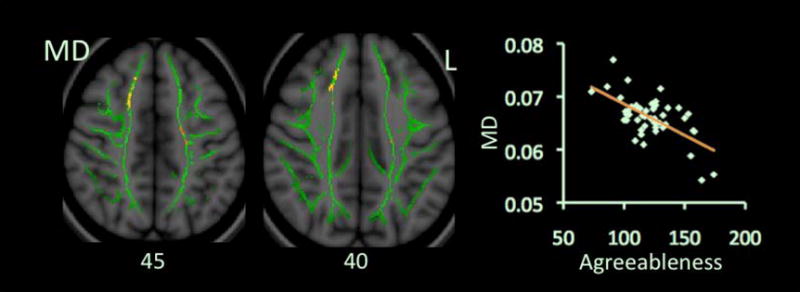
Correlations between scores on Agreeableness and values of MD. Red-Yellow color on Montreal Neurological Institute (MNI) T1 template indicates brain regions exhibiting significant correlations between scores on Agreeableness and values of MD. Scatter-plots demonstrate correlations between mean MD values (y-axis) and scores on Agreeableness. Abbreviation: L: left.
Extraversion & Conscientiousness
E and C scores did not show significant correlations with any DTI parameters.
Discussion
The aim of this study was to investigate relationships between WM integrity and personality traits defined by the FFM. The main findings included: 1) Higher N scores were associated with worse integrity of WM (i.e., higher MD values) in multiple fiber tracts involving the CC, CR, SLF, IFOF, uncinate fasciculus, and anterior cingulum; 2) Higher O scores were associated with better integrity of WM (i.e., lower MD values) in multiple fiber tracts involving the CC, CR, SLF, IFOF, and WM adjacent to the dorsolateral PFC; 3) Higher A scores were associated with better integrity of WM (i.e., lower MD values) in the CR and SLF; and 4) E and C scores did not correlate with WM integrity measures. These findings indicate that personality traits of N, O, and A are associated with integrity of unique and common WM tracts interconnecting multiple cortical and subcortical structures.
Neuroticism
The anterior cingulum and uncinate fasciculus interconnect AC, OFC, and medial and lateral PFC with the amygdala (Mori et al 2005; Schmahmann & Pandya 2007; Schmahmann et al 2008). Therefore, the current data of negative correlations between N scores and integrity of WM in these tracts supports our first prediction of a negative correlation between N scores and integrity of WM interconnecting the PFC and amygdala, and provides the first DTI evidence supporting the hypothesis of decreased top-down emotion regulation from the PFC among persons with high N. The forceps minor and CC body interconnect the two hemispheres, the SLF interconnects the PFC and parietal cortex, the IFOF interconnects the PFC and occipital cortex, and the CR interconnects cortical and subcortical structures including the thalamus, basal ganglia, and midbrain (Mori et al 2005; Schmahmann & Pandya 2007; Schmahmann et al 2008). These fiber tracts together interconnect most, if not all, brain regions. The present findings of negative correlations between N scores and WM integrity in these tracts suggest that a propensity to experience negative affective states as reflected by high N scores is associated with decreased anatomical connectivity among most brain regions, and not just restricted within the fiber tracts interconnecting PFC and amygdala. This observation is consistent with previous findings that N scores are associated with functional activity in extensive brain regions including the PFC, temporal lobe, thalamus, and basal ganglia, with GM volumes in the left OFC and medial temporal lobe including hippocampus, and amygdala, and with the volumes of GM and WM of the whole brain (Canli et al 2001; DeYoung et al 2010; Haas et al 2007; Hooker et al 2008; Jackson et al 2009; Keightley et al 2003; Knutson et al 2001; Kumari et al 2007; Kumari et al 2004 & Gray, 2004; Mobbs et al 2005; Wright et al 2006).
The cluster at the left forceps minor and anterior cingulum showed positive correlations between N and MD, λ1, and λT, and a negative correlations between N and FA. These data suggest that N-related increases in MD in this cluster are associated with an increase in both λ1 and λT and a decrease in FA. It has been suggested that this pattern of changes in DTI parameters may be associated with increased extracellular space after chronic axonal degeneration (Burzynska et al 2010), because similar changes in DTI parameters were observed during chronic stage of corpus callosotomy or traumatic brain injury (Concha et al 2006; Sidaros et al 2008).
The participants did not show significant correlations between FA and N scores after controlling for age and gender and correction for multiple comparisons of voxel-wise whole brain analysis. FA values positively correlate with the ratio of λ1 and λT, while MD values positively correlate with the sum of λ1 and λT. Therefore, concurrent increases in both λ1 and λT may elevate their sum and MD significantly without changing their ratio and FA significantly. This is a potential mechanism contributing to the current finding of significant correlations between N and MD without a significant correlation between N and FA. Furthermore, the current method of voxel-wise whole brain analysis paired with FWE correction for multiple comparisons is statistically conservative and may also contribute to this negative finding. Therefore, a negative finding on correlations between N and FA does not necessarily indicate that N is unrelated to FA. The most parsimonious interpretation of this negative finding is that we did not detect significant relationships between N scores and FA values in the present sample. Similar interpretation can be applied to the negative findings on the relationships between FA values and scores on O and A.
Openness
The present finding of positive correlations between O scores and integrity of WM adjacent to the dorsolateral PFC in both hemispheres supports our prediction of a positive correlation between O scores and integrity of WM interconnecting regions of PFC, and provides DTI data supporting the relevance of WM integrity of PFC-related neurocircuitry to O. O scores also correlated positively with integrity of WM in the anterior cingulum, forceps minor, CC body, CR, SLF, and IFOF. As mentioned above, these fiber tracts together interconnect most, if not all, cortical and subcortical regions. Therefore, this study provides evidence indicating that O associates with the integrity of fiber tracts interconnecting most cortical and subcortical regions, and is not restricted to fiber tracts connecting the dorsolateral PFC. This observation is consistent with previous findings that intelligence is associated with the structure and function of distributed cortical networks including prefrontal, temporal, and parietal cortices (Choi et al 2008; Colom et al 2006; Frangou et al 2004; Gray & Thompson 2004; Haier et al 2004; Narr et al 2007; Perfetti et al 2009), and that subcortical structures including basal ganglia, thalamus, and midbrain are important to cognitive function associated with dorsolateral PFC (Goldman-Rakic 1996; Miller & Cohen 2001; Robbins 2007). However, the present findings differ from those reported when assessing relationships between WM integrity, creativity, and personality traits using DTI, the composite creativity index (CCI) from the Consensual Assessment Technique, and the NEO-FFI, respectively (Jung et al 2010). In this prior study, negative correlations between O and FA values were observed in the right inferior frontal WM, and between CCI and FA values in the left inferior frontal WM (Jung et al 2010). Although the findings may reflect differences in measures employed or subject characteristics, the precise reasons are not clear and warrant further investigation.
All significant clusters showed negative correlations between O and MD, λ1 and λT and positive correlations between O and FA. These data indicate O-related decreases in MD associated with an increase in FA, and a decrease in λT and λ1, though the increase in FA is not large enough to show a positive correlation between FA and O after correction for multiple comparisons. Since FA positively correlates with the ratio of λ1 and λT, the increase in FA indicates a greater decrease in λT than λ1. It has been reported that λT value is associated with myelin integrity (Song et al 2002). Therefore, the negative correlations between O scores and MD in these clusters might be due to better myelin integrity among participants with high O relative to those with low O.
Agreeableness
As mentioned above, the SLF interconnects PFC and parietal cortex, while the CR interconnects cortical and subcortical structures. Therefore, the current finding of negative correlations between A scores and MD values in the bilateral SLF and CR supports our prediction of a positive correlation between A scores and integrity of WM in the CR and SLF, and indicates that high A scores associate with better anatomical connections among PFC, parietal cortex, and subcortical structures. Similar to the clusters showing significant correlations between O and MD, the two significant clusters also showed negative correlations between A and MD, λ1 and λT. Furthermore, the cluster at the left CR and SLF showed a positive correlation between FA and λ1. These data indicate that A-related decreases in MD at the left CR and SLF are associated with greater decreases in λT than λ1. Therefore, the negative correlations between A scores and MD at the left CR and SLF might be due to better myelin integrity among participants with high A relative to those with low A.
Overlap among significant clusters
Clusters showing significant correlations between MD and scores on N, O, and A overlapped in tracts including bilateral CR and SLF. These overlaps indicate that some WM tracts are implicated in more than one trait. The present scores on the five traits showed significant inter-correlations, consistent with previously findings (Digman 1997). Several hypotheses have been proposed to explain these inter-correlations including one-general factor, two-higher order factors, bias in self-evaluation, and same-signed blends of orthogonal factors (Anusic et al 2009; Digman 1997; Jang et al 2006; McCrae et al 2008; Musek 2007; Veselka et al 2009). While the aim of this study was not to find evidence either for or against any of these hypotheses, the finding of overlapping of significant clusters indicates that common WM tracts might contribute to the inter-correlations among FFM traits. Therefore, investigating the relationships between these common WM tracts and these hypotheses may help either validate or invalidate these hypotheses.
Extraversion & Conscientiousness
E and C scores did not show significant correlations with any DTI parameters. These data do not support our hypothesis of a positive correlation between E scores and integrity of WM interconnecting the PFC, parietal cortex, and striatum, and our prediction of a positive correlation between C scores and integrity of WM interconnecting the PFC, parietal cortex, and subcortical structures. These negative findings are puzzling in the context of correlations between scores on N and C and the previous findings of correlations between E and functional connectivity between the AC and inferior parietal lobe (Haas et al 2006) and C and GM volumes in the lateral PFC and OFC (DeYoung et al 2010). However, the current method of voxel-wise whole brain analysis combined with FWE correction for multiple comparisons is statistically conservative and thus might contribute to these negative findings. As discussed above, a negative finding in neuroimaging study does not necessarily indicate that WM integrity is unrelated to E and C. The most parsimonious interpretation of this negative finding is that we did not detect significant relationships between scores on E and C and values of any DTI parameters in the present sample. Future studies with larger samples may be needed to investigate WM contributions to C and E.
Limitations
This study identified WM regions related to the personality traits of N, O, and A. However, these data could not provide insight into the causal relationships between WM integrity and personality traits. Future studies combining genetic and DTI and/or following individuals longitudinally may provide additional insight. This study also explored neurobiological mechanisms underlying FFM-trait-related changes in WM integrity by analyzing the relationships among FA, MD, λ1, and λT. However, values of λ1 and λT are affected by crossing fibers, changes in fiber directions induced by local pathology (Jbabdi et al 2010; Wheeler-Kingshott & Cercignani 2009), and local neuropil packing density (Beaulieu 2002). Therefore, direct investigation of the cellular mechanisms underlying different patterns of changes of FA, MD, λ1, and λT is warranted.
Conclusions
N scores showed negative correlations while O and A scores showed positive correlations with WM integrity measures in multiple fiber tracts interconnecting extensive cortical and subcortical regions. These scores on different personality traits correlated with WM integrity within common fiber tracts including the SLF and CR, and within unique fiber tracts, e.g., N with left uncinate fasciculus and O with WM adjacent to the dorsolateral PFC in both hemispheres. These findings suggest that WM integrity contributes importantly to personality traits, and that DTI represents an important technique in further understanding the neural mechanisms underpinning behaviors and mental health conditions related to personality types.
Highlights.
White matter integrity is implicated in personality traits.
Neuroticism correlates negatively with white matter integrity.
Agreeableness and Openness correlates positively with white matter integrity.
Acknowledgments
This study was funded by the following NIDA grants: K01 DA027750, R01 DA020908, R01 DA019039, RL1 AA017539, P50 DA09241, P20 DA027844. Both authors report that they have no conflicts of interest relevant to the content of this manuscript, and have agreed to all of the content and data of this manuscript. Dr. Potenza has received financial support or compensation for the following: Dr. Potenza consults for and is an advisor to Boehringer Ingelheim; has financial interests in Somaxon; has received research support from the National Institutes of Health, Veteran’s Administration, Mohegan Sun Casino, the National Center for Responsible Gaming and its affiliated Institute for Research on Gambling Disorders, and Forest Laboratories pharmaceuticals; has participated in surveys, mailings or telephone consultations related to drug addiction, impulse control disorders or other health topics; has consulted for law offices on issues related to addictions or impulse control disorders; has provided clinical care in the Connecticut Department of Mental Health and Addiction Services Problem Gambling Services Program; has performed grant reviews for the National Institutes of Health and other agencies; has given academic lectures in grand rounds, CME events and other clinical or scientific venues; and has generated books or book chapters for publishers of mental health texts.
Footnotes
Publisher's Disclaimer: This is a PDF file of an unedited manuscript that has been accepted for publication. As a service to our customers we are providing this early version of the manuscript. The manuscript will undergo copyediting, typesetting, and review of the resulting proof before it is published in its final citable form. Please note that during the production process errors may be discovered which could affect the content, and all legal disclaimers that apply to the journal pertain.
References
- Alexander AL, Lee JE, Lazar M, Field AS. Diffusion tensor imaging of the brain. Neurotherapeutics. 2007;4:316–29. doi: 10.1016/j.nurt.2007.05.011. [DOI] [PMC free article] [PubMed] [Google Scholar]
- Anusic I, Schimmack U, Pinkus RT, Lockwood P. The nature and structure of correlations among Big Five ratings: the halo-alpha-beta model. J Pers Soc Psychol. 2009;97:1142–56. doi: 10.1037/a0017159. [DOI] [PubMed] [Google Scholar]
- Assaf Y, Pasternak O. Diffusion Tensor Imaging (DTI)-based White Matter Mapping in Brain Research: A Review. J Mol Neurosci. 2008;34:51–61. doi: 10.1007/s12031-007-0029-0. [DOI] [PubMed] [Google Scholar]
- Beaulieu C. The basis of anisotropic water diffusion in the nervous system - a technical review. NMR Biomed. 2002;15:435–55. doi: 10.1002/nbm.782. [DOI] [PubMed] [Google Scholar]
- Benedict RH, Hussein S, Englert J, Dwyer MG, Abdelrahman N, et al. Cortical atrophy and personality in multiple sclerosis. Neuropsychology. 2008;22:432–41. doi: 10.1037/0894-4105.22.4.432. [DOI] [PubMed] [Google Scholar]
- Benedict RH, Priore RL, Miller C, Munschauer F, Jacobs L. Personality disorder in multiple sclerosis correlates with cognitive impairment. J Neuropsychiatry Clin Neurosci. 2001;13:70–6. doi: 10.1176/jnp.13.1.70. [DOI] [PubMed] [Google Scholar]
- Bennett IJ, Madden DJ, Vaidya CJ, Howard DV, Howard JH., Jr Age-related differences in multiple measures of white matter integrity: A diffusion tensor imaging study of healthy aging. Hum Brain Mapp. 2010;31:378–90. doi: 10.1002/hbm.20872. [DOI] [PMC free article] [PubMed] [Google Scholar]
- Burzynska AZ, Preuschhof C, Backman L, Nyberg L, Li SC, et al. Age-related differences in white matter microstructure: region-specific patterns of diffusivity. Neuroimage. 2010;49:2104–12. doi: 10.1016/j.neuroimage.2009.09.041. [DOI] [PubMed] [Google Scholar]
- Canli T. Toward a neurogenetic theory of neuroticism. Ann N Y Acad Sci. 2008;1129:153–74. doi: 10.1196/annals.1417.022. [DOI] [PubMed] [Google Scholar]
- Canli T, Zhao Z, Desmond JE, Kang E, Gross J, Gabrieli JD. An fMRI study of personality influences on brain reactivity to emotional stimuli. Behav Neurosci. 2001;115:33–42. doi: 10.1037/0735-7044.115.1.33. [DOI] [PubMed] [Google Scholar]
- Charlton RA, Barrick TR, Markus HS, Morris RG. Theory of mind associations with other cognitive functions and brain imaging in normal aging. Psychol Aging. 2009;24:338–48. doi: 10.1037/a0015225. [DOI] [PubMed] [Google Scholar]
- Choi YY, Shamosh NA, Cho SH, DeYoung CG, Lee MJ, et al. Multiple bases of human intelligence revealed by cortical thickness and neural activation. J Neurosci. 2008;28:10323–9. doi: 10.1523/JNEUROSCI.3259-08.2008. [DOI] [PMC free article] [PubMed] [Google Scholar]
- Cohen MX, Schoene-Bake JC, Elger CE, Weber B. Connectivity-based segregation of the human striatum predicts personality characteristics. Nat Neurosci. 2009;12:32–4. doi: 10.1038/nn.2228. [DOI] [PubMed] [Google Scholar]
- Colom R, Jung RE, Haier RJ. Distributed brain sites for the g-factor of intelligence. Neuroimage. 2006;31:1359–65. doi: 10.1016/j.neuroimage.2006.01.006. [DOI] [PubMed] [Google Scholar]
- Concha L, Gross DW, Wheatley BM, Beaulieu C. Diffusion tensor imaging of time-dependent axonal and myelin degradation after corpus callosotomy in epilepsy patients. Neuroimage. 2006;32:1090–9. doi: 10.1016/j.neuroimage.2006.04.187. [DOI] [PubMed] [Google Scholar]
- Costa PT, Jr, McCrae RR. Influence of extraversion and neuroticism on subjective well-being: happy and unhappy people. J Pers Soc Psychol. 1980;38:668–78. doi: 10.1037//0022-3514.38.4.668. [DOI] [PubMed] [Google Scholar]
- Costa PT, Jr, McCare RR. NEO PI-R professional manual. Odessa, FL: Psychological Assessment Resources; 1992. [Google Scholar]
- Cremers HR, Demenescu LR, Aleman A, Renken R, van Tol MJ, et al. Neuroticism modulates amygdala-prefrontal connectivity in response to negative emotional facial expressions. Neuroimage. 2010;49:963–70. doi: 10.1016/j.neuroimage.2009.08.023. [DOI] [PubMed] [Google Scholar]
- Deckersbach T, Miller KK, Klibanski A, Fischman A, Dougherty DD, et al. Regional cerebral brain metabolism correlates of neuroticism and extraversion. Depress Anxiety. 2006;23:133–8. doi: 10.1002/da.20152. [DOI] [PubMed] [Google Scholar]
- Depue RA, Collins PF. Neurobiology of the structure of personality: dopamine, facilitation of incentive motivation, and extraversion. Behav Brain Sci. 1999;22:491–517. doi: 10.1017/s0140525x99002046. discussion 8–69. [DOI] [PubMed] [Google Scholar]
- DeYoung CG, Hirsh JB, Shane MS, Papademetris X, Rajeevan N, Gray JR. Testing predictions from personality neuroscience: brain structure and the big five. Psychol Sci. 2010;21:820–8. doi: 10.1177/0956797610370159. [DOI] [PMC free article] [PubMed] [Google Scholar]
- DeYoung CG, Peterson JB, Higgins DM. Sources of openness/intellect: cognitive and neuropsychological correlates of the fifth factor of personality. J Pers. 2005;73:825–58. doi: 10.1111/j.1467-6494.2005.00330.x. [DOI] [PubMed] [Google Scholar]
- Diener E, Oishi S, Lucas RE. Personality, culture, and subjective well-being: emotional and cognitive evaluations of life. Annu Rev Psychol. 2003;54:403–25. doi: 10.1146/annurev.psych.54.101601.145056. [DOI] [PubMed] [Google Scholar]
- Digman JM. Higher-order factors of the Big Five. J Pers Soc Psychol. 1997;73:1246–56. doi: 10.1037//0022-3514.73.6.1246. [DOI] [PubMed] [Google Scholar]
- Digman JM, Takemoto-Chock NK. Factors in the natural language of personality: Re-analysis, comparison, and interpretation of six major studies. Multivariate Behavioral Research. 1981 Apr;16 doi: 10.1207/s15327906mbr1602_2. [DOI] [PubMed] [Google Scholar]
- First MB, Gibbon M, Spitzer RL, Williams JBW, Benjamin LS. Structured Clinical Interview for DSM-IV Axis II Personality Disorders (SCID-II): User’s Guide. Washington, DC: American Psychiatric Press; 1997. [Google Scholar]
- First MB, Spitzer RL, Gibbon M, Williams J. Structured Clinical Interview for DSM-IV Axis I Disorders- Patient Edition (SCID-IP, Version 2.0) New York, NY: Biometrics Research Department, New York State Psychiatric Institute; 1996. [Google Scholar]
- Fleeson W. Toward a structure- and process-integrated view of personality: traits as density distribution of states. J Pers Soc Psychol. 2001;80:1011–27. [PubMed] [Google Scholar]
- Fleeson W, Gallagher P. The implications of Big Five standing for the distribution of trait manifestation in behavior: fifteen experience-sampling studies and a meta-analysis. J Pers Soc Psychol. 2009;97:1097–114. doi: 10.1037/a0016786. [DOI] [PMC free article] [PubMed] [Google Scholar]
- Frangou S, Chitins X, Williams SC. Mapping IQ and gray matter density in healthy young people. Neuroimage. 2004;23:800–5. doi: 10.1016/j.neuroimage.2004.05.027. [DOI] [PubMed] [Google Scholar]
- Goldman-Rakic PS. Regional and cellular fractionation of working memory. Proceedings of the National Academy of Sciences of the United States of America; 1996. p. 13480. [DOI] [PMC free article] [PubMed] [Google Scholar]
- Gray JR, Thompson PM. Neurobiology of intelligence: Health implications? Discov Med. 2004;4:157–62. [PubMed] [Google Scholar]
- Graziano WG, Habashi MM, Sheese BE, Tobin RM. Agreeableness, empathy, and helping: a person × situation perspective. J Pers Soc Psychol. 2007;93:583–99. doi: 10.1037/0022-3514.93.4.583. [DOI] [PubMed] [Google Scholar]
- Haas BW, Constable RT, Canli T. Stop the sadness: Neuroticism is associated with sustained medial prefrontal cortex response to emotional facial expressions. Neuroimage. 2008;42:385–92. doi: 10.1016/j.neuroimage.2008.04.027. [DOI] [PMC free article] [PubMed] [Google Scholar]
- Haas BW, Omura K, Amin Z, Constable RT, Canli T. Functional connectivity with the anterior cingulate is associated with extraversion during the emotional Stroop task. Soc Neurosci. 2006;1:16–24. doi: 10.1080/17470910600650753. [DOI] [PubMed] [Google Scholar]
- Haas BW, Omura K, Constable RT, Canli T. Emotional conflict and neuroticism: personality-dependent activation in the amygdala and subgenual anterior cingulate. Behav Neurosci. 2007;121:249–56. doi: 10.1037/0735-7044.121.2.249. [DOI] [PubMed] [Google Scholar]
- Haier RJ, Jung RE, Yeo RA, Head K, Alkire MT. Structural brain variation and general intelligence. Neuroimage. 2004;23:425–33. doi: 10.1016/j.neuroimage.2004.04.025. [DOI] [PubMed] [Google Scholar]
- Harenski CL, Kim SH, Hamann S. Neuroticism and psychopathy predict brain activation during moral and nonmoral emotion regulation. Cogn Affect Behav Neurosci. 2009;9:1–15. doi: 10.3758/CABN.9.1.1. [DOI] [PubMed] [Google Scholar]
- Hooker CI, Verosky SC, Miyakawa A, Knight RT, D’Esposito M. The influence of personality on neural mechanisms of observational fear and reward learning. Neuropsychologia. 2008;46:2709–24. doi: 10.1016/j.neuropsychologia.2008.05.005. [DOI] [PMC free article] [PubMed] [Google Scholar]
- Jackson J, Balota DA, Head D. Exploring the relationship between personality and regional brain volume in healthy aging. Neurobiol Aging. 2009 doi: 10.1016/j.neurobiolaging.2009.12.009. [DOI] [PMC free article] [PubMed] [Google Scholar]
- Jang KL, Livesley WJ, Ando J, Yamagata S, Suzuki A, et al. Behavioral genetics of the higher-order factors of the Big Five. Personality and Individual Differences. 2006;41 [Google Scholar]
- Jbabdi S, Behrens TE, Smith SM. Crossing fibres in tract-based spatial statistics. Neuroimage. 2010;49:249–56. doi: 10.1016/j.neuroimage.2009.08.039. [DOI] [PubMed] [Google Scholar]
- Jung RE, Grazioplene R, Caprihan A, Chavez RS, Haier RJ. White matter integrity, creativity, and psychopathology: disentangling constructs with diffusion tensor imaging. PLoS One. 2010;5:e9818. doi: 10.1371/journal.pone.0009818. [DOI] [PMC free article] [PubMed] [Google Scholar]
- Keightley ML, Seminowicz DA, Bagby RM, Costa PT, Fossati P, Mayberg HS. Personality influences limbic-cortical interactions during sad mood induction. Neuroimage. 2003;20:2031–9. doi: 10.1016/j.neuroimage.2003.08.022. [DOI] [PubMed] [Google Scholar]
- Kim SH, Hwang JH, Park HS, Kim SE. Resting brain metabolic correlates of neuroticism and extraversion in young men. Neuroreport. 2008;19:883–6. doi: 10.1097/WNR.0b013e328300080f. [DOI] [PubMed] [Google Scholar]
- Knutson B, Momenan R, Rawlings RR, Fong GW, Hommer D. Negative association of neuroticism with brain volume ratio in healthy humans. Biol Psychiatry. 2001;50:685–90. doi: 10.1016/s0006-3223(01)01220-3. [DOI] [PubMed] [Google Scholar]
- Kumari V, ffytche DH, Das M, Wilson GD, Goswami S, Sharma T. Neuroticism and brain responses to anticipatory fear. Behav Neurosci. 2007;121:643–52. doi: 10.1037/0735-7044.121.4.643. [DOI] [PubMed] [Google Scholar]
- Kumari V, ffytche DH, Williams SC, Gray JA. Personality predicts brain responses to cognitive demands. J Neurosci. 2004;24:10636–41. doi: 10.1523/JNEUROSCI.3206-04.2004. [DOI] [PMC free article] [PubMed] [Google Scholar]
- Larsen RJ, Ketelaar T. Personality and susceptibility to positive and negative emotional states. J Pers Soc Psychol. 1991;61:132–40. doi: 10.1037//0022-3514.61.1.132. [DOI] [PubMed] [Google Scholar]
- McAdams DP, Olson BD. Personality development: continuity and change over the life course. Annu Rev Psychol. 2010;61:517–42. doi: 10.1146/annurev.psych.093008.100507. [DOI] [PubMed] [Google Scholar]
- McCrae RR, Yamagata S, Jang KL, Riemann R, Ando J, et al. Substance and artifact in the higher-order factors of the Big Five. Journal of Personality and Social Psychology. 2008;95 doi: 10.1037/0022-3514.95.2.442. [DOI] [PMC free article] [PubMed] [Google Scholar]
- Miller EK, Cohen JD. An integrative theory of prefrontal cortex function. Annu Rev Neurosci. 2001;24:167–202. doi: 10.1146/annurev.neuro.24.1.167. [DOI] [PubMed] [Google Scholar]
- Mobbs D, Hagan CC, Azim E, Menon V, Reiss AL. Personality predicts activity in reward and emotional regions associated with humor. Proc Natl Acad Sci U S A. 2005;102:16502–6. doi: 10.1073/pnas.0408457102. [DOI] [PMC free article] [PubMed] [Google Scholar]
- Mori S, Oishi K, Faria AV. White matter atlases based on diffusion tensor imaging. Curr Opin Neurol. 2009;22:362–9. doi: 10.1097/WCO.0b013e32832d954b. [DOI] [PMC free article] [PubMed] [Google Scholar]
- Mori S, Oishi K, Jiang H, Jiang L, Li X, et al. Stereotaxic white matter atlas based on diffusion tensor imaging in an ICBM template. Neuroimage. 2008;40:570–82. doi: 10.1016/j.neuroimage.2007.12.035. [DOI] [PMC free article] [PubMed] [Google Scholar]
- Musek J. A general factor of personality: Evidence for the Big One in the five-factor model. Journal of Research in Personality. 2007;41 [Google Scholar]
- Narr KL, Woods RP, Thompson PM, Szeszko P, Robinson D, et al. Relationships between IQ and regional cortical gray matter thickness in healthy adults. Cereb Cortex. 2007;17:2163–71. doi: 10.1093/cercor/bhl125. [DOI] [PubMed] [Google Scholar]
- Neil JJ. Diffusion imaging concepts for clinicians. J Magn Reson Imaging. 2008;27:1–7. doi: 10.1002/jmri.21087. [DOI] [PubMed] [Google Scholar]
- Nettle D, Liddle B. Agreeableness is related to social-cognitive, but not social-perceptual, theory of mind. European Journal of Personality. 2008;22 [Google Scholar]
- Nichols TE, Holmes AP. Nonparametric permutation tests for functional neuroimaging: a primer with examples. Hum Brain Mapp. 2002;15:1–25. doi: 10.1002/hbm.1058. [DOI] [PMC free article] [PubMed] [Google Scholar]
- Omura K, Todd Constable R, Canli T. Amygdala gray matter concentration is associated with extraversion and neuroticism. Neuroreport. 2005;16:1905–8. doi: 10.1097/01.wnr.0000186596.64458.76. [DOI] [PubMed] [Google Scholar]
- Ozer DJ, Benet-Martinez V. Personality and the prediction of consequential outcomes. Annu Rev Psychol. 2006;57:401–21. doi: 10.1146/annurev.psych.57.102904.190127. [DOI] [PubMed] [Google Scholar]
- Perfetti B, Saggino A, Ferretti A, Caulo M, Romani GL, Onofrj M. Differential patterns of cortical activation as a function of fluid reasoning complexity. Hum Brain Mapp. 2009;30:497–510. doi: 10.1002/hbm.20519. [DOI] [PMC free article] [PubMed] [Google Scholar]
- Rankin KP, Rosen HJ, Kramer JH, Schauer GF, Weiner MW, et al. Right and left medial orbitofrontal volumes show an opposite relationship to agreeableness in FTD. Dement Geriatr Cogn Disord. 2004;17:328–32. doi: 10.1159/000077165. [DOI] [PMC free article] [PubMed] [Google Scholar]
- Robbins TW. Shifting and stopping: fronto-striatal substrates, neurochemical modulation and clinical implications. Philos Trans R Soc Lond B Biol Sci. 2007;362:917–32. doi: 10.1098/rstb.2007.2097. [DOI] [PMC free article] [PubMed] [Google Scholar]
- Roberts BW, Kuncel NR, Shiner R, Caspi A, Goldberg LR. The power of personality: The comparative validity of personality traits, socioeconomic status, and cognitive ability for predicting important life outcomes. Perspectives on Psychological Science. 2007;2 doi: 10.1111/j.1745-6916.2007.00047.x. [DOI] [PMC free article] [PubMed] [Google Scholar]
- Schretlen DJ, van der Hulst EJ, Pearlson GD, Gordon B. A neuropsychological study of personality: Trait openness in relation to intelligence, fluency, and executive functioning. J Clin Exp Neuropsychol. 2010:1–6. doi: 10.1080/13803391003689770. [DOI] [PMC free article] [PubMed] [Google Scholar]
- Sidaros A, Engberg AW, Sidaros K, Liptrot MG, Herning M, et al. Diffusion tensor imaging during recovery from severe traumatic brain injury and relation to clinical outcome: a longitudinal study. Brain. 2008;131:559–72. doi: 10.1093/brain/awm294. [DOI] [PubMed] [Google Scholar]
- Smith S, Jenkinson M, Beckmann C, Miller K, Woolrich M. Meaningful design and contrast estimability in FMRI. Neuroimage. 2007;34:127–36. doi: 10.1016/j.neuroimage.2006.09.019. [DOI] [PubMed] [Google Scholar]
- Smith SM. Overview of fMRI analysis. Br J Radiol. 2004;77(2):S167–75. doi: 10.1259/bjr/33553595. [DOI] [PubMed] [Google Scholar]
- Smith SM, Jenkinson M, Johansen-Berg H, Rueckert D, Nichols TE, et al. Tract-based spatial statistics: voxelwise analysis of multi-subject diffusion data. Neuroimage. 2006;31:1487–505. doi: 10.1016/j.neuroimage.2006.02.024. [DOI] [PubMed] [Google Scholar]
- Smith SM, Jenkinson M, Woolrich MW, Beckmann CF, Behrens TE, et al. Advances in functional and structural MR image analysis and implementation as FSL. Neuroimage. 2004;23(Suppl 1):S208–19. doi: 10.1016/j.neuroimage.2004.07.051. [DOI] [PubMed] [Google Scholar]
- Song SK, Sun SW, Ramsbottom MJ, Chang C, Russell J, Cross AH. Dysmyelination revealed through MRI as increased radial (but unchanged axial) diffusion of water. Neuroimage. 2002;17:1429–36. doi: 10.1006/nimg.2002.1267. [DOI] [PubMed] [Google Scholar]
- Sutin AR, Beason-Held LL, Resnick SM, Costa PT. Sex differences in resting-state neural correlates of openness to experience among older adults. Cereb Cortex. 2009;19:2797–802. doi: 10.1093/cercor/bhp066. [DOI] [PMC free article] [PubMed] [Google Scholar]
- Takeuchi H, Taki Y, Sassa Y, Hashizume H, Sekiguchi A, et al. Regional gray matter density associated with emotional intelligence: Evidence from voxel-based morphometry. Hum Brain Mapp. 2010a doi: 10.1002/hbm.21122. [DOI] [PMC free article] [PubMed] [Google Scholar]
- Takeuchi H, Taki Y, Sassa Y, Hashizume H, Sekiguchi A, et al. White matter structures associated with creativity: evidence from diffusion tensor imaging. Neuroimage. 2010b;51:11–8. doi: 10.1016/j.neuroimage.2010.02.035. [DOI] [PubMed] [Google Scholar]
- Veselka L, Schermer JA, Petrides KV, Cherkas LF, Spector TD, Vernon PA. A general factor of personality: evidence from the HEXACO model and a measure of trait emotional intelligence. Twin Res Hum Genet. 2009;12:420–4. doi: 10.1375/twin.12.5.420. [DOI] [PubMed] [Google Scholar]
- Wheeler-Kingshott CA, Cercignani M. About “axial” and “radial” diffusivities. Magn Reson Med. 2009;61:1255–60. doi: 10.1002/mrm.21965. [DOI] [PubMed] [Google Scholar]
- Whittle S, Yucel M, Fornito A, Barrett A, Wood SJ, et al. Neuroanatomical correlates of temperament in early adolescents. J Am Acad Child Adolesc Psychiatry. 2008;47:682–93. doi: 10.1097/CHI.0b013e31816bffca. [DOI] [PubMed] [Google Scholar]
- Woolrich MW, Jbabdi S, Patenaude B, Chappell M, Makni S, et al. Bayesian analysis of neuroimaging data in FSL. Neuroimage. 2009;45:S173–86. doi: 10.1016/j.neuroimage.2008.10.055. [DOI] [PubMed] [Google Scholar]
- Wright CI, Williams D, Feczko E, Barrett LF, Dickerson BC, et al. Neuroanatomical correlates of extraversion and neuroticism. Cereb Cortex. 2006;16:1809–19. doi: 10.1093/cercor/bhj118. [DOI] [PubMed] [Google Scholar]
- Zhang Y, Du AT, Hayasaka S, Jahng GH, Hlavin J, et al. Patterns of age-related water diffusion changes in human brain by concordance and discordance analysis. Neurobiol Aging. 2010;31:1991–2001. doi: 10.1016/j.neurobiolaging.2008.10.009. [DOI] [PMC free article] [PubMed] [Google Scholar]