Abstract
Purpose
To investigate both T1 and T2 MR relaxation enhancement of Gd substituted Zn-Mn ferrite magnetic nanoparticles. Both uncoated and polyethylene glycol (PEG) coated particles were used.
Materials and Methods
Chemical co-precipitation was used to synthesize particles in the form Mn0.5Zn0.5Gd0.02Fe1.98O4 suitable for hyperthermia applications. Physical characterization of the magnetic nanoparticles included SEM, TEM, ICP, and SQUID. T1 and T2 measurements were performed at 1.5 T.
Results
The saturation magnetization was 12.86 emu/g while the particle’s magnetic moment was 1.86 × 10⁻¹⁹ J/T. The particle size increased due to coating, while 1/T1 and 1/T2 relaxivities (26 °C) decreased from 2.5 to 0.7 and from 201.3 to 76.6 s−1 mM−1, respectively at a magnetic field 1.5 T.
Conclusion
The reduction in both 1/T1 and 1/T2 is attributed to increased distance of closest approach between the protons and the magnetic core caused by the shielding provided by the high molecular weight PEG. 1/T2 data is compared to existing theoretical models using a modified radius that takes into account both possible agglomeration of the particles and increased inter-particle separation induced by PEG coating.
Keywords: nanoparticles, NMR relaxation, coating, contrast agents, susceptibility
INTRODUCTION
Magnetic resonance imaging (MRI) is a powerful medical diagnostic tool due mainly to its non-invasive nature and excellent soft tissue contrast. The availability of many contrast parameters, such as relaxation times, has increased the range of application to new areas of molecular and cell imaging (1, 2). The contrast due to relaxation can be further manipulated by the administration of contrast agents such as gadolinium complexes (3).
Recently new types of based on iron oxide particles on the nanoscale have found new applications such as hyperthermia and drug delivery (4). These magnetic nanoparticles exhibit superparamagnetic behavior (5) with its induced magnetic moment (in the presence of an applied magnetic field) much larger than that of a paramagnetic ion. Hence their contrast ability relative to mass quantity can be much larger as well (i.e. smaller dose).
There are many requirements for the use of MNP as contrast agents. In addition to possessing the appropriate T1 and T2 relaxation enhancement values, they have to be biocompatible, stable, monodispersed, stealth against rapid uptake by the reticuloendothelial system, have a uniform size distribution, and possess targeting properties. Some of these properties depend on the size, composition, and structure of the magnetic core while others will depend on the particle surface that can be modified according to the coating material used. Most common coatings are derivatives of starch, dextran or polyethylene glycol (PEG). The most direct effect of the coating material will be to increase the hydrodynamic size of the particles, therefore reduces its diffusional properties and modifies transport and biodistribution properties (6). Coating also plays a role in the stability of the particles against aggregation and gravitational settling (7).
Many of these particles contain Gd atoms (8) in addition to the iron oxide and many more elements are being tested as new contrast agents (9). We have successfully synthesized particles with Gd substituted Mn-Zn ferrites for use as hyperthermia agents. The substitution of Mn, Zn, and Gd elements into ferrite is important to produce a Curie temperature suitable for cancer therapy. It is generally known that cancer cells are more vulnerable to treatment than normal cells at temperatures 42-43 °C. Particles delivery and heating efficiency have been tested for these particles on rats induced tumors (10). In this work we extend the application of these particles and investigate the MR relaxation enhancement properties for both uncoated and PEG coated particles. It is generally known that the non-magnetic coating layer shields the protons from the magnetic particles and therefore reduce both T1 and T2 relaxation efficiency. However, further factors, such as the time spent near the particle, have to be taken into account especially for T1. Results are presented for both T1 and T2 measurements and further contrasted with already published results in the literature and with theoretical models.
MATERIALS AND METHODS
Synthesis of MnZnGdFe Nanoparticles
Various samples of Gd substituted Mn-Zn Ferrite nanoparticles were synthesized using chemical co-precipitation method and ferritization (11). Solutions of MnCl2, ZnSO4, GdCl3, and FeSO4 were mechanically stirred in deionized water under Argon atmosphere in order to obtain Fe3+, Gd3+, Mn2+ and Zn2+ ions in aqueous solutions. After addition of the co-precipitating base (e.g. NaOH, CH3NH3OH etc) a thick precipitate formed, which was vigorously stirred at room temperature for 30 minutes, and heated for one hour at 90 °C. For the sodium hydroxide base the reaction occurs as follows:
Then this precipitate is transformed into ferrite by heating in the precipitation alkaline solution (ferritization). The reaction for Mn-Zn ferrite particles is as follows:
Thereafter the synthesized nanoparticles were filtered and washed three times with distilled water and three times with acetone. In the last wash the precipitate was collected via filtration and dried at room temperature. Samples made were of the form Mn0.5Zn0.5GdxFe(2-x)O4 with different values for the Gd concentration synthesized. The aim for the sample used in the work was to have a concentration x = 0.02 tested before for hyperthermia applications (10). Afterwards, inductively coupled plasma spectroscopy (Varian Vista-MPX CCD Simultaneous ICP) was used to obtain the true chemical composition of the synthesized MNP. The element mass proportions were used to work out the concentrations (in mM) of Fe per kg weight of agar gel. The nanoparticles were finally prepared in the form of either powder or colloid for characterization.
For coating with PEG (Molecular Weight: 8,000, Polyscience Inc, USA) the particles were divided into two groups. One of them was sonicated in deionized water for five minutes before adding dissolved PEG and mixing lightly to keep the particles dispersed within the PEG layer.
Spinel Structure
The crystalline structure of the Mn0.5Zn0.5Fe2O4 ferrites is the normal spinel structure (12). In normal spinels, the unit cell is of face-centred cubic symmetry. The unit cell (with lattice parameter value, d ~ 0.84 nm) is formed by 32 oxygen atoms (anions) and 24 cations (Mn, Zn, Fe). There are 96 possible positions for cations in the unit cell (64 tetrahedral and 32 octahedral positions). The tetrahedral sites are smaller than the octahedral sites. Only 8 tetrahedral positions (A- positions) and 16 octahedral positions (B- positions) are occupied by cations (divalent or trivalent). In the normal spinel structure, all Mn2+ ions occupy A-sites (tetrahedral positions) and all the Fe3+ ions occupy the B-sites (octahedral positions) (12). The reason for the preference for the normal spinel structure is that the Mn2+ ions, being the smallest amongst the constituent ions, prefer to occupy tetrahedral sites which are smaller than the octahedral sites. Addition of Gd3+ ions results in their occupancy of the octahedral sites. The preference for octahedral sites may be attributed to their large ionic radii (13).
Suspension of MNPs in Agarose Gel
The MNPs, for each of the two groups prepared above, were dispersed in viscous solution of agarose gel followed by ultrasonication to ensure homogeneous distribution. Solutions were then left to dry and solidify in glass tubes (20 × 3 cm). The agarose gel is a high resolution electrophoresis grade (Invitrogen, concentration 1.5%) with a strength 500 g/cm2 and melting point 70 °C. Different concentrations of MNPs were prepared spanning the range 0.0 (control: pure gel) to 0.17 mM Fe per kg gel.
Magnetization and SEM Data
Magnetization curves were obtained at different temperatures using superconducting quantum interference device (Quantum Design MPMS SQUID VSM dc Magnetometer). Scanning electron microscope (SEM) micrographs were obtained (EDX, Jeol Model JSM-5600) from which the average diameter of the nanoparticles and also the size distribution were extracted using image thresholding (Adobe Image Ready 7.0 ME).
MRI Relaxometry
All experiments were performed at a magnetic field strength 1.5 T using a GE SIGNA MR Scanner (Twin Gradient Echo Speed, General Electric, Milwaukee, WI, USA). For the T1 measurement an inversion recovery fast spin-echo (IR-FSE) sequence was used with TE = 15 ms and TR = 6s. Eight values for the inversion time (TI) were used: 50, 100, 250, 700, 1200, 2000, 3000, and 4000 ms. The fast spin-echo (FSE) imaging sequence had the following parameters: FOV 20 cm, matrix 256 × 256, NEX = 1, slice thickness = 5 mm, Echo Train = 16, BW = 15.63 kHz, flip = 90°. For the measurement of T2 seven values of TE were used to generate T2-weighted FSE images with a TR = 4 s: TE = 12, 23, 35, 47, 58, 105, and 152 ms. Image analysis was carried out using Analyze software (Version 4.0, Biomedical Imaging Resource, Mayo Clinic, Rochester, MN, USA). Signal intensities were sampled from ROIs covering 112 pixels (the tube covered 391 pixels in total). Mean values were then fitted to a single exponential curve using non-linear programming (Levenberg-Marquardt) minimizing an error function. An additional ROI was also sampled outside the phantom and the standard deviation of its pixels’ intensities was subtracted from all signal mean values prior to fitting the data in order to correct for errors associated with background noise (14). This analysis generated longitudinal and transverse relaxation time values at different concentrations. The following equation was used to fit relaxation data as function of concentration
| [1] |
1/Ti is the observed relaxation rate at concentration C with i = 1 for the longitudinal (spin-lattice) relaxation and i = 2 for the transverse (spin-spin) relaxation rates (in units s−1), is the relaxation rate of the control sample (i.e. no MNPs), ri is relaxivity (s−1 mM−1). If a linear relationship exists between 1/Ti and C then the relaxivity ri is given by the slope of the straight line fitted to the data.
The r.m.s. Larmor frequency ωr (15) experienced by the proton at the surface of the particle of radius R is given by (S.I. units)
| [2] |
γ is the proton gyromagnetic ratio, μ0 is the permeability of free space, M is the particle magnetization, and μ is the magnetic moment of the particle. Note that ωr is independent of the particle size and only material dependent.
The choice of the theoretical model of T2 relaxation depends on both the size of the particles (i.e. mobility) and the magnitude of the magnetic moment (i.e. the dephasing effect due to field inhomogeneity) through the product parameter ωrτD, where τD = R2/D is the diffusion correlation time (time taken by the proton with diffusion coefficient D to diffuse around a particle of radius R). If ωrτD << 1 then relaxation is within the motionally averaged regime (MAR) where spins motion around particles is very fast and sufficient to average the magnetic field variations caused by the particles (16). However, when ωrτD >> 1 then relaxation is in the static dephasing regime (SDR) where the diffusion coefficient is irrelevant and T2 decay originates from the inhomogeneity of a nearby particle.
Following (15, 16) the expressions for 1/T2 for the two regimes are given by
| [3] |
| [4] |
f is the particulate volume fraction.
RESULTS
The concentration of the elements as worked out from the ICP was Mn:Zn:Gd:Fe = 24.88:15.71:1.84:57.57% in accordance with their initial stoichiometry. The concentration of Gd (x = 0.02) is essential (11) to achieve the required Curie temperature for hyperthermia purposes. The maximum concentration corresponds to a particulate volume fraction f = 2.1 × 10⁻⁶ (f = 4/3 π R3 N0 [C]) where N0 is Planck’s constant and [C] is molarity (in mM/L). For the coated particles the same quantity of magnetic particles was used for the same concentration of iron.
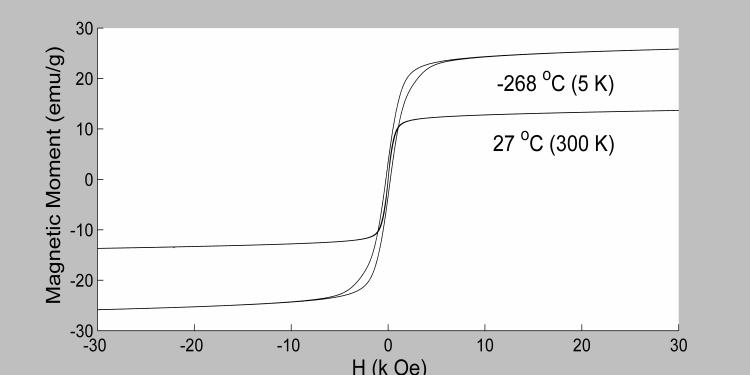
The magnetic moment versus the applied magnetic field profile was measured at two temperatures −268 and 27 °C (figure 1). The saturation magnetization (Ms) was not attained even at large applied magnetic field of 30 kOe, a behavior typical of superparamagnetic material (17). This can be due to a variety of reasons such as the pinning of spins at the surface or canted spins within the sublattice. Fitting the magnetization data to a Langevin function both Ms and the average magnetic moment of the particle (μ) were calculated to be equal to 12.86 emu/g and 1.86 × 10⁻¹⁹ J/T, respectively (300 K). The quality of the fitting was excellent using a single Langevin component indicating a narrow particle size distribution. The mean radii of the uncoated and coated particles were measured from SEM images to be 16.8 nm and 31.5 nm, respectively. This measurement was taken prior to dispersing in agarose gel using sonication and therefore may be an overestimation of the particle sizes due to agglomeration effects.
Figure 1.
Magnetic moment variation (in emu per g of dry nanoparticles) is plotted versus applied magnetic field at two temperatures. Superparamagnetic behavior is observed at 27 °C while small hysteresis remains at −268 °C.
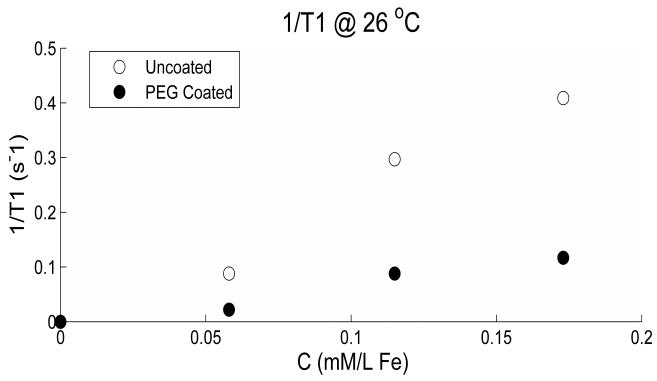
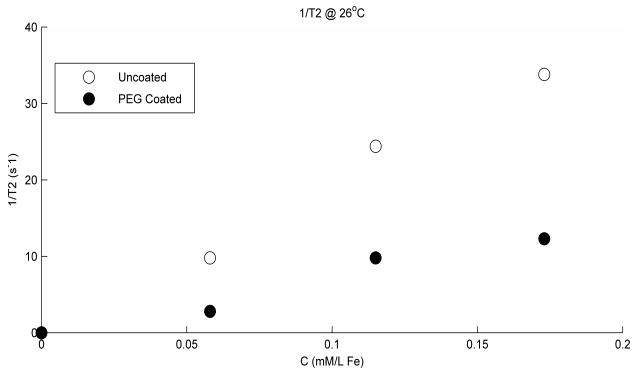
The T1 and T2 values for the undoped gel measured at 26 °C were (mean ± S.D.) 2.3 ± 0.1 s and 87.3 ± 3.0 ms, respectively. The amount of relaxation enhancement by the nanoparticles will depend on the environment in which they exist; therefore, measured rates of doped gel will be different from those in doped water or blood plasma (14). The reason for this is thought to be the type of binding of protons to molecular sites according to the surrounding environment. 1/T1 and 1/T2 values versus concentrations are shown in figures 2 and 3 respectively, for both the coated and the uncoated particles. This is baseline corrected by subtracting the intrinsic gel’s values. The linear slopes or relaxivity r1 and r2 in units s−1 mM−1 are reduced by coating from 2.5 to 0.7 for T1 and from 201.3 to 76.6 for T2 at 26 °C. T1 and T2 weighted data was fitted very well to a single exponential curve with r-squared > 0.99.
Figure 2.
1/T1 variation versus concentration is shown for both the uncoated and the coated particles. The reduction due to coating is very clear for all concentrations used. The linearity of the data is given by the r-squared values 0.976 and 0.961 for the uncoated and coated particles, respectively.
Figure 3.
1/T2 variation versus concentration is shown for both the uncoated and the coated particles. The reduction due to coating is very clear for all concentrations used. The linearity of the data is given by the r-squared values 0.992 and 0.961 for the uncoated and coated particles, respectively.
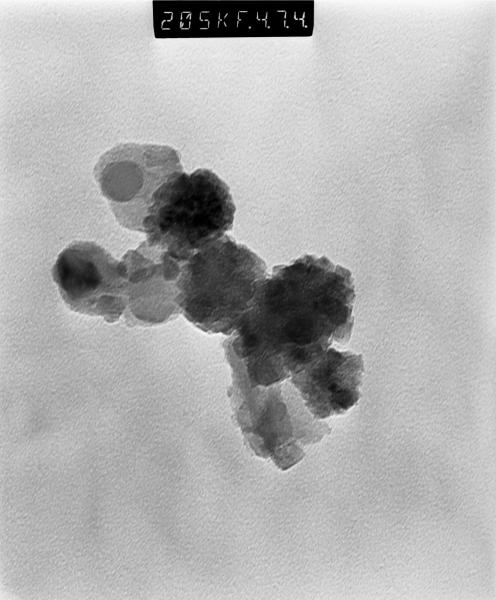
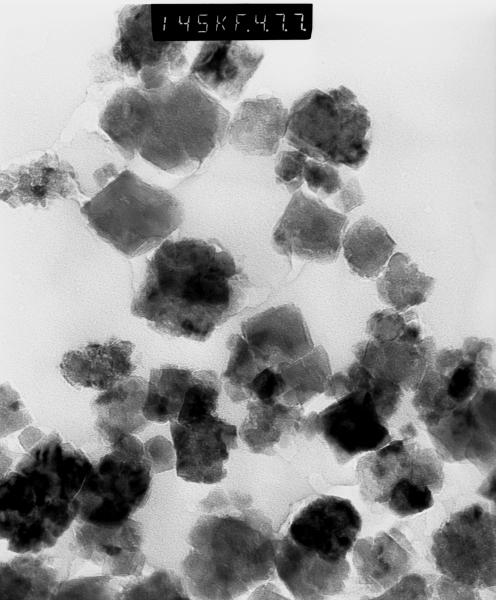
Figures 4 and 5 show TEM images of iron oxide particles before and after PEG coating, respectively. These particles were later dispersed into the agarose gel by light sonication. This process will have a larger dispersing effect on the uncoated particles than on the coated particles because the enveloping PEG layer will hold few particles together and hence effectively increasing the total volume of the particle. It can be clearly seen that PEG coating reduces the agglomeration of particles.
Figure 4.
TEM image for iron oxide uncoated particles prior to sonication and dispersion into agarose gel. Some agglomeration is evident.
Figure 5.
TEM image for iron oxide PEG coated particles prior to sonication and dispersion into agarose gel. It is clear that less agglomeration exists now than in figure 4 and that particles are farther separated from each other.
Using values for the particles’ density (5.2 g/cm3), Ms, and μ an estimate for the particle radius is calculated (18) to be equal to 8.7 nm (smaller than radius measured by SEM, RSEM). We label this magnetization dependent estimate as RMAG and it is obviously based on the assumption of non-interacting particles (Ms = N μ). Using RMAG and μ gives a value for the particles’ magnetization (magnetic moment per unit volume) equal to 66872 J/T/m3. For our sample ωr = 6.7 × 10⁶ rad/s which is smaller than the value for magnetite 3.48 × 10⁷ rad/s corresponding to an equatorial magnetic field B = 1.3 kG (15).
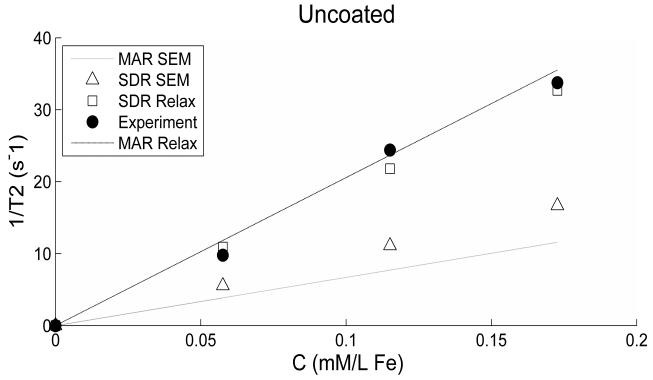
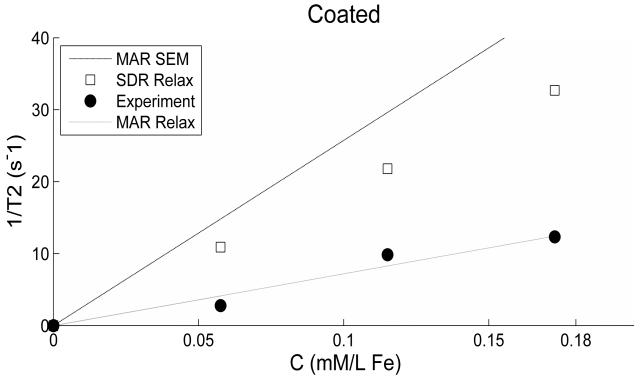
In figures 6 and 7 we have plotted the experimental 1/T2 data along with different models based on the value of the particle radius and ωr (or magnetization) used in equations 3 and 4. The relaxation model (MAR or SDR) uses an adjustable larger value of the particle radius (RREL) than that obtained from the SEM measurement (RSEM) in order to produce better fit of the data as shown in Table 1. RREL basically takes into account the possibility of increased effective size of the particle due to: 1) the aggregation of particles forming a cluster as similarly used by Noginova et al (19) in the case of coated or uncoated particles; and 2) larger inter-particle distance created by PEG coating separating particles as clearly evident in figure 5. An effective magnetization is used for the coated particles derived by scaling the magnetization value for the uncoated particles according to the volume ratio of the two particles. The volume ratio (RREL/RSEM)3 ≥ 1 is the coefficient (α) accounting for both the aggregation and the non-magnetic part of the cluster. The value of α for the uncoated particles 14 is smaller than that for the coated ones 325.
Figure 6.
Experimental and theoretical 1/T2 values are plotted versus concentration for the uncoated particles. Theoretical values use different estimates for the particles radius (as explained in the text) with the modified estimate (RREL) producing closer fit to the experimental data. Radius estimates (from SEM and Relaxation) are similar in values.
Figure 7.
Experimental and theoretical 1/T2 values are plotted versus concentration for the coated particles. Details are as for figure 6.
TABLE 1.
Particles’ radii and the corresponding product ωrτD.
| Radius (nm) | ω r τ D | |||
|---|---|---|---|---|
| Uncoated | Coated | Uncoated | Coated | |
| SEM | 16.8 | 31.5 | 0.79 | 1.54 |
| Relaxation | 20.1 | 60.0 | 1.23 | 0.43 |
For the uncoated particles, it is possible to use a single radius value in the models of both motional regimes producing good fittings to the experimental data (figure 6). However, for the coated particles only MAR model fits the data well (figure 7).
The product parameter ωrτD calculated using the various values of particle radii is given in Table 1 as well. Finally, the theoretical ratio (T2Coated/T2Uncoated) calculated using equation 3 is 3.18 while the experimental ratio is 2.91 (averaged over the three concentrations).
DISCUSSION
Coating plays an important role in the functionalization of the particles. For example, modifying surface properties affects agglomeration and settling properties (7) and improves particle delivery by minimizing particle uptake by mononuclear phagocyte systems (20). The role of the dense brushes of polymers is to inhibit the in vivo adsorption of biological elements, especially proteins, which is the first step of the macrophage system activation (7, 21). In the literature, the most common coatings are derivatives of dextran and PEG. PEG is hydrophilic and is widely used in biological research, as it protects surfaces from interacting with cells or proteins. Thus, coated particles may result in increased blood circulation time. It has been demonstrated that PEG-modified nanoparticles can interact with cell membranes, resulting in enhanced cellular response, as these coatings on the nanoparticles are biocompatible, nonimmunogenic, and nonantigenic (22). For our multi-functional application, we think that PEG coating may affect hyperthermia as well as MR relaxation because the heat generated by the particles may cause partial melting of the solid shell surrounding the particle. This leads to changing the viscosity of the shell. We have chosen heavy molecular weight PEG with melting temperature slightly above that used in hyperthermia. We are currently analyzing relaxation data acquired at hyperthermia settings.
The main result presented in this study is that both T1 and T2 relaxation rates measured at 1.5 T are significantly reduced by PEG coating the magnetic particles. The relaxation rates reduction produced by the PEG coating can be due to the increased distance of closest approach by the gel’s protons to the magnetic cores of the coated particles. The effective particle volume is increased by coating as clearly evident in the TEM micrograph in figure 5. This increase occurs without increasing the magnetic moment since PEG is not magnetic. The protons diffusing in the vicinity of the particles, therefore, experience a smaller dipolar magnetic field. This reduction effect is applicable for both T1 and T2 processes as clearly shown in our results (figures 2 and 3).
The effect of PEG coating has been previously studied by LaConte et al (23). Their monocrystalline iron oxide nanoparticles (MIONs), were coated with a PEG-modified, phospholipid micelle coating, with different PEG molecular weights (MW) ranging from 500 to 5000 g/mol. Increasing MW leads to increasing thickness of the coating layer independently from modifying the magnetic core. Their results showed that 1/T1 increases with PEG MW (or equivalently with PEG thickness) while 1/T2 decreases. Both 1/T1 and 1/T2 values exhibited a jump between MW 750 and 1000. In order to explain these results LaConte et al relied on two factors: 1) PEG layer increases distance of water spins closest approach to the magnetic moment; and 2) outer layer of PEG can be invaded by slowly diffusing water molecules with a reduced diffusion coefficient (2.5 × 10⁻¹⁰ m2/s) from that of the bulk water value. It seems, therefore, that increasing PEG thickness leads to competing effects for the above mentioned two factors: reducing R1 and R2 due to increased distance from the magnetic moment, while increasing R1 and R2 (at least theoretically) due to the fact that spins now spend more time (because of reduced mobility) near magnetic fields. The model, however, failed to explain why their data exhibited a jump at the MW 750/1000 values. The choice of a single value for the reduced diffusion coefficient may be important in the interpretation of their results particularly as the range of MW used is very large. Choosing a variable diffusion coefficient may explain results more accurately. Also, for the reduced diffusion coefficient to be effective in enhancing relaxation there has to be sufficient residence time for the diffusing spins to exchange with bulk waters. This will certainly depend on the MW and the layer thickness of the PEG used and also on the echo times employed in the imaging sequence. We have used, however, a much heavier PEG type with a MW of 8000 g/mol which reduces water mobility in the region surrounding the magnetic core even further. Another important difference is that the particle size and magnetization used in their study renders the motional regime fully into the motionally averaged regime which has a different dependence on the diffusion coefficient from our sample which lies in the intermediate motion regime. It is also likely that spins mobility around particles is further reduced in our study due to the different structure (i.e. few particles scattered within a PEG flake of larger thickness) rather than a PEG-modified micelle containing single crystal. The reduction in 1/T1 is also seen in another study (24) where it is claimed that PEG acts as a barrier for unhindered water diffusion. Good agreement between measured data and theoretical model was achieved when choosing particle radius RREL bigger than RSEM that takes into account the effect of particle aggregation and increased inter-particle spacing caused by PEG coating. These two effects were quantified through a packing factor (α). The larger α value for the coated particles support our model that PEG coating reduces particle aggregation by increasing inter-particle spacing. Differences in the various estimates of the radius may also be due to the presence of size distribution of the particles (25).
In conclusion new magnetic nanoparticles, synthesized of elements Zn, Mn, Gd elements and iron oxides, are used as MRI contrast agents in addition to their hyperthermia usage. PEG coating reduces both T1 and T2 relaxation enhancement and can be used to control relaxivity. Furthermore, PEG coating reduces particle aggregation.
ACKNOWLEDGMENTS
We thank Mr Saeed Tariq and Dr Ahmed Ayesh for their help in obtaining TEM images.
Grant Support: This work is supported by grants from the Emirates Foundation (EF 29-2009 133), British Council (RC GS 248) and NIH (1R21CA141133-01).
REFERENCES
- 1.Franger S, Berthet P, Dragos O, Baddour-Hadjean R, Bonville P, Berthon J. Large influence of the synthesis conditions on the physico-chemical properties of nanostructured Fe3O4. J Nanoparticles Res. 2007;9:389–402. [Google Scholar]
- 2.Qiang Y, Anthony J, Sharma A, Nutting J, Sikes D, Meyer D. Iron/iron oxide core-shell nanoclusters for biomedical applications. J Nanoparticles Res. 2006;8:489–496. [Google Scholar]
- 3.Caravan P, Ellison JJ, McMurry TJ, Lauffer RB. Gadolinium(III) Chelates as MRI Contrast Agents: Structure, Dynamics, and Applications. Chem Rev. 1999;99:2293–352. doi: 10.1021/cr980440x. [DOI] [PubMed] [Google Scholar]
- 4.Bulte JW, Kraitchman DL. Iron oxide MR contrast agents for molecular and cellular imaging. NMR Biomed. 2004;17:484–499. doi: 10.1002/nbm.924. [DOI] [PubMed] [Google Scholar]
- 5.Bean CP, Livingston JD. Superparamagnetism. J Appl Phys. 1959;30:12OS–129S. [Google Scholar]
- 6.Di Marco M, Guilbert I, Port M, Robic C, Couvreur P, Dubernet C. Colloidal stability of ultrasmall superparamagnetic iron oxide (USPIO) particles with different coatings. Int J Pharma. 2007;331:197–203. doi: 10.1016/j.ijpharm.2006.11.002. [DOI] [PubMed] [Google Scholar]
- 7.Guptaa AK, Gupta M. Synthesis and surface engineering of iron oxide nanoparticles for biomedical applications. Biomat. 2005;26:3995–4021. doi: 10.1016/j.biomaterials.2004.10.012. [DOI] [PubMed] [Google Scholar]
- 8.Engström M, Klasson A, Pedersen H, Vahlberg C, Käll P-O, Uvdal K. High proton relaxivity for gadolinium oxide nanoparticles. Magn Reson Mater Phy Biol Med. 2006;19:180–186. doi: 10.1007/s10334-006-0039-x. [DOI] [PubMed] [Google Scholar]
- 9.Maenosono S, Suzuki T, Saita S. Superparamagnetic FePt nanoparticles as excellent MRI contrast agents. J Magn Magn Mat. 2008;320:L79–L83. [Google Scholar]
- 10.Haik Y, Issa B, al-Ramadi B, Qadri S, Hayek S. Minimally Invasive Magnetic Hyperthermia Therapy. Proceedings of the 16th ICMP; Dubai, UAE. 2008. [Google Scholar]
- 11.Mohite V. MSc Thesis. Florida State University; USA: 2004. Self controlled magnetic hyperthermia. [Google Scholar]
- 12.Chikazumi S. Physics of Ferromagnetism. Oxford University Press; 1997. [Google Scholar]
- 13.Upadhyay RV, Mehta RV, Parekh K, Srinivas D, Pant RP. Gd-substituted ferrite ferrofluid: a possible candidate to enhance pyromagnetic coefficient. J Magn Magn Mater. 1999;201:129–132. [Google Scholar]
- 14.Rohrer M, Bauer H, Mintotovitch J, Requardt M, Weinmann HJ. Comparison of Magnetic Properties of MRI Contrast Media Solutions at Different Magnetic Field Strengths. Invest Radiol. 2005;40:715–724. doi: 10.1097/01.rli.0000184756.66360.d3. [DOI] [PubMed] [Google Scholar]
- 15.Gillis P, Moiny F, Brooks RA. On T2-shortening by strongly magnetized spheres: a partial refocusing model. Magn Reson Med. 2002;47:257–263. doi: 10.1002/mrm.10059. [DOI] [PubMed] [Google Scholar]
- 16.Gillis P, Koeing SH. Transverse relaxation of solvent protons induced by magnetized spheres: application to ferritin, erythrocytes, and magnetite. Magn Reson Med. 1987;5:323–45. doi: 10.1002/mrm.1910050404. [DOI] [PubMed] [Google Scholar]
- 17.Upadhyay T, Upadhyay RV, Mehta RV, Aswal VK, Goyal PS. Characterization of a temperature-sensitive magnetic fluid. Phys Rev B. 1997;55:5585–5588. [Google Scholar]
- 18.Giessen AAVD. Magnetic properties of ultra-fine iron (III) oxide-hydrate particles prepared from iron (III) oxide-hydrate gels. J Phys Chem Solids. 1967;28:343–346. [Google Scholar]
- 19.Noginova N, Weaver T, Andreyev A, Radocea A, Atsarkin VA. NMR and spin relaxation in systems with magnetic nanoparticles: effect of size and molecular motion. J Phys: Cond Matt. 2009;25:255301–7. doi: 10.1088/0953-8984/21/25/255301. [DOI] [PubMed] [Google Scholar]
- 20.Moghimi SM, Hunter AC, Murray JC. Long-Circulating and Target-Specific Nanoparticles: Theory to Practice. Pharmacol Rev. 2001;53:283–318. [PubMed] [Google Scholar]
- 21.Khemtong C, Togao O, Ren J, et al. Effect of PEG Corona Lengths on MR Relaxivity and Off-resonance Saturation Sensitivity of Superparamagnetic Polymeric Micelles. Proceedings of ISMRM Stockholm; Sweeden. 2010. [Google Scholar]
- 22.Amimji M, Park K. Prevention of protein absorption and platelet adhesion on surfaces by PEO/PPO/PEO triblock copolymers. Biomaterials. 1992;13:682–692. doi: 10.1016/0142-9612(92)90128-b. [DOI] [PubMed] [Google Scholar]
- 23.LaConte LEW, Nitin N, Zurkiya O, et al. Coating thickness of magnetic iron oxide Nanoparticles affects R2 relaxivity. J Magn Reson Imag. 2007;26:1634–1641. doi: 10.1002/jmri.21194. [DOI] [PubMed] [Google Scholar]
- 24.Bulte JWM, de Cuyper M, Despres D, Frank JA. Preparation, relaxometry, and biokinetics of PEGylated magnetoliposomes as MR contrast agent. J Magn Magn Mater. 1999;194:204–209. [Google Scholar]
- 25.Ouakssim A, Fastrez S, Roch A, et al. Control of the synthesis of magnetic fluids by relaxometry and magnetometry. J Magn Magn Mater. 2004;272-276:1711–1713. [Google Scholar]


