Abstract
Individual peptide groups in proteins must exhibit some variation in the chemical shift anisotropy (CSA) of their constituent atoms, but not much is known about the extent or origins of this dispersion. Direct spectroscopic measurement of CSA remains technically challenging, and theoretical methods can help to overcome these limitations by estimating shielding tensors for arbitrary structures. Here we use an automated fragmentation quantum mechanics/molecular mechanics (AF-QM/MM) approach to compute 15N, 13C′ and 1H chemical shift tensors for human ubiquitin and the GB1 and GB3 fragments of staphylococcal protein G. The average and range of variation of the anisotropies is in good agreement with experimental estimates from solid-state NMR, and the variation among residues is somewhat smaller than that estimated from solution-state measurements. Hydrogen-bond effects account for much of the variation, both between helix and sheet regions, and within elements of secondary structure, but other effects (including variations in torsion angles) may play a role as well.
1 Introduction
Nuclear magnetic resonance (NMR) spectroscopy provides valuable information about the three dimensional structures of macromolecules. Chemical shifts can be easily measured and used as restraints in protein structure determination and refinement (Wishart and Case, 2001; Shen et al, 2008). Chemical shift anisotropy (CSA) can also be an excellent indicator of the local electronic and molecular environment (Sitkoff and Case, 1998; Gu and McDermott, 1993; Lipsitz and Tjandra, 2003), but much less is known about its connection to structure, especially for N, C′ and H atoms in the peptide group itself. (Scheurer et al, 1999; Tjandra and Bax, 1997; Sitkoff and Case, 1998). The interpretation of chemical shift tensors in proteins is expected to be complicated by their dependence to a large number of environmental factors, such as the conformation of neighboring residues, hydrogen bonding and long-range electrostatics (Sitkoff and Case, 1998; Brender et al, 2001). A better understanding of these issues could help in characterizing protein and structure and dynamics, and in aiding the interpretation of the CSA components of spin-relaxation.
In solution NMR, the direction and magnitude of chemical shift tensors cannot be directly measured due to isotropic tumbling. Instead, anisotropies can be estimated from relaxation and CSA-dipolar cross-correlation experiments at multiple spectrometer fields (Kroenke et al, 1999; Fushman et al, 1998), or from shifts in peaks upon partial alignment (Burton and Tjandra, 2007). Solid state NMR experiments provide more direct information, but often require site-specific labeling and multiple independent CSA measurements, which can be technically challenging. As a result, most direct CSA measurements and interpretations have been performed on small peptides (Yao et al, 2002; Wei et al, 2001; Hartzell et al, 1987; Wei et al, 1999; Poon et al, 2004; Wu et al, 1995). Nevertheless, recent advances in solution and solid state NMR techniques have allowed CSA to be systematically measured for a few small, globular proteins, including the GB1 and GB3 fragments of staphylococcal protein G, binase and ubiquitin (Cisnetti et al, 2004; Hall and Fushman, 2006; Wylie et al, 2007; Loth et al, 2005; Pang and Zuiderweg, 2000; Yao et al, 2010a,b). These revealed a significant but inconsistent dependence of the CSAs on the protein backbone conformation.
Theoretical predictions can compensate for the limited dataset from experimental studies and help elucidate the structural information implicated in experimental measurements (Case, 2000). Over the past decade, quantum mechanical calculations have facilitated NMR structure refinement by establishing empirical relationships between structural features and isotropic chemical shifts (Oldfield, 1995; Casabianca and De Dios, 2008). Density functional theory (DFT) based methods have been used extensively to characterize chemical shielding tensors for di- and tri-peptide species (Poon et al, 2004; Heller et al, 1997; Havlin et al, 2001; Sitkoff and Case, 1998; Bim et al, 2004). More recently, Czinki and coworkers mapped the 15N and 13C CSA surface using L-Ala-NH2 as a model for peptides and proteins (Czinki et al, 2007). Cai et al. (2009; 2011) also calculated the 15N chemical shift tensors of the selected residues in GB3 protein using a variety of peptide models. While these recent studies provide some understanding to the influence of protein geometry on chemical shift tensors, the effects of the complete protein environment remains to be assessed quantitatively.
In the present study, we adapted and extended the automated fragment-quantum mechanics/molecular mechanics (AF-QM/MM) model developed by He and coworkers (He et al, 2009). In this model, the central protein fragment is treated with quantum mechanics and the rest of the protein and solvent environment are represented by point charges. It was originally applied to Trp Cage mini-protein to predict proton isotropic shieldings and achieved considerable agreement with experimental measurements (He et al, 2009). We report here the CSA tensors of 15N, 13C and 1H nuclei for GB1, GB3 and ubiquitin using a number of different experimental structures, where the quality of the CSA predictions are evaluated and the environmental effects are assessed.
2 Methods
2.1 Structure regularization
Table 1 lists the protein structures used here, which were determined by NMR spectroscopy or X-ray crystallography. Some “regularization” of the experimental structures via 10 steps of molecular mechanics based energy minimization appears to improve the results. During energy minimization, the aqueous environment was approximated by the Hawkins, Cramer and Truhlar (HCT) form of pairwise generalized Born (GB) model approach implemented in the Nucleic Acid Builder (NAB) program (Hawkins et al, 1995; Macke and Case, 1998). Each of the structures were relaxed for 10 steps using the Polak-Ribiere conjugate gradient algorithm. This mainly serves to bring bond lengths and bond angles close to the “ideal” values specified in the force field, while changing little else in the structure. As shown in Table 1, the backbone change is 0.1 to 0.2 Å. This procedure also removes side-chain steric clashes, while preserving the backbone geometry (including φ, ψ and ω angles) of the experimental structure. This stage proved to be crucial in achieving relatively consistency, given different starting PDB structures acquired under different experimental conditions. For example, prior to minimization, the 13C CSA values calculated from 1P7E and 1IGD structures deviate by as much as 9.34 ppm for individual nuclei, but this difference is reduced to 3.32 ppm after minimization. Furthermore, partial minimization leads to better trends with regards to secondary structure. For example, in the 1IGD structure, the helix-sheet difference (discussed below) for the15N CSA increased from 3.9 ppm to 9.8 ppm after the refinement, which is much closer to the experimental difference of 9.9 ppm.
Table 1.
RMSD change upon 10 steps of minimization, relative to the original crystal structure. The fitted atoms include all backbone atoms for residues 3–54 for GB1/GB3, and residues 3–74 for ubiquitin. For the 1D3Z entry, coordinates from model 1 were used.
| Protein | PDB ID | Backbone RMS |
|---|---|---|
| GB3 | 1P7E | 0.15 |
| “ | 1IGD | 0.21 |
| “ | 2OED | 0.14 |
| GB1 | 1PGA | 0.20 |
| “ | 2QMT | 0.11 |
| ubiquitin | 1UBQ | 0.07 |
| “ | 1D3Z | 0.18 |
2.2 Chemical Shift Tensor Calculations
The AF-QM/MM model takes the entire protein and solvent effects into consideration in the following fashion. The protein is partitioned into the core and buffer region to be treated with quantum mechanics, whereas the rest of the protein and solvent effects are represented by point charges. The core region includes the CA-N-CA segment of the backbone of the nth amino acid, together with directly attached side-chains.
The buffer region is defined to include residues described by the following criteria:
i) The (n•2)th, (n−1)th, (n+1)th and (n+2)th residues in the protein.
ii) The residues within 4 Å of the core region, where at least one of the contacting atoms is nonhydrogen.
iii) The residues within 3 Å of the core region, where both contacting atoms are hydrogens.
iv) The residues within 5 Å of the core region, where the contacting atoms include a heavy atom from an aromatic ring from the buffer region, and any atom from the core region.
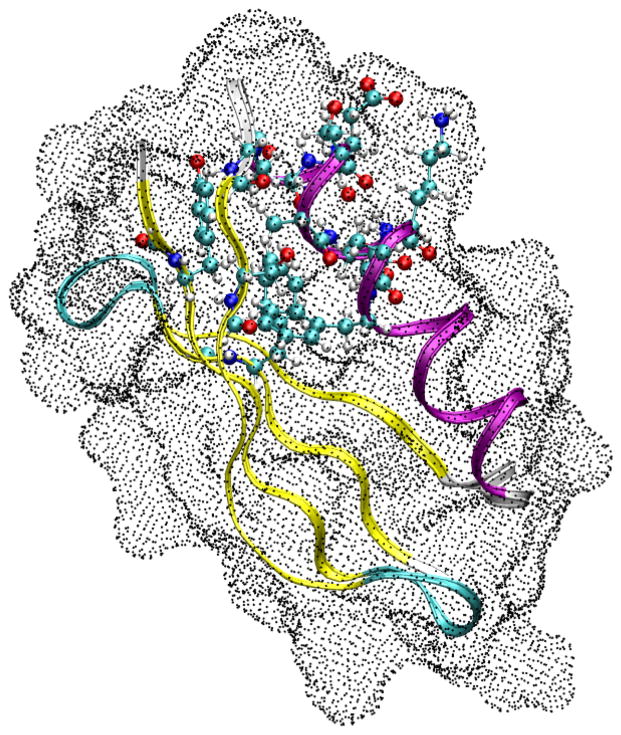
The rest of the protein environment is represented by partial atom charges defined in the AMBER94 forcefield (Cornell et al, 1996). In addition, the solvent effect is approximated by Poisson Boltzmann based grid charges, as shown in Fig. 1. In order to generate these surface charges, the self consistent reaction field was calculated by solving the Poisson Boltzmann (PB) equation iteratively using the Amber pbsa program:
where κ is the modified Debye-Huckel parameter reflecting the salt concentration (here taken to be 0.1 M of a 1-1 electrolyte) and temperature. ε(r) is the dielectric constant distribution in space, which were set to 1.0 and 80.0 for solute and solvent, respectively. φ(r) is the electrostatic potential to be calculated. ρ(r) is the solute charge distribution, described by the Amber force field atomic charges. According to PB theory, the solute produces an electrostatic field in the solute region and solvent region, including the solvent reaction field and the Coulomb field. The reaction field is generated by the polarization in the solvent, and can be represented by a set of point charges on the molecular surface; we employed a spacing of 0.75 Å for these surface charges, yielding between 5,000 and 12,000 charges, depending on the size of the fragment.
Figure 1.
AF-QM/MM model for CSA Calculation. The central QM region, represented by ball-and-stick model, is calculated on B3LYP/6-31G* level. The rest of the protein, represented in ribbons, are treated as AMBER charges. The entire protein is embedded in surface charges rendered as dots.
With these fragments, two quantum chemistry methods (somewhat arbitrarily chosen) were used to compute shielding tensors. In the first (method 1), Gauge Independent Atomic Orbital (GIAO) calculations of the chemical shielding tensors (Ditchfield, 1974) were performed using the B3LYP functional (Becke, 1993) with the Gaussian 03 program (Frisch et al, ????). The second method (method 2) used the DeMon 2k program (Koster et al, 2006) to compute shieldings, using OLYP functional (Tozer and Handy, 1998; Wilson et al, 1999) and the independent gauge for localized orbitals (IGLO) model. Within the core region, the central fragment CA-C(O)-N(H)-CA was treated with a locally dense basis set, whereas the rest of the core region and buffer region were treated with a smaller basis set (Tang and Case, 2007). In the Gaussian and deMon calculations, the locally dense basis set scheme is cc-pvTZ/6-31G** and iglo-iii/dzvp, respectively.
The differences in results between the two methods we have chosen here have little to do with the program used for the calculation, and are mainly from the difference in functionals. As we have discussed earlier (Moon and Case, 2006), relative values of isotropic shieldings and their anisotropies are rather insensitive to either the density functional used or the basis set (beyond a certain level); absolute anisotropies are generally larger with hybrid functionals than with non-hybrids, and the results found here confirm this, with the hybrid results being closer to experiment than the non-hybrids. But in general, the less-expensive non-hybrid calculations give trends that are nearly as useful those from hybrid calculations. Further discussions of this point, covering isotropic shifts for a much larger range of proteins, will be published elsewhere.
The calculated chemical shift tensors were symmetrized and diagonalized to obtain the three principal components. The magnitude of these principal components was ranked according to their deviation from the isotropic shift, δiso.
| (1) |
The reduced anisotropy (Δδred) is defined as the difference between the largest tensor and the isotropic chemical shift according to the Haeberlen conventions (Haeberlen, 1976):
| (2) |
Solution NMR analyses often use a shielding anisotropy (Δσ), which is the difference between the largest tensor and the average of the other two tensors:
| (3) |
For consistency, we will use the “reduced” anisotropy of Eq. 2 here. The asymmetry parameter describes the deviation from axial symmetry:
| (4) |
3 Results and Discussion
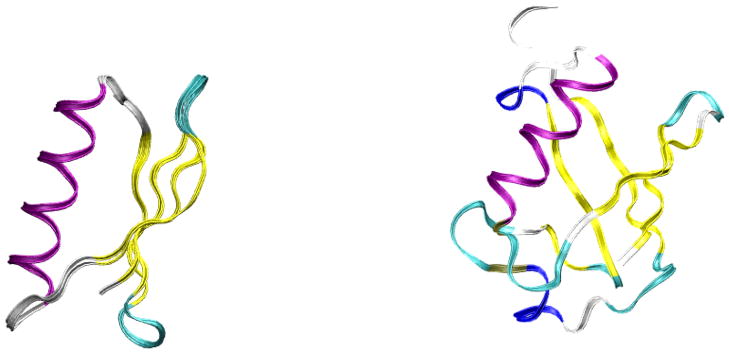
GB1 and GB3 proteins are the B1 and B3 domains of immunoglobulin G, respectively. They have exactly the same fold, including one α-helix and four antiparallel β-strands (Figure 2). Their sequences are comprised of 17 types of amino acids and differ by only 7 residues from each other (Figure 3). Human ubiquitin has a mixed topology, with a smaller fraction of amino acids in regions of regular secondary structure. Both systems have had experimental structures determined by X-ray crystallography and by NMR, as shown in Table 1.
Figure 2.
(Left:) overlapped GB1 and GB3 structures. The α-helix is rendered in purple and the β-sheets are rendered in yellow. (Right:) same for ubiquitin.
Figure 3.
Sequence alignment of GB1 and GB3 proteins
3.1 13C and 15N tensors in GB1
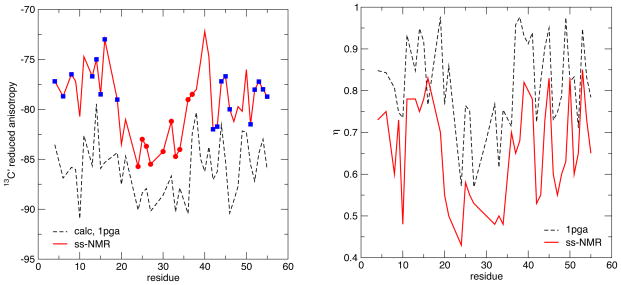
Solid-state NMR measurements offer the most direct method to obtain information about chemical shielding tensors, and we begin with a comparison to such results for GB1 (Wylie et al, 2007), given in Table 2 and Figs. 4 and 5. For the 13C′ shieldings, the experimental anisotropies are systematically larger in absolute magnitude than the method 2 (OLYP) results by around 5 ppm, but systematically smaller than results from method 1 (B3LYP) predictions by about the same amount (Table 2). Both calculated and observed results show a clear trend where Δδred is more negative in the helical regions (near the center of the sequence) than in the sheet regions (nearer the termini); the asymmetry η is also lower in helical than in sheet regions. [For tensors with asymmetries near unity, small changes can flip the sign of Δδred; this happened for two residues in the calculations; for simplicity, we have plotted all values in Fig. 4 as negative.] Some, but not all, of the variations within regions of secondary structure are also captured in the calculations, and the range of anisotropies is nearly the same in the calculations (12 ppm) as in the experiment (13 ppm). The fact that the calculated results are larger in absolute magnitude than the observed values (at least for method 1), is qualitatively consistent with the fact that the observed results are motionally averaged whereas the calculated results are not. Multiplying the calculated results by an order parameter of 0.95 would markedly improve agreement with experiment, and this amount of motional averaging is roughly consistent with (although somewhat larger than) estimates we derived earlier from studies on model peptides (Tang and Case, 2007). However, given the reasonably strong dependence of the calculated CSA on basis set and functional (Moon and Case, 2006), it is not possible from these data to draw more than very qualitative conclusions about the extent of motional averaging that might be present in the observed data.
Table 2.
Reduced 13C and 15N CSA (Δδred) averages for α-helical and β-sheet regions of GB1; also reported are the uncertainties in the mean values.
| PDB | method | Nuclei | Helix | Sheet | Difference |
|---|---|---|---|---|---|
| 2qmt | 1 | 13C | −86.3±0:8 | −84.5±0:5 | −1.8 |
| 2 | 13C | −76.2±0:8 | −74.9±0:5 | −1.4 | |
| 1pga | 1 | 13C | −87.6±0:5 | −84.1±0:5 | −3.5 |
| 2 | 13C | −76.8±0:8 | −74.3±0:5 | −2.5 | |
| experimental | 13C | −83.0±0:8 | −78.2±0:5 | −4.8 | |
| 2qmt | 1 | 15N | 108.2±1:5 | 102.1±0:8 | 6.1 |
| 2 | 15N | 101.8±1:4 | 95.6±0:8 | 6.2 | |
| 1pga | 1 | 15N | 107.9±0:9 | 103.6±0:9 | 4.3 |
| 2 | 15N | 101.6±1:3 | 96.6±0:8 | 5.0 | |
| experimental | 15N | 114.0±1:3 | 106.7±0:7 | 7.3 |
Figure 4.
Comparison of reduced 13C anisotropy (left) and asymmetry (right) for GB1, based on the 1PGA structure and computational model 1. Circles and squares denote regions of helical or sheet secondary structure, respectively. Experimental data is from (Wylie et al, 2007).
Figure 5.
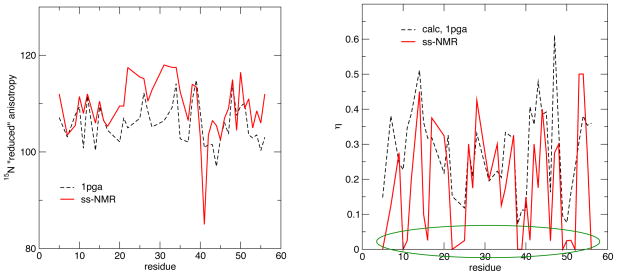
15N anisotropies (left) and asymmetries (right) for GB1. See the caption to Fig. 4.
For the 15N nuclei, the calculated CSAs are systematically lower than that of the experimental observables (Table 2). This systematic difference amounts to about 11 ppm for the OLYP functional and about 5 ppm for B3LYP. The helix and sheet dependence of Δδred mirrors that seen for 13C′, with the helical regions being larger in absolute magnitude than the sheets. As is shown in Fig. 5, however, the trend is rather clearer in the experimental data than in the calculations. The extent of variation in Δδred is about 12 ppm in both the calculated and observed results, with the exception of one unusual value at residue 41, whose experimental estimate is far outside the range of all other values. This is a glycine residue in a loop region, which also shows unusual values for 15N–1H and 13C–1H dipolar couplings (Franks et al, 2005; Wylie et al, 2007), which may reflect unusual dynamics that would not show up in the current static calculations. As with the 13C′ results, a wide range of asymmetries η are seen, with much of the variation being reproduced in the calculations. There were a number of residues for which the 15N asymmetry parameter extracted from the data was very small, and these points are circled in green in the right side of Fig. 5. The calculations often show relatively small values for these asymmetries, but all of the calculated values are above 0.1, whereas there are more than a dozen experimental estimates below this.
One good aspect of the AF-QM/MM model used here is that it, at least in principle, includes many contributions to the shielding tensor, including local geometries, hydrogen bonding, side chain identity and conformation, and solvation effects. At the same time, this can lead to difficulties in identifying individual contributions to the results. Fig. 6 shows one attempt to isolate hydrogen bonding effects from other contributions. The calculations shown there employ the “method 1” quantum model, but with a quantum region that just includes an N-methylacetamide (NMA) molecule at the position of the residue in question, and zero, one or two additional NMA molecules at the position of peptide groups that are hydrogen bonded to either the NH or C=O moiety of the central peptide; no point charges arising from the rest of the protein, or from the solvent response, are included. The calculations thus primarily illustrate the effects of backbone hydrogen bonding on the shift anisotropies.
Figure 6.
Effects of hydrogen bonds on Δδred values for 13C′ (left) and 15N (right). Results are from a simplified (NMA)3 model described in the text.
The results are color-coded according to the nature of the hydrogen bonding pattern, and show some clear trends. Peptide groups with two hydrogen bonds to other peptide groups (black circles) generally have anisotropies that are higher in absolute magnitude than other peptide groups, for both 13C′ and 15N tensors. Among peptide groups with one backbone H-bond partner (these are primarily in sheet regions) the 13C′ anisotropy is clearly more negative (higher in absolute magnitude) for H-bonds to the NH side of the central peptide than for groups where the single H-bond is to the C=O side; this trend is somewhat reversed (although less clear) for the 15N tensors, where hydrogen bonding to C=O side tends to increase the absolute magnitude of the anisotropy. The main trends seen in Fig. 6, with large alternating asymmetries in the sheet regions and a helical central region (residues 22–37) that is systematically higher in absolute magnitude, are visible in the experimental and calculated profiles in Fig. 4 and 5, suggesting that a significant component of the differences seen between helical and sheet reasons arises from number of hydrogen bonds; this does not rule out other systematic effects (such as from dihedral angles), and further computational studies are ongoing to explore these issues.
3.2 15N tensors in GB3
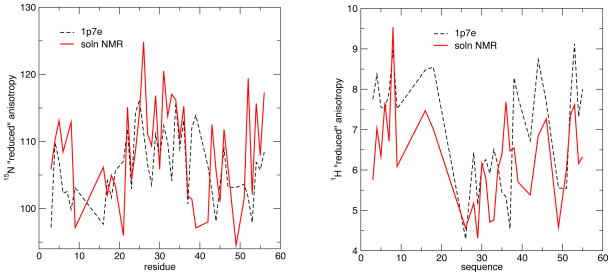
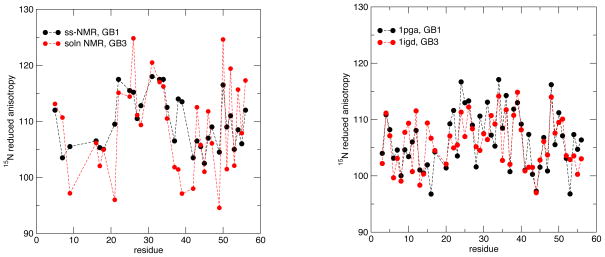
Liquid-state estimates of the 15N shielding tensor for GB3 have been made by two groups (Hall and Fushman, 2006; Yao et al, 2010a). We used three PDB structures (PDB codes: 1IGD, 1P7E and 2OED) to calculate the chemical shift tensors of GB3 protein; results are shown in Table 3 and Fig. 7. The calculated CSA values are systematically smaller in absolute magnitude than the experimental values by about 5 ppm for method 1 and 12 ppm for method 2. The difference between the averages of 15N CSA for the α-helical versus the β-sheet region is between 6 and 7 ppm, depending on the PDB structure and method used, in good agreement with the experimental estimate. Given the close similarity of GB1 and GB3, it is of interest to compare results for the two proteins, as shown in Fig. 8. The range of values from the solid state measurements is 16 ppm (from 102 ppm to 118 ppm, leaving out residue 41, for reasons discussed above), whereas the range in the solution estimates is 30 ppm (from 95 ppm to 125 ppm). For the calculations, the range is 20 ppm for GB1 and 18 ppm for GB3. Hence the computed variability in anisotropies is is nearly the same in the calculations (for either protein) as in the solid-state measurements, and rather lower than that extracted from solution data. [Recall that the Δσ parameter commonly used for relaxation analysis in solution is 50% larger and opposite in sign to the Δδred values used here, so that the calculated range of Δσ would be 27–30 ppm.] One possible explanation (consistent with our DFT results) is that the very low and very high anisotropies seen in the left-hand side of Fig. 8 may be reflecting some other property of those peptide groups in addition to variations in shielding anisotropies. Similar problems may have affected earlier solution estimates for GB3 (Hall and Fushman, 2006), which suggested a range of Δδred values of 86 ppm (from 74 ppm to 160 ppm) that is much larger than the values shown in Fig. 8.
Table 3.
Reduced 15N CSA for α-helical and β-sheet regions of GB3. Experimental values are from Yao et al. (2010).
| PDB | method | Helix | Sheet | Difference |
|---|---|---|---|---|
| 1igd | 1 | 109.42±1.33 | 102.93±0.77 | 6.50 |
| 2 | 102.94±1.22 | 96.32±0.74 | 6.63 | |
| 1p7e | 1 | 109.21±1.26 | 102.86±0.72 | 6. 36 |
| 2 | 102.53±1.18 | 96.23±0.72 | 6.30 | |
| 2oed | 1 | 111.54±1.23 | 105.34±0.71 | 6.19 |
| 2 | 102.56±1.17 | 95.74±0.74 | 6.82 | |
| exp | 114.88±1.30 | 108.26±0.89 | 6.62 |
Figure 7.
Reduced anisotropies for GB3 for 15N (left) and 1H (right). Calculations used method 1 and the 1p7e structure; experimental data is from Yao et al. (2010, 2010a).
Figure 8.
Comparison of reduced 15N anisotropies for GB1 and GB3. Left: experimental data from Wylie et al (2007) and Yao et al (2010a); right: calculated values (method 1) using the 1igd and 1pga structures from the PDB.
3.3 1H tensors in GB3
Yao and co-workers also measured the 1H chemical shift anisotropy with cross-correlation relaxation experiments in liquid crystalline state (Yao et al, 2010b). Two models were used to produce fitted CSA values: The three-parameter model uses three cross-correlated relaxation parameters to determine the CSAs, while assuming tensor symmetry relative to the peptide plane. In contrast, the five parameter model takes advantage of the precise RCSA measurements and does not require the assumption of symmetry, but has more fitting parameters. Results are shown in the right-hand side of Fig. 7 and in Table 3. (For both experimental and calculated tensors, a few tensors with large asymmetries have “flipped” signs for Δδred; we have treated all values as positive for this analysis.) As expected, anisotropies are much smaller for protons than for heavier nuclei. The average and range of the calculated values is nearly the same as that extracted from experiment, but details of the pattern of variation are not captured. On average, the 1H CSA of the α-helical region is lower in absolute magnitude than that of the β-sheet region, by about 1.2 ppm. The difference in the AF-QM/MM results is slightly larger, from 1.3 to 2.0 ppm, but in the same direction.
3.4 13C′ and 15N tensors in ubiquitin
The Bodenhausen group has reported extensive liquid state relaxation measurements for human ubiquitin, extracting site-specific tensors for backbone 13C and15N nuclei (Loth et al, 2003, 2005). Results are collected in Table 5 and Fig. 9. Several assumptions and approximations must be made to extract tensors from the experimental data, and Models 1 to 5 are presented by Loth et al. (2005); the end results do not differ by a lot, with Model 5 being closest to both calculated results and the average anisotropies extracted from solid state measurements on GB1 (Wylie et al, 2007). As shown in Table 5, helical regions show reduced anisotropies that are larger in absolute magnitude than those for sheets, in agreement with calculated results and with the trends seen for GB1 and GB3. The helix–sheet differences are smaller here than for GB1 for both the experimental and calculated data sets.
Table 5.
Estimates of Δδred for ubiquitin. Details and assumptions of Model1 to Model5 are given in (Loth et al, 2005). Calculations used the 1ubq crystal structure.
| Method | Src | Helix | Sheet | Difference | Src | Helix | Sheet | Difference |
|---|---|---|---|---|---|---|---|---|
| Model1 | 13C | −95.63 | −91.86 | −3.77 | 15N | 113.57 | 109.85 | 3.72 |
| Model2 | 13C | −94.17 | −90.48 | −3.69 | 15N | 107.48 | 103.86 | 3.62 |
| Model3 | 13C | −98.41 | −95.17 | −3.24 | 15N | 102.19 | 97.30 | 4.89 |
| Model4 | 13C | −85.10 | −81.67 | −3.43 | 15N | 100.66 | 96.18 | 4.48 |
| Model5 | 13C | −85.19 | −81.69 | −3.50 | 15N | 109.98 | 105.19 | 4.79 |
| method1 | 13C | −87.60 | −85.20 | −2.40 | 15N | 107.48 | 105.50 | 2.00 |
Figure 9.
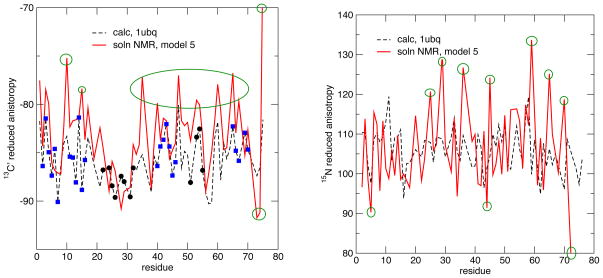
13C (left) and 15N (right) anisotropies for ubiquitin. Green circles mark experimental estimates that are well outside the range of calculated results.
Fig. 9 compares calculated and experimental anisotropies. The general trend is similar to that seen for GB3 above: the average anisotropy and many site-specific variations are common to experiment and calculation, but many of the experimental estimates (marked in green) are well outside the range of calculated results. For example, the range of experimental estimates for nitrogen anisotropies is 53 ppm (from 80 ppm to 133 ppm), whereas the range of computed results is only about half as great (25 ppm, from 94 ppm to 119 ppm). Similar comments apply to the carbonyl tensors.
4 Conclusions
The AF-QM/MM approach described here allows systematic explorations to be made of chemical shift tensors in biomolecules. At least in principle, it incorporates contributions from the entire protein and its solvent environment, and requires about 2–4 hours of computer time per residue, depending on the options chosen. Results for isotropic shifts will be discussed in a separate paper; in brief, results approach (but do not match) the quality of current empirical predictions, e.g. from sparta+ (Shen and Bax, 2010) or shiftx+ (Han et al, 2011). Here we examine predictions for shift tensor anisotropies and asymmetries, for which there is only a few previous studies on full proteins.
The overall results shown here offer encouraging evidence that the basic features of site-to-site variation in backbone tensors are reasonably well understood, and are reproduced in the calculations. The predicted range and variation of anisotropies, and systematic differences between helix and sheet regions of regular secondary structure, are in good agreement with values extracted from solid-state NMR measurements. The somewhat more indirect determination of shielding tensors from existing liquid state studies yields similar trends, but with a magnitude of variation that is larger than that seen in the solid-state results or in calculations. To be sure, the calculations reported here are based on crystal structures, and do not attempt to include effects of motional averaging; such effects are expected to be rather small for the fairly rigid proteins considered here (Tang and Case, 2007), but further study of this point is certainly warranted. A fair part of the variation in backbone anisotropies appears to arise from variations in hydrogen bonding patterns, (see Fig. 6), but an understanding of the effects of torsion angles and other geometric variables also warrants further study. The methods described here could be an important complement to experiment as the field moves forward.
Table 4.
Helix-sheet difference of 1H values for Δδred for GB3.
| PDB | Method | Helix | Sheet | Difference |
|---|---|---|---|---|
| 1IGD | 1 | 5.60±0.77 | 7.14±1.29 | −1.54 |
| 2 | 5.70±0.74 | 7.03±1.49 | −1.33 | |
| 1P7E | 1 | 5.52±0.72 | 7.40±1.23 | −1.88 |
| 2 | 5.63±0.73 | 7.33±1.40 | −1.70 | |
| 2OED | 1 | 5.37±0.71 | 7.36±1.46 | −1.99 |
| 2 | 5.58±0.74 | 7.46±1.51 | −1.88 | |
| exp, parm3 | N/A | 5.38±0.96 | 6.51±0.96 | −1.13 |
| exp parm5 | N/A | 5.59±0.92 | 6.79±0.93 | −1.20 |
Acknowledgments
This work was supported by NIH grant GM48815. We thank Chad Rienstra and Ben Wylie for helpful discussions, and Kenneth Merz and Xiao He for help with their fragmentation script.
References
- Becke AD. A new mixing of Hartree-Fock and local density-functional theories. J Chem Phys. 1993;98:1372–1377. [Google Scholar]
- Bim J, Poon A, Mao Y, Ramamoorthy A. Ab initio study of C-13 alpha chemical shift anisotropy tensors in peptides. J Am Chem Soc. 2004;126:8529–8534. doi: 10.1021/ja049879z. [DOI] [PMC free article] [PubMed] [Google Scholar]
- Brender JR, Taylor DM, Ramamoorthy A. Orientation of amide-nitrogen-15 chemical shift tensors in peptides: A quantum chemical study. J Am Chem Soc. 2001;123:914–922. doi: 10.1021/ja001980q. [DOI] [PubMed] [Google Scholar]
- Burton RA, Tjandra N. Residue-Specific 13C CSA Tensor Principal Components for Ubiqui-tin:Correlation between Tensor Components and Hydrogen Bonding. J Am Chem Soc. 2007;129:1321–1326. doi: 10.1021/ja066835c. [DOI] [PubMed] [Google Scholar]
- Cai L, Fushman D, Kosov D. Density functional calculations of chemical shielding of backbone N-15 in helical residues of protein G. J Biomol NMR. 2009;45:245–253. doi: 10.1007/s10858-009-9358-3. [DOI] [PMC free article] [PubMed] [Google Scholar]
- Cai L, Kosov D, Fushman D. Density functional calculations of backbone 15N shielding tensors in beta-sheet and turn residues of protein G. J Biomol NMR. 2011;50:19–33. doi: 10.1007/s10858-011-9474-8. [DOI] [PMC free article] [PubMed] [Google Scholar]
- Casabianca LB, De Dios AC. Ab initio calculations of NMR chemical shifts. J Chem Phys. 2008:128. doi: 10.1063/1.2816784. [DOI] [PubMed] [Google Scholar]
- Case DA. Interpretation of chemical shifts and coupling constants in macromolecules. Curr Opin Struct Biol. 2000;10:197–203. doi: 10.1016/s0959-440x(00)00068-3. [DOI] [PubMed] [Google Scholar]
- Cisnetti F, Loth K, Pelupessy P, Bodenhausen G. Determination of chemical shift anisotropy tensors of carbonyl nuclei in proteins through cross-correlated relaxation in NMR. ChemPhysChem. 2004;5:807–814. doi: 10.1002/cphc.200301041. [DOI] [PubMed] [Google Scholar]
- Cornell WD, Cieplak P, Bayly CI, Gould IR, Merz KM, Ferguson DM, Spellmeyer DC, Fox T, Caldwell JW, Kollman PA. A second generation force field for the simulation of proteins, nucleic acids, and organic molecules. J Am Chem Soc. 1996;118:2309–2309. [Google Scholar]
- Czinki E, Csaszar AG, Magyarfalvi G, Schreiner PR, Allen WD. Secondary structures of peptides and proteins via NMR chemical-shielding anisotropy (CSA) parameters. J Am Chem Soc. 2007;129:1568–1577. doi: 10.1021/ja065461k. [DOI] [PubMed] [Google Scholar]
- Ditchfield R. Self-Consistent Perturbation-Theory of Diamagnetism.1. Gauge-Invariant LCAO Method for NMR Chemical-Shifts. Mol Phys. 1974;27:789–807. [Google Scholar]
- Franks W, Zhou D, Wylie B, Money B, Graesser D, Frericks H, Sahota G, Rienstra C. Magic-Angle Spinning Solid-State NMR Spectroscopy of the beta-1 Immunoglobulin Binding Domain of Protein G (GB1): 15N and 13C Chemical Shift Assignments and Conformational Analysis. J Am Chem Soc. 2005;125:12,291–12,305. doi: 10.1021/ja044497e. [DOI] [PubMed] [Google Scholar]
- Frisch MJ, Trucks GW, Schlegel HB, Scuseria GE, Robb MA, Cheeseman JR, Montgomery JA, Jr, Vreven T, Kudin KN, Burant JC, Millam JM, Iyengar SS, Tomasi J, Barone V, Mennucci B, Cossi M, Scalmani G, Rega N, Petersson GA, Nakatsuji H, Hada M, Ehara M, Toyota K, Fukuda R, Hasegawa J, Ishida M, Nakajima T, Honda Y, Kitao O, Nakai H, Klene M, Li X, Knox JE, Hratchian HP, Cross JB, Bakken V, Adamo C, Jaramillo J, Gomperts R, Stratmann RE, Yazyev O, Austin AJ, Cammi R, Pomelli C, Ochter-ski JW, Ayala PY, Morokuma K, Voth GA, Salvador P, Dannenberg JJ, Zakrzewski VG, Dapprich S, Daniels AD, Strain MC, Farkas O, Malick DK, Rabuck AD, Raghavachari K, Foresman JB, Ortiz JV, Cui Q, Baboul AG, Clifford S, Cioslowski J, Stefanov BB, Liu G, Liashenko A, Piskorz P, Komaromi I, Martin RL, Fox DJ, Keith T, Al-Laham MA, Peng CY, Nanayakkara A, Challacombe M, Gill PMW, Johnson B, Chen W, Wong MW, Gonzalez C, Pople JA. Gaussian 03, Revision B.05. Gaussian, Inc; Wallingford, CT: 2004. [Google Scholar]
- Fushman D, Tjandra N, Cowburn D. Direct measurement of N-15 chemical shift anisotropy in solution. J Am Chem Soc. 1998;120:10,947–10,952. [Google Scholar]
- Gu ZT, McDermott A. Chemical shielding anisotropy of protonated and deprotonated carboxylates in amino-acids. J Am Chem Soc. 1993;115:4282–4285. [Google Scholar]
- Haeberlen U. Adv Magn Reson. Academic Press; New York: 1976. High resolution NMR in solids: selective averaging. [Google Scholar]
- Hall JB, Fushman D. Variability of the N-15 chemical shielding tensors in the B3 domain of protein G from N-15 relaxation measurements at several fields. Implications for backbone order parameters. J Am Chem Soc. 2006;128:7855–7870. doi: 10.1021/ja060406x. [DOI] [PMC free article] [PubMed] [Google Scholar]
- Han B, Liu Y, Ginzinger S, Wishart D. SHIFTX2: significantly improved protein chemical shift prediction. J Biomol NMR. 2011;50:43–57. doi: 10.1007/s10858-011-9478-4. [DOI] [PMC free article] [PubMed] [Google Scholar]
- Hartzell CJ, Whitfield M, Oas TG, Drobny GP. Determination of the n-15 and c-13 chemical-shift ten-sors of l- c-13 alanyl-l- n-15 alanine from the dipole-coupled powder patterns. J Am Chem Soc. 1987;109:5966–5969. [Google Scholar]
- Havlin RH, Laws DD, Bitter HML, Sanders LK, Sun HH, Grimley JS, Wemmer DE, Pines A, Oldfield E. An experimental and theoretical investigation of the chemical shielding tensors of c-13(alpha) of alanine, valine, and leucine residues in solid peptides and in proteins in solution. J Am Chem Soc. 2001;123:10,362–10,369. doi: 10.1021/ja0115060. [DOI] [PubMed] [Google Scholar]
- Hawkins GD, Cramer CJ, Truhlar DG. Pairwise solute descreening of solute charges from a dielectric medium. Chem Phys Lett. 1995;246:122–129. [Google Scholar]
- He X, Wang B, Merz KM. Protein NMR Chemical Shift Calculations Based on the Automated Fragmentation QM/MM Approach. J Phys Chem B. 2009;113:10,380–10,388. doi: 10.1021/jp901992p. [DOI] [PubMed] [Google Scholar]
- Heller J, Laws DD, Tomaselli M, King DS, Wemmer DE, Pines A, Havlin RH, Oldfield E. Determination of dihedral angles in peptides through experimental and theoretical studies of alpha-carbon chemical shielding tensors. J Am Chem Soc. 1997;119:7827–7831. [Google Scholar]
- Koster A, Calaminici P, Casida M, Flores-Moreno R, Geudtner G, Goursot A, Heine T, Ipatov A, Janetzko F, del Campo J, Patchkovskii S, Reveles J, Salahub D, Vela A. deMon2k 2006 [Google Scholar]
- Kroenke CD, Rance M, Palmer AG. Variability of the N-15 chemical shift anisotropy in Escherichia coli ribonuclease H in solution. J Am Chem Soc. 1999;121:10,119–10,125. [Google Scholar]
- Lipsitz RS, Tjandra N. N-15 chemical shift anisotropy in protein structure refinement and comparison with NH residual dipolar couplings. J Magn Reson. 2003;164:171–176. doi: 10.1016/s1090-7807(03)00176-9. [DOI] [PubMed] [Google Scholar]
- Loth K, Pelupessy P, Bodenhausen G. Cross-correlation between a carbonyl C′ chemical shift anisotropy and a long-range dipolar C′/HA coupling in proteins using symmetrical reconversion. J Biomol NMR. 2003;27:159–163. doi: 10.1023/a:1024979511837. [DOI] [PubMed] [Google Scholar]
- Loth K, Pelupessy P, Bodenhausen G. Chemical shift anisotropy tensors of carbonyl, nitrogen, and amide proton nuclei in proteins through cross-correlated relaxation in NMR spectroscopy. J Am Chem Soc. 2005;127:6062–6068. doi: 10.1021/ja042863o. [DOI] [PubMed] [Google Scholar]
- Macke T, Case D. Modeling Unusual Nucleic Acid Structures. In: Leontis N, SantaLucia J, editors. Molecular Modeling of Nucleic Acids. American Chemical Society; Washington, DC: 1998. pp. 379–393. [Google Scholar]
- Moon S, Case DA. A comparison of quantum chemical models for calculating NMR shielding parameters in peptides: Mixed basis set and ONIOM methods combined with a complete basis set extrapolation. J Comput Chem. 2006;27:825–836. doi: 10.1002/jcc.20388. [DOI] [PubMed] [Google Scholar]
- Oldfield E. Chemical shifts and 3-dimensional protein structures. J Biomol NMR. 1995;5:217–225. doi: 10.1007/BF00211749. [DOI] [PubMed] [Google Scholar]
- Pang YX, Zuiderweg ERP. Determination of protein backbone (CO)-C-13 chemical shift anisotropy tensors in solution. J Am Chem Soc. 2000;122:4841–4842. [Google Scholar]
- Poon A, Birn J, Ramamoorthy A. How does an amide-N-15 chemical shift tensor vary in peptides? J Phys Chem B. 2004;108:16,577–16,585. doi: 10.1021/jp0471913. [DOI] [PMC free article] [PubMed] [Google Scholar]
- Scheurer C, Skrynnikov NR, Lienin SF, Straus SK, Bruschweiler R, Ernst RR. Effects of dynamics and environment on N-15 chemical shielding anisotropy in proteins. A combination of density functional theory, molecular dynamics simulation, and NMR relaxation. J Am Chem Soc. 1999;121:4242–4251. [Google Scholar]
- Shen Y, Bax A. SPARTA plus: a modest improvement in empirical NMR chemical shift prediction by means of an artificial neural network. J Biomol NMR. 2010;48:13–22. doi: 10.1007/s10858-010-9433-9. [DOI] [PMC free article] [PubMed] [Google Scholar]
- Shen Y, Lange O, Delaglio F, Rossi P, Aramini J, Liu G, Eletsky A, Wu Y, Singarapu K, Lemak A, Ig-natchenko A, Arrowsmith C, Szyperski T, Montelione G, Baker D, Bax A. Consistent blind protein structure generation from NMR chemical shift data. Proc Natl Acad Sci USA. 2008;105:4685–4690. doi: 10.1073/pnas.0800256105. [DOI] [PMC free article] [PubMed] [Google Scholar]
- Sitkoff D, Case DA. Theories of chemical shift anisotropies in proteins and nucleic acids. Prog NMR Spectr. 1998;32:165–190. [Google Scholar]
- Tang S, Case DA. Vibrational averaging of chemical shift anisotropies in model peptides. J Biomol NMR. 2007;38:255–266. doi: 10.1007/s10858-007-9164-8. [DOI] [PubMed] [Google Scholar]
- Tjandra N, Bax A. Large variations in C-13(alpha) chemical shift anisotropy in proteins correlate with secondary structure. J Am Chem Soc. 1997;119:9576–9577. [Google Scholar]
- Tozer D, Handy N. The development of new exchange-correlation functionals. J Chem Phys. 1998;108:2545–2555. [Google Scholar]
- Wei YF, de Dios AC, McDermott AE. Solid-state N-15 NMR chemical shift anisotropy of histidines: Experimental and theoretical studies of hydrogen bonding. J Am Chem Soc. 1999;121:10,389–10,394. [Google Scholar]
- Wei YF, Lee DK, Ramamoorthy A. Solid-state C-13 NMR chemical shift anisotropy tensors of polypeptides. J Am Chem Soc. 2001;123:6118–6126. doi: 10.1021/ja010145l. [DOI] [PubMed] [Google Scholar]
- Wilson P, Amos R, Handy N. Toward coupled-cluster accuracy in the prediction of nuclear shielding constants: a simple and efficient DFT approach. Chem Phys Lett. 1999;312:475–484. [Google Scholar]
- Wishart D, Case D. Use of chemical shifts in macromolecular structure determination. Meth Enzymol. 2001;338:3–34. doi: 10.1016/s0076-6879(02)38214-4. [DOI] [PubMed] [Google Scholar]
- Wu CH, Ramamoorthy A, Gierasch LM, Opella SJ. Simultaneous characterization of the amide H-1 chemical shift, H-1-N-15 dipolar, and N-15 chemical-shift interaction tensors in a peptide-bond by 3-dimensional solid-state nmr-spectroscopy. J Am Chem Soc. 1995;117:6148–6149. [Google Scholar]
- Wylie BJ, Sperling LJ, Frericks HL, Shah GJ, Franks WT, Rienstra CM. Chemical-shift anisotropy measurements of amide and carbonyl resonances in a microcrystalline protein with slow magic-angle spinning NMR spectroscopy. J Am Chem Soc. 2007;129:5318–5319. doi: 10.1021/ja0701199. [DOI] [PubMed] [Google Scholar]
- Yao LS, Grishaev A, Cornilescu G, Bax A. Site-Specific Backbone Amide N-15 Chemical Shift Anisotropy Tensors in a Small Protein from Liquid Crystal and Cross-Correlated Relaxation Measurements. J Am Chem Soc. 2010a;132:4295–4309. doi: 10.1021/ja910186u. [DOI] [PMC free article] [PubMed] [Google Scholar]
- Yao LS, Grishaev A, Cornilescu G, Bax A. The Impact of Hydrogen Bonding on Amide H-1 Chemical Shift Anisotropy Studied by Cross-Correlated Relaxation and Liquid Crystal NMR Spectroscopy. J Am Chem Soc. 2010b;132:10,866–10,875. doi: 10.1021/ja103629e. [DOI] [PMC free article] [PubMed] [Google Scholar]
- Yao XL, Yamaguchi S, Hong M. C alpha chemical shift tensors in helical peptides by dipolar-modulated chemical shift recoupling nmr. J Biomol NMR. 2002;24:51–62. doi: 10.1023/a:1020626802472. [DOI] [PubMed] [Google Scholar]


