Abstract
Phosphatidylinositol (PI) 3-kinase/Akt signaling plays a critical role in cell proliferation and survival, partly by regulation of FoxO transcription factors. Previous work using global expression profiling indicated that inhibition of PI 3-kinase in proliferating cells led to induction of genes that promote cell cycle arrest and apoptosis. The upstream regulatory regions of these genes had binding sites not only for FoxO, but also for Myc/Max transcription factors. In the present study, we have addressed the role of Myc family members and related E-box-binding proteins in the regulation of these genes. Chromatin immunoprecipitations and RNA interference indicated that transcription was repressed by Max-Mnt-Sin3a-histone deacetylase complexes in proliferating cells. Inhibition of PI 3-kinase led to a loss of Max/Mnt binding and transcriptional induction by MITF and USF1, as well as FoxO. Both MITF and USF1 were activated by glycogen synthase kinase (GSK) 3, with GSK3 phosphorylation sites on USF1 identified as the previously described activating site threonine 153 as well as serine 186. siRNA against MITF as well as against FoxO3a protected cells from apoptosis following PI 3-kinase inhibition. These results define a novel E-box-regulated network that functions coordinately with FoxO to regulate transcription of apoptotic and cell cycle regulatory genes downstream of PI 3-kinase/Akt/GSK3 signaling.
Keywords: Akt PKB, Cell Cycle, Cell Death, Glycogen Synthase Kinase 3, Myc, Signal Transduction, Transcription Factors, MITF, USF
Introduction
The growth factor-stimulated phosphatidylinositol (PI)4 3-kinase/Akt signaling pathway is a key regulator of growth and survival in mammalian cells (1–3). Akt and its downstream kinase glycogen synthase kinase (GSK) 3 act in part through the phosphorylation of direct regulators of apoptosis and cell cycle progression, such as Mcl1, Bad, p21Cip, and cyclin D1. Additionally, transcriptional regulation plays an important role in the control of cell behavior by PI 3-kinase signaling, with both Akt and GSK3 phosphorylating a variety of transcription factors (1, 2, 4). Among the transcriptional regulators targeted by PI 3-kinase/Akt signaling, the FoxO subfamily of Forkhead transcription factors plays a central role. When the PI 3-kinase pathway is active, phosphorylation by Akt sequesters FoxO to the cytoplasm, thereby preventing it from activating its target genes (5–6). In the absence of PI 3-kinase/Akt signaling, activation of FoxO leads to induction of target genes that encode proteins that inhibit cell cycle progression, such as p27, p130, and cyclin G2 as well as proapoptotic proteins, such as Bim, Fas ligand, and BCL6 (7, 8).
To comprehensively understand the program of gene expression controlled by PI 3-kinase signaling, we characterized global gene expression changes that resulted from inhibition of PI 3-kinase in proliferating cells in the presence of serum growth factors (9). Concomitant with the onset of apoptosis, inhibition of PI 3-kinase resulted in the induction of a set of genes that encoded proteins known to mediate apoptosis and cell cycle arrest. Computational analysis and chromatin immunoprecipitations indicated that a large portion of the genes that were induced as a result of PI 3-kinase inhibition had FoxO-binding sites in their upstream regulatory regions. Thus, consistent with previous studies, the activation of FoxO resulting from inhibition of PI 3-kinase was responsible for the induction of a set of genes encoding proteins that promote apoptosis (Atrogin-1/FBXO32), inhibit cell cycle progression (cyclin G2), or both (TXNIP, KLF10, GADD45B, DDIT3/CHOP, KLF6, and BCL6).
In addition to FoxO-binding sites, however, binding sites for the Myc/Max transcription factors were also over-represented in ∼25% of the upstream regions of the set of genes induced by PI 3-kinase inhibition. This was seemingly paradoxical, because c-Myc is a well characterized transcriptional activator that would be inhibited rather than activated by inhibition of PI 3-kinase. Upon PI 3-kinase inhibition, c-Myc is phosphorylated by GSK3, which targets c-Myc for ubiquitination and proteolytic degradation (10, 11). Inhibition of PI 3-kinase would thus be expected to result in repression rather than induction of c-Myc target genes.
However, c-Myc is a member of a large superfamily of transcriptional regulatory proteins that share a basic DNA-binding domain that recognizes E-box sequences (CANNTG) as well as helix-loop-helix and leucine zipper domains that mediate homo- and/or heterodimer formation (12). Closely related Myc family members include transcriptional repressors, Mnt, and the 4 Mxd proteins (Mxd 1–4) (13). Additional members of the Myc superfamily that bind to canonical E-box sequences include transcriptional activators MITF, USF1, and USF2 (14, 15). In the present study, we have therefore investigated the potential roles of these E-box binding transcription factors in the regulation of genes that are induced in response to PI 3-kinase inhibition.
Consistent with the established positive regulation of c-Myc by PI 3-kinase, c-Myc was not bound to the E-box sequences of these genes either in proliferating cells or after PI 3-kinase inhibition. Instead, the E-box sequences of these genes were targeted by Max/Mnt repressors and MITF and USF1 activators, which functioned to repress transcription in proliferating cells and to activate transcription following inhibition of PI 3-kinase, respectively. As previously reported, MITF was activated by GSK3 following inhibition of PI 3-kinase (16–18). We further found that USF1 was phosphorylated and activated by GSK3, consistent with its previously described activation by p38 MAP kinase in response to cell stress (19) and the role as an inhibitor of cell proliferation (20–25).
These E-box-binding proteins functioned together with FoxO proteins, such that up-regulation of target genes following inhibition of PI 3-kinase involved FoxO recruitment together with the loss of Max/Mnt repression and activation of MITF and USF1. These results define a novel E-box regulatory network that functions together with FoxO transcription factors to regulate transcription of cell cycle arrest and proapoptotic genes in response to PI 3-kinase/Akt/GSK3 signaling.
EXPERIMENTAL PROCEDURES
Cell Culture, Inhibitor Treatments, and Infections
T98G human glioblastoma cells were grown as previously described (9). Rat-1 fibroblasts were grown in Dulbecco's modified Eagle's medium (DMEM) supplemented with 10% calf serum. For inhibitor treatments, cells were plated at 2 × 10⁶ cells/150-mm plate or 8 × 10⁵ cells/100-mm plate and cultured for 48 h. LY294002 (Biomol) was added to a final concentration of 50 μm; wortmannin (Biomol) to 1 μm; SB-216763 (Biomol) to 5 μm; PI-103 (EMD) to 5 μm; and trichostatin A (Cell Signaling) to 0.4 μm.
Plasmids
pCMV-SPORT6-MITF was obtained from American Type Culture Collection (MGC-34505), pGL3-Atrogin1–0.4kb from Dr. Alfred Goldberg (Harvard Medical School) (26), and pCX-USF1 from Dr. Robert Roeder (Rockefeller University) (27).
Site-directed PCR Mutagenesis
Plasmids were mutated with the QuikChange Lightning Multi Site-directed Mutagenesis Kit (Agilent Technologies, 210515) as recommended by the manufacturer. Mutagenic primer sequences are available upon request.
RNA Extractions and Real-time RT-PCR
RNA extraction and real-time RT-PCR were previously described (9). Primer sequences are available upon request.
Immunoblots
Proteins were separated by SDS-polyacrylamide gel electrophoresis and membranes were immunoblotted as recommended by the manufacturer with anti-Max (Santa Cruz, sc-199), anti-Mnt (Santa Cruz, sc-769), anti-c-Myc (Cell Signaling, 5605), anti-acetyl-histone H2A (Cell Signaling, 2576S), anti-MITF (Abcam, abl2039), anti-USF1 (Santa Cruz, sc-229), anti-GSK3β (BD Biosciences, g22320), anti-FoxO3a (Millipore, 07-1719), anti-phospho-GSK3β S9 (Cell Signaling Technology, 9336), and anti-β-actin (Sigma). Densitometry was performed using ImageJ software (NIH).
Phosphatase Treatment
Transfected cells were lysed in Nonidet P-40 lysis buffer. 40 μg of whole cell extract was mixed with 1× NEB buffer for Protein MetalloPhosphatases (New England BioLabs), 1 mm MnCl2, and 800 units of λ protein phosphatase (New England BioLabs). Samples were incubated for 1 h at 30 °C and analyzed by Western blotting.
Chromatin Immunoprecipitations
Chromatin immunoprecipitations (ChIPs) were performed as previously described (9), using 5 μg of the following antibodies from Santa Cruz Biotechnology: anti-Myc (sc-764), anti-Max (sc-199), anti-Mnt (sc-769), anti-Mad1 (sc-222), anti-Mxi1 (sc-1042), anti-Mad3 (sc-933), anti-Mad4 (sc-771), anti-Sin3a (sc-994), anti-Sin3b (sc-768), anti-MITF (sc-25386), anti-USF1 (sc-229), anti-USF2 (sc-861), anti-MGA (sc-81105), anti-FoxO1 (sc-11350), or anti-FoxO3a (sc-11351). Predicted FoxO- and Myc/Max-binding sites were previously described (9). Primer sequences are available upon request.
RNA Interference
siRNA transfections were performed as described (28), using predesigned siRNAs against Myc (Ambion, S9130), Max (Ambion, S224030), Mnt (Ambion, s8904), MITF (Ambion, S8791), USF1 (Ambion, S14717), FoxO3a (Ambion, S5260), GSK3β (Ambion, S6241), ATROGIN-1 (Ambion, s41718), CCNG2 (Ambion, s2533), TXNIP (Ambion, s20880), or a nonspecific negative control (Ambion, 4390843). Cells were transfected with 5–20 nm siRNAs, optimized for the individual target. Nonspecific negative control was at an identical concentration to the gene-specific siRNA being used. Cells were incubated with the transfection mixture for either 48 or 72 h.
Transient Transfection Assays
Transfections were done as previously described (9). Transfection mixtures for dual luciferase assays included 700 ng of pCMV-SPORT6-MITF, 700 ng of pcDNA3-GSK3β S9A, 200 ng of pGL3-ATROGIN1–0.4kb, and 100 ng of TK-Renilla plasmids. Transfection mixtures for luciferase plus β-gal assays included 300–700 ng of pCX-USF1, 300–700 ng of pcDNA3-GSK3β S9A, 200 ng of pGL3-ATROGIN1–0.4kb, and 500 ng of pGK-βGal plasmids. Plasmids that were excluded from the transfections were replaced with equal amounts of pcDNA3. Cells were incubated with the transfection mixture for 24–48 h. Luciferase was measured with a Dual Luciferase Reporter Assay Kit (Promega, E1910). β-Galactosidase activity was measured by mixing 20 μl of the lysed cellular extract with 1.5 μl of 100× Mg buffer (0.1 m MgCl2, 35 mm β-mercaptoethanol), 117 μl, 0.1 m sodium phosphate buffer, pH 7.5 (82 mm Na2HPO4, 18 mm NaH2PO4), and 16.5 μl of 8 mg/ml of 2-nitrophenyl-d-galactopyranoside. β-Galactosidase samples were then incubated for 2–3 h at 37 °C and measured by spectrophotometer at 420 nm.
In Vitro Kinase Assay and Mass Spectrometry Analysis
100 ng of full-length human recombinant His-tagged USF1 (Abcam, ab82069) was incubated with 100 ng of full-length human recombinant N-GST-tagged GSK3β (R&D Systems, 2506-KS) in reaction mixtures containing 400 μm ATP (10 μCi of [γ-32P]ATP) in 20 μl of 25 mm MOPS, pH 7.2, 12.5 mm β-glycerophosphate, 25 mm MgCl2, and 0.25 mm DTT at 30 °C. Proteins were separated on a 10% SDS-polyacrylamide gel and visualized using a phosphorimager. For mass spectrometry analysis, 75 ng of recombinant USF1 was incubated with 2.7 μg of recombinant GSK3β without radiolabeled [32P]ATP. Phosphorylated USF1 was then digested with trypsin and chymotrypsin and the peptide fragments were analyzed by the Taplin Mass Spectrometry facility (Harvard Medical School, Boston, MA) with a linear ion trap mass spectrometer.
Cell Viability Assay
siRNA transfections were performed as described above, but in 96-well plates containing 2,500 cells/well. All samples were transfected with siRNA for 48 h. PI 3-kinase was inhibited for 40 h with 50 μm LY294002. Cell viability was measured by adding 3-(4,5-dimethylthiazol-2-yl)-2,5-diphenyltetrazolium bromide (MTT) (Promega-G4000) for 2 h as per the manufacturer's specifications. The reduction of MTT into formazan by viable cells was measured with an absorbance microplate reader at 570 nm.
RESULTS
c-Myc Does Not Regulate Expression of Genes Induced in Response to PI 3-Kinase Inhibition
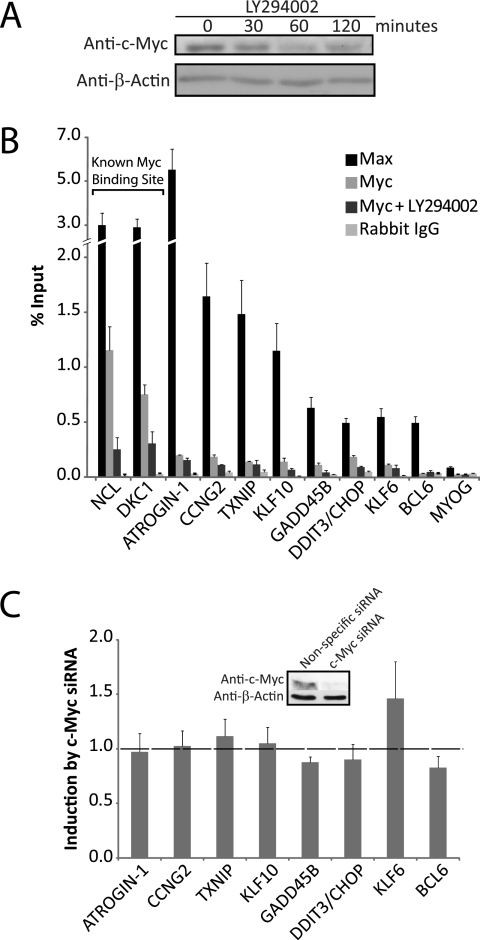
Computational analysis identified overrepresented E-box sequences as well as FoxO-binding sites in the upstream regulatory regions of 8 genes that were induced in proliferating T98G cells in response to 2–4 h of PI 3-kinase inhibition (9). To assess the possible role of c-Myc in regulation of these genes, we first tested the effect of inhibition of PI 3-kinase on c-Myc expression. Consistent with previous reports indicating that inhibition of PI 3-kinase targets c-Myc for proteasomal degradation as a result of phosphorylation by GSK3 (10, 11), intracellular levels of c-Myc decreased within 60 min of inhibition of PI 3-kinase (Fig. 1A). We then used ChIP assays to investigate the binding of c-Myc and its dimerization partner Max to the predicted E-box-binding sites upstream of the 8 genes induced by PI 3-kinase inhibition. As a control, c-Myc and Max binding were also examined within the regulatory regions of Ncl and DKC-1, which are two genes previously identified as being targeted by c-Myc in T98G cells (29). Max was bound at the predicted E-box sites of all 8 genes in proliferating cells, at levels comparable with its binding at the known Myc/Max sites upstream of Ncl and DKC-1 (Fig. 1B). Although c-Myc binding was readily detected upstream of Ncl and DKC-1 in proliferating T98G cells, only minimal binding of c-Myc was detected at the predicted E-box sequences upstream of the 8 genes induced in response to PI 3-kinase inhibition (Fig. 1B). Inhibition of PI 3-kinase decreased c-Myc occupancy upstream of Ncl and DKC-1, consistent with the decrease in total cellular levels of c-Myc following inhibition of PI 3-kinase (see Fig. 1A). Likewise, inhibition of PI 3-kinase decreased the low level of c-Myc binding detectable upstream of the 8 genes induced by PI 3-kinase inhibition. It thus appeared that activation by c-Myc was not responsible for induction of these genes following inhibition of PI 3-kinase.
FIGURE 1.
c-Myc does not regulate expression of genes induced by PI 3-kinase inhibition. A, proliferating T98G cells were treated for 30, 60, and 120 min with LY294002. Protein extracts were immunoblotted with c-Myc and β-actin antibodies. B, ChIPs were performed with anti-Max, anti-Myc, or control rabbit IgG, using actively proliferating T98G cells that were treated with DMSO (vehicle control) or LY294002 for 30 min (for Myc binding). MYOG is a negative control. Data are presented as % input genomic DNA and are the mean ± S.E. of 3 samples. Binding of Max was significantly higher than the IgG control at all E-box sites (p < 0.05 by t test using S.D.). Positions of the E-box sites are shown in Fig. 5. C, actively proliferating T98G cells were transfected with c-Myc siRNA. Data are presented as the fold-difference in expression between cells transfected with c-Myc siRNA compared with nonspecific control siRNA and are the mean ± S.E. of 3 independent transfections. Knockdown of c-Myc protein was 70% (see inset).
c-Myc can also repress transcription, although repression by c-Myc generally occurs when complexed with the zinc finger transcription factor Miz-1 at core promoters rather than E-box sequences (30). However, because inhibition of PI 3-kinase resulted in a decrease in c-Myc occupancy upstream of the genes induced by PI 3-kinase inhibition, we tested the effect of siRNA knockdown of c-Myc on the expression of these genes. Knockdown of c-Myc had no significant effect on gene expression, indicating that the induction of these genes did not result from a loss in c-Myc/Miz-1 repression (Fig. 1C). It thus appeared that, although Max was bound to these E-box sequences, c-Myc did not contribute to the induction of these genes in response to inhibition of PI 3-kinase.
Max, Mnt, and Sin3a Bind to E-box Sequences and Repress Transcription in Proliferating Cells
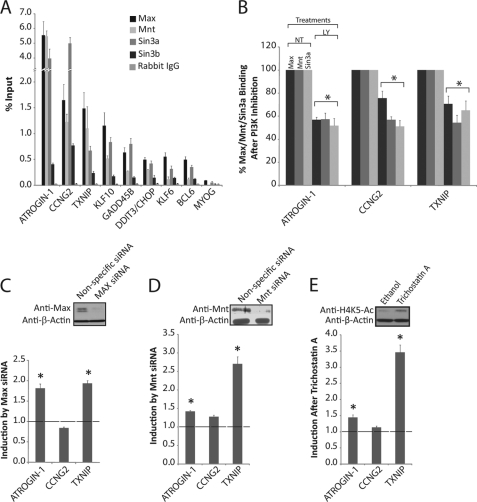
The high levels of Max and low levels of c-Myc occupancy at the E-box sites upstream of genes that were induced by inhibition of PI 3-kinase suggested that Max might be bound to these sites in association with a different dimerization partner. Moreover, because most other dimerization partners of Max act as transcriptional repressors rather than activators, their binding at these sites would be consistent with the low level of transcription of these genes in proliferating cells. Mnt was detectable by immunoblot analysis in proliferating T98G cells (see upper panel in Fig. 2D), whereas there was little to no expression of the 4 MXD proteins (data not shown). Consistent with the immunoblot analysis, ChIPs did not detect binding of any of the Mxd proteins (Mxd 1–4) at the E-box sites in either proliferating T98G cells or after PI 3-kinase inhibition (data not shown). However, the Mnt repressor was bound at all 8 of the E-box sites, with levels of Mnt binding comparable with those of Max (Fig. 2A). Max/Mnt dimers repress transcription by recruiting the Sin3a or Sin3b co-repressors (31), so we also investigated binding of Sin3a and Sin3b. Both Sin3a and Sin3b were bound to the upstream regions of all 8 of the PI 3-kinase-regulated genes in proliferating cells, with levels of Sin3a occupancy comparable with those of Max and Mnt (Fig. 2A). ATROGIN-1, CCNG2, and TXNIP showed the highest levels of Sin3a binding, which was in agreement with the high degree of binding of Max and Mnt upstream of these genes.
FIGURE 2.
Max, Mnt, and Sin3a bind to E-box sequences and repress transcription in proliferating cells. A, ChIPs were performed from proliferating T98G cells with anti-Max, anti-Mnt, anti-Sin3a, anti-Sin3b, and control rabbit IgG. Data represent the mean ± S.E. of 3 samples for Max, Mnt, and Sin3a, or 2 samples for Sin3b. Max, Mnt, and Sin3a binding at all E-box sites was significantly higher than the corresponding IgG controls (p < 0.05). B, ChIPs with Max, Mnt, and Sin3a antibodies from cells treated with either DMSO (NT) or LY294002 (LY) for 30 min. Data represent the percentage of binding after LY294002 compared with vehicle control. Data for Max are the mean ± S.E. of 2 and for Mnt and Sin3a the mean ± S.E. of 3 samples. Significant differences between control and LY294002-treated cells are designated (*, p < 0.05). C, actively proliferating T98G cells were transfected with Max siRNA. Data are presented as the fold-difference in expression between cells transfected with Max siRNA compared with nonspecific control siRNA and are the mean ± S.E. of 4 independent transfections. Knockdown of Max protein was 90–95% (see inset). Expression of ATROGIN-1 and TXNIP was significantly up-regulated after Max knockdown (*, p < 0.05). D, actively proliferating T98G cells were transfected with Mnt siRNA. Data are presented as the fold-difference in expression between cells transfected with Mnt siRNA compared with nonspecific control siRNA and are the mean ± S.E. of 4 independent transfections. Knockdown of Mnt protein was 60% (see inset). Expression of ATROGIN-1 and TXNIP was significantly up-regulated after Mnt knockdown (*, p < 0.05). E, proliferating T98G cells were treated for 6 h with trichostatin A to inhibit HDAC function. Expression of ATROGIN-1 and TXNIP was significantly up-regulated after trichostatin A treatment (*, p < 0.05).
Based on the high level of binding of the Max-Mnt-Sin3a repressor complex upstream of ATROGIN-1, CCNG2, and TXNIP, its functional role in regulation of these genes was further investigated. Inhibition of PI 3-kinase with LY294002 resulted in a significant decrease in the occupancy of Max, Mnt, and Sin3a at the E-box sites upstream of all three genes (Fig. 2B). Similar results were obtained for Mnt following treatment with two different PI 3-kinase inhibitors, PI-103 and wortmannin (32), ruling out off-target effects of LY294002 (data not shown). It thus appeared that up-regulation of these genes following inhibition of PI 3-kinase was associated with decreased binding of the Max-Mnt-Sin3a repressor complex to their upstream E-box sequences.
We further investigated the role of repression by the Max-Mnt-Sin3a complex by siRNA knockdowns of Max and Mnt, as well as by inhibition of histone deacetylases that mediate repression by Sin3a (29). Transfection of proliferating T98G cells with either Max or Mnt siRNAs up-regulated the expression of ATROGIN-1 and TXNIP, although expression of CCNG2 was not significantly affected (Fig. 2, C and D). Consistent with the results of Max and Mnt knockdowns, inhibition of histone deacetylases in proliferating T98G cells with trichostatin A also induced the expression of ATROGIN-1 and TXNIP (Fig. 2E). Taken together, these results indicate that a complex of Max, Mnt, and Sin3a acts in proliferating cells to repress the transcription of genes that are induced following inhibition of PI 3-kinase. The increased expression of ATROGIN-1 and TXNIP upon Max/Mnt knockdown and HDAC inhibition further suggests that loss of repression is sufficient to induce transcription of these genes.
MITF and USF1 Activate Genes That Are Induced by Inhibition of PI 3-Kinase
In addition to Max and its dimerization partners, there are other transcription factors capable of binding canonical E-box sequences. These include transcriptional activators MITF, USF1, and USF2. ChIP assays and RNA interference were therefore used to determine whether these factors contribute to gene induction in response to inhibition of PI 3-kinase.
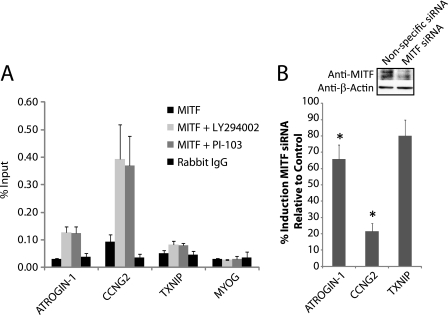
Binding of MITF at the E-box sequences upstream of ATROGIN-1, CCNG2, and TXNIP was tested in both proliferating T98G cells and after 30 min of PI 3-kinase inhibition with LY294002 (Fig. 3A). Inhibition of PI 3-kinase significantly increased occupancy of MITF at the E-box sites upstream of ATROGIN-1 and CCNG2, with a small effect on the lower level of MITF binding upstream of TXNIP. The binding of MITF upstream of these genes was low in proliferating cells when compared with the controls of rabbit IgG or MITF binding upstream of MYOG, the negative control sequence. Binding of MITF also increased in a similar manner at the E-box sites after treatment with PI-103 (Fig. 3A).
FIGURE 3.
MITF binding and activity at E-box sites. A, ChIPs with anti-MITF or control rabbit IgG in proliferating T98G cells treated with DMSO, LY294002, or PI-103 for 30 min. Data are the mean ± S.E. of 3 and 2 samples for LY294002 and PI-103 treatments, respectively. Binding of MITF was significantly higher than IgG controls upstream of ATROGIN-1 and CCNG2 after LY294002 or PI-103 treatment (p < 0.02). B, T98G cells were transfected with either MITF siRNA or nonspecific control siRNA for 48 h followed by 4 h of treatment with either DMSO or LY294002. Knockdown of MITF protein was 75–80% (see inset). Data represent the % induction after LY294002 treatment in cells transfected with MITF siRNA compared with the nonspecific control siRNA and are the mean ± S.E. of 4 independent transfections. The induction of ATROGIN-1 and CCNG2 was significantly lowered after MITF knockdown (*, p < 0.05).
Knockdown of MITF with siRNA was done to determine the importance of this transcription factor in gene induction after PI 3-kinase inhibition (Fig. 3B). Proliferating T98G cells were transfected for 48 h with MITF or control siRNA. PI 3-kinase was then inhibited by treatment with LY294002 for 4 h and gene expression was quantified by real-time RT-PCR. Knockdown of MITF significantly reduced the up-regulation of ATROGIN-1 and CCNG2 after PI 3-kinase inhibition, consistent with the high levels of MITF recruitment upstream of these genes. In contrast, induction of TXNIP was not significantly affected by MITF knockdown. It is noteworthy that CCNG2 displayed the highest levels of MITF binding as well as the greatest sensitivity to MITF knockdown, indicating a prominent role for MITF in CCNG2 induction.
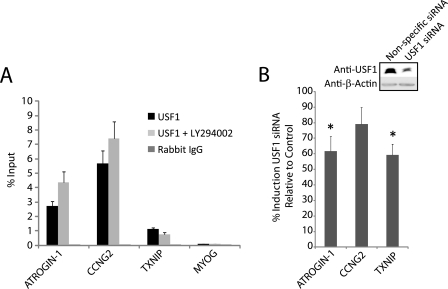
ChIPs also demonstrated substantial binding of USF1, but not of USF2, at the ATROGIN-1, CCNG2, and TXNIP predicted E-box sequences (Fig. 4A and data not shown). In contrast to MITF, USF1 was constitutively bound at high levels in proliferating cells. In addition, USF1 occupancy upstream of ATROGIN-1 and CCNG2 increased following PI 3-kinase inhibition.
FIGURE 4.
USF1 binding and activity at E-box sites. A, ChIPs with anti-USF1 or control rabbit IgG in proliferating T98G cells treated with either DMSO or LY294002 for 30 min. Data are the mean ± S.E. of 8 samples. Binding of USF1 was significantly higher than the IgG controls after both DMSO and LY294002 treatment at tested E-box sites (p < 0.01). B, T98G cells were transfected with either USF1 siRNA or nonspecific control siRNA as described in the legend to Fig. 3B. Knockdown of the USF1 protein was 55–60% (see inset). Data represent mean ± S.E. of 3 transfections. The induction of ATROGIN-1 and TXNIP was significantly inhibited by USF1 knockdown (*, p < 0.05).
siRNA knockdowns against USF1 were done to assess its functional relevance in gene induction in response to PI 3-kinase inhibition. Knockdown of USF1 significantly reduced the up-regulation of ATROGIN-1 and TXNIP when compared with a nonspecific siRNA (Fig. 4B), indicating that USF1 as well as MITF played a role in gene induction following inhibition of PI 3-kinase. Knockdown of USF1 did not affect the expression of CCNG2, most likely because MITF appears to be the major transcriptional activator of this gene in response to PI 3-kinase inhibition.
Co-regulation of the E-box Genes by FoxO1 and FoxO3a
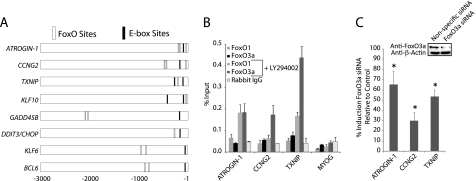
The genes induced after PI 3-kinase inhibition also have FoxO-binding sites in their upstream regulatory regions (9), suggesting possible co-regulation by FoxO- and E-box-binding proteins (Fig. 5A). We previously demonstrated that inhibition of PI 3-kinase in proliferating T98G cells leads to the activation of FoxO1 and FoxO3a (9). ChIPs revealed no significant binding of either FoxO1 or FoxO3a in proliferating cells, but inhibition of PI 3-kinase resulted in a substantial increase in the binding of FoxO3a, and to a lesser extent FoxO1, at the sites upstream of ATROGIN-1, CCNG2, and TXNIP (Fig. 5B). Knockdown of FoxO3a with siRNA significantly inhibited the induction of all three genes, demonstrating the functional role of FoxO3a in gene induction after PI 3-kinase inhibition (Fig. 5C).
FIGURE 5.
Binding and activity of FoxO1 and FoxO3a. (A) FoxO and E-box binding sites. The E-box binding sites are those analyzed in Figs. 1–4. FoxO binding sites were previously demonstrated (9), except for additional sites predicted upstream of GADD45B (−2115 and −2479) and DDIT3/CHOP (−311). B, ChIPs with anti-FoxO1, anti-FoxO3a, or rabbit IgG in proliferating T98G cells treated with either DMSO or LY294002 for 30 min. Data are the mean ± S.E. of 3 samples. Binding of FoxO3a was significantly higher than IgG controls after LY294002 treatment for all 3 genes (p < 0.05). C, T98G cells were transfected with either FoxO3a siRNA or nonspecific control siRNA. Knockdown of FoxO3a protein was 60–70% (see inset). Data are the mean ± S.E. of 4 transfections. Induction of all 3 genes was significantly inhibited by FoxO3a knockdown (*, p < 0.05).
Regulation of PI 3-Kinase-dependent Genes by MITF, USF1, and FoxO in Rat1 Cells
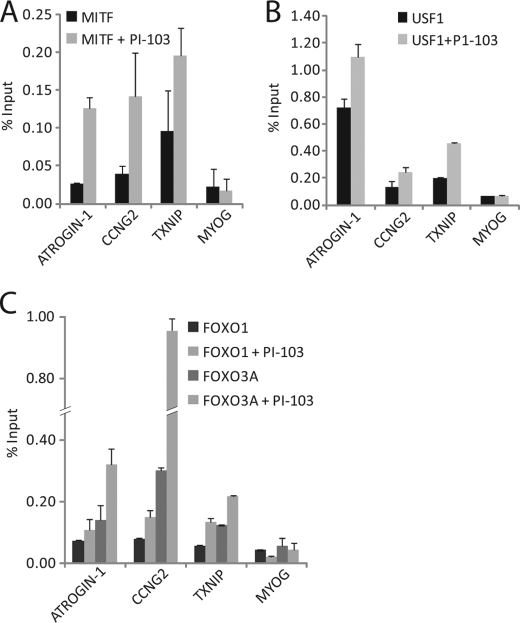
Human T98G glioblastoma cells were used for these experiments because they display normal growth factor dependence for cell cycle regulation and survival (33, 34). To extend these observations to another cell type, we investigated the effects of PI 3-kinase inhibition on gene expression in Rat-1 cells, which similarly display normal growth factor regulation of cell cycle progression and apoptosis (35). Inhibition of PI 3-kinase by treatment of Rat-1 cells with PI-103 resulted in 5-, 4-, and 2.4-fold inductions of ATROGIN-1, CCNG2, and TXNIP, respectively. Thus, these genes were regulated similarly by PI 3-kinase signaling in both Rat-1 and T98G cells. In addition, inhibition of PI 3-kinase in proliferating Rat-1 cells increased binding of MITF, USF1, FoxO1, and FoxO3a to the promoters of ATROGIN-1, CCNG2, and TXNIP (Fig. 6), also similar to results obtained in T98G cells. MITF, USF1, and FoxO thus appeared to function in gene regulation downstream of PI 3-kinase signaling in a normal rat fibroblast line as well in human T98G cells.
FIGURE 6.
Regulation of PI 3-kinase-dependent genes by MITF, USF1, and FoxO in Rat1 cells. ChiPs were performed with anti-MITF (A), anti-USF1 (B), and anti-FoxO1 and anti-FoxO3a antibodies (C) in proliferating Rat-1 cells treated with either DMSO or PI-103 for 1 h. Data are the mean ± S.E. of 3 samples. Binding of MITF, USF1, and FoxO3a upstream of ATROGIN-1, CCNG2, and TXNIP was significantly higher than MyoG controls after PI-103 treatment (p < 0.05).
Activation of MITF and USF1 by GSK3
The activation of FoxO transcription factors in response to inhibition of PI 3-kinase is well characterized. MITF has also been reported to be regulated by PI 3-kinase signaling and GSK3 has been shown to activate MITF transcriptional activity (16–18). When the PI 3-kinase pathway is active, GSK3 is inhibited as a result of Akt phosphorylation of serine 9 (36). Conversely, inhibition of PI 3-kinase signaling results in dephosphorylation and activation of GSK3. This is consistent with the observed role of MITF in activating transcription of genes that are induced in response to PI 3-kinase inhibition.
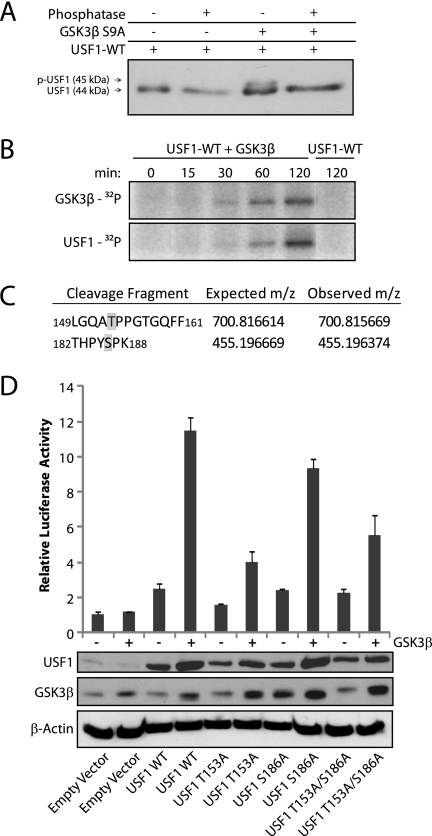
As expected, GSK3 was phosphorylated on serine 9 in proliferating T98G cells, and this inhibitory phosphorylation was lost within 15 min of treatment with LY294002 (Fig. 7A). To determine whether MITF is indeed activated by GSK3 in T98G cells, reporter assays were performed to examine the effect of a constitutively active GSK3β S9A mutant on MITF activity. Coexpression in proliferating cells of constitutively active GSK3 plus MITF resulted in ∼2-fold activation of a reporter construct containing the 0.4-kb upstream regulatory region of ATROGIN-1, which was significantly greater than the modest stimulation resulting from expression of MITF alone (Fig. 7B). These results are consistent with previous reports of the activation of MITF by GSK3, providing a mechanism for activation of MITF in response to inhibition of PI 3-kinase.
FIGURE 7.
Activation of MITF and USF1 by GSK3. A, proliferating T98G cells were treated for 5 to 30 min with LY294002. Protein extracts were then subjected to immunoblotting with pan-GSK3β and GSK3β phospho-Ser-9 antibodies. B, proliferating T98G cells were transfected for 48 h with a luciferase reporter containing a 400-bp promoter fragment of ATROGIN-1 with or without co-transfection with plasmids expressing MITF and GSK3β S9A. Firefly luciferase activity was normalized against Renilla luciferase activity, derived from a co-transfected reporter construct. Data represent the mean ± S.E. of 5 transfections, except for GSK3β S9A alone, which was performed in duplicate. Expression from the ATROGIN-1 promoter-driven reporter construct was significantly higher when MITF was co-expressed with GSK3β S9A compared with MITF alone (*, p < 0.05). Immunoblots of MITF, GSK3β, and β-actin are shown in the lower panel. C, proliferating T98G cells were transfected as above, but with a plasmid expressing USF1 instead of MITF. Luciferase activity was normalized against β-gal activity from a co-transfected plasmid. Data are the mean ± S.E. of 3 transfections, except for GSK3β S9A alone, which was performed in duplicate. Expression from the ATROGIN-1 promoter-driven reporter construct was significantly higher when USF1 was coexpressed with GSK3β S9A compared with USF1 alone (*, p < 0.05). Immunoblots of USF1, GSK3β, and β-actin are shown in the lower panel. D, proliferating T98G cells were transfected with either the wild-type ATROGIN-1 luciferase reporter or a mutated ATROGIN-1 luciferase reporter lacking the single E-box-binding site within its 400-bp promoter region. These cells were also co-transfected with or without GSK3β S9A. Luciferase activity was normalized against β-gal activity from a co-transfected plasmid and data are the mean ± S.E. of 4 transfections. Expression from the ATROGIN-1 promoter-driven reporter construct was significantly lower when the single E-box was removed (p < 0.05).
USF1 is also regulated by phosphorylation and activated by cell stress (19), and has been reported to be stimulated following inhibition of PI 3-kinase (37). We therefore utilized transient transfection assays to determine whether GSK3 activates USF1 in T98G cells. Expression of the ATROGIN-1 reporter increased 4-fold when USF1 was overexpressed. When the constitutively active GSK3β S9A mutant was co-transfected with USF1, a further 6-fold increase in expression was observed, which represented a significant increase over USF1 alone (Fig. 7C). Removing the single E-box sequence from the Atrogin-1 reporter significantly reduced its response to USF1 (Fig. 7D), indicating the functional importance of the E-box element.
Previous studies have shown that activating phosphorylation of USF1 on threonine 153 by the p38 MAP kinase results in a shift in electrophoretic mobility (19). It was thus noteworthy that co-transfection with constitutively active GSK3 resulted in a similar mobility shift of USF1, from an apparent molecular mass of 44 to 45 kDa (see lower panel of Fig. 7C). Treatment of these samples with a phosphatase caused the disappearance of the 45-kDa band, indicating that the mobility shift induced by GSK3 is the result of phosphorylation (Fig. 8A). Direct phosphorylation of USF1 by recombinant GSK3β was also demonstrated in vitro (Fig. 8B). Mass spectrometry analysis of recombinant USF1 that was in vitro phosphorylated by GSK3β revealed two phosphorylation sites at threonine 153 and serine 186 (Fig. 8C). Interestingly, threonine 153 is a previously identified site of phosphorylation by p38 that results in USF1 activation (19). Coinciding with this earlier finding, mutation of threonine 153 to alanine reduced transcriptional activation of USF1 by GSK3β from 4–5-fold to ∼2-fold (Fig. 8D). In contrast, mutation of serine 186 to alanine had little or no effect on USF1 activation (Fig. 8D). Thus, GSK3 activates USF1 by phosphorylating it at the previously identified site of activating phosphorylation by p38. Expression of GSK3 appeared to result in a higher level of accumulation of both wild-type and mutant USF1 proteins, perhaps corresponding to a general stress effect of GSK3 expression and consistent with the ∼2-fold residual activation of T153A USF1 mutants by GSK3.
FIGURE 8.
GSK3 phosphorylates USF1. A, protein extracts from cells transfected with USF1 and GSK3β S9A expression constructs were treated with λ protein phosphatase for 1 h and then analyzed by immunoblotting with antibody against USF1. B, USF1 was incubated with recombinant GSK3β and [32P]ATP for 0–120 min or in the absence of GSK3β for 120 min as a control. Autophosphorylation of GSK3β is shown in the upper panel. C, recombinant GSK3β phosphorylated by USF1 was digested with trypsin and chymotrypsin and then analyzed with a linear ion trap mass spectrometer. Phosphorylated peptide fragments are shown with phosphorylated amino acids in gray. D, proliferating T98G cells were transfected for 24 h with wild-type USF1, mutant USF1-T153A, mutant USF1-S186A, or mutant USF1-T153A/S186A with or without co-transfection with a plasmid expressing GSK3β S9A. Luciferase activity was normalized against β-gal activity from a co-transfected plasmid and data are the mean ± S.E. of 3 transfections. Immunoblots of USF1, GSK3β, and β-actin are shown in the lower panel.
Induction of the E-box-regulated Genes Is GSK3 Dependent
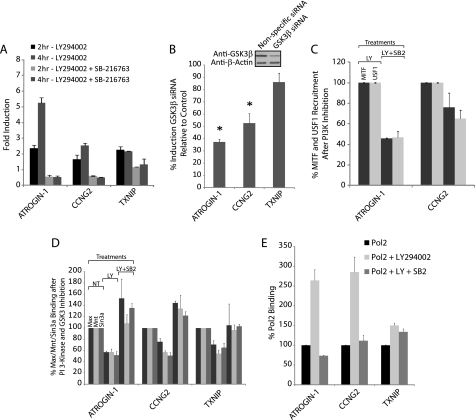
Because both MITF and USF1 were activated by GSK3, we next investigated the importance of GSK3 for induction of ATROGIN-1, CCNG2, and TXNIP after PI 3-kinase inhibition. If GSK3 is required for induction of these genes, then inhibiting GSK3 should block their increased expression. To test this hypothesis, GSK3 was inhibited in conjunction with PI 3-kinase inhibition. Treatment with the GSK3 inhibitor SB-216763 significantly reduced the induction of all three genes in response to inhibition of PI 3-kinase, although the effect of GSK3 inhibition was more modest on the induction of TXNIP (Fig. 9A). Consistent with the effects of inhibiting GSK3 with SB-216763, knockdown of GSK3β with siRNA inhibited the induction of ATROGIN-1 and CCNG2, although induction of TXNIP was not significantly affected (Fig. 9B). Overall, the effects of GSK3β siRNA were less than those of the small molecule inhibitor. This discrepancy is likely due to the inability of the GSK3β siRNA to sufficiently knockdown the high levels of GSK3β present in T98G cells, which were reduced only about 2-fold by siRNA treatment. In addition, T98G cells contain GSK3α, which, although present at lower levels than GSK3β (data not shown), could also contribute to gene induction and is inhibited by SB-216763 but not targeted by GSK3β siRNA.
FIGURE 9.
GSK3 promotes expression of E-box-regulated genes. A, proliferating T98G cells were treated with LY294002 with or without the GSK3 inhibitor SB-216763. Data are presented as fold-induction for each gene, compared with cells treated with DMSO vehicle control, at 2 and 4 h of PI 3-kinase inhibition and represent the mean ± S.E. of 2 independent treatments. B, induction of the E-box-regulated genes after GSK3β siRNA knockdown. T98G cells were transfected with either GSK3β siRNA or nonspecific control siRNA as in Fig. 3B. Knockdown of GSK3β protein was ∼50% (see inset). Data are the mean ± S.E. of 4 independent transfections. The induction of ATROGIN-1 and CCNG2 was significantly lowered after GSK3β knockdown (*, p < 0.05). C, ChIPs with MITF or USF1 antibodies from T98G cells treated for 30 min with either LY294002 (LY) or LY294002 + SB-216763 (LY + SB2). Data are the percentage of MITF and USF1 binding for LY + SB2 compared with LY and are the mean ± S.E. of 2 and 3 independent determinations for MITF and USF1, respectively. D, ChIPs with Max, Mnt, and Sin3a antibodies from T98G cells treated for 30 min with DMSO (no treatment, or NT), LY294002 (LY), or LY294002 + SB-216763 (LY + SB2). Data are the percentage of Max, Mnt, and Sin3a binding compared with the vehicle control and are the mean ± S.E. of 3 independent determinations. E, ChIPs with Pol II antibodies, quantified by PCR using primers at the transcription start sites. Data are the percentage of Pol II binding compared with the vehicle control and are the mean ± S.E. of 2 independent determinations.
We also investigated the role of GSK3 in mediating changes in the occupancy of these transcription factors in response to inhibition of PI 3-kinase. The increased occupancy of both MITF and USF1 upstream of ATROGIN-1 and CCNG2 in response to inhibition of PI 3-kinase (see Figs. 3 and 4) was reduced by inhibition of GSK3 (Fig. 9C). In addition, inhibition of GSK3 blocked the reduction in Max/Mnt/Sin3a occupancy following inhibition of PI 3-kinase upstream of ATROGIN-1, CCNG2, and TXNIP, although the effects of GSK3 inhibition on Max/Mnt/Sin3a binding upstream of TXNIP were more modest than for ATROGIN-1 and CCNG2 (Fig. 9D). Thus, GSK3 was involved in activation of E-box-binding proteins MITF and USF1 as well as in decreased occupancy of E-box sequences by the Max-Mnt-Sin3a repressor complex. In addition, we investigated the effects of PI 3-kinase and GSK3 on the binding of RNA polymerase II (Pol II) at the transcription start sites of the E-box-regulated genes. Inhibition of PI 3-kinase resulted in a 2.5-fold increase in the occupancy of Pol II upstream of ATROGIN-1 and CCNG2, whereas Pol II occupancy upstream of TXNIP was only moderately affected by PI 3-kinase inhibition (Fig. 9E). Inhibition of GSK3 prevented the increased Pol II occupancy upstream of both ATROGIN-1 and CCNG2 (Fig. 9E), further supporting the role of GSK3 in the induction of these genes.
Knockdown of FoxO3a or MITF Protects Cells from Apoptosis following Inhibition of PI 3-Kinase
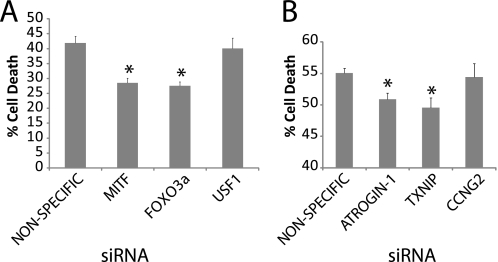
The FoxO transcription factors play a key role in the induction of apoptosis following inhibition of PI 3-kinase (5, 7–8, 38). However, the potential roles of MITF and USF1 in regulation of cell survival downstream of PI 3-kinase signaling have not been investigated. We therefore sought to determine whether these E-box-binding proteins also functioned in the induction of apoptosis following inhibition of PI 3-kinase. Proliferating T98G cells were transfected with siRNAs against FoxO3a, MITF, or USF1 and then treated with LY294002 to inhibit PI 3-kinase for 40 h. This resulted in the death of 40–45% of cells transfected with a nonspecific control siRNA, whereas transfection with FoxO3a siRNA reduced the amount of cell death to 25–30% (Fig. 10A). Although siRNA against USF1 did not affect cell survival, siRNA against MITF inhibited cell death to a similar extent as siRNA against FoxO3a. In agreement, siRNA knockdown of the downstream gene targets of FoxO and MITF, ATROGIN-1 and TXNIP, also significantly reduced the amount of cell death by ∼10% (Fig. 10B). The smaller effect of knockdown of individual target genes compared with knockdown of the transcription factors is expected, because the transcription factors are likely to contribute to the induction of multiple effector genes with proapoptotic activities. These results indicate that MITF as well as FoxO3a plays a significant biological role in the induction of apoptosis following inhibition of PI 3-kinase.
FIGURE 10.
MITF and FoxO3a regulate apoptosis following inhibition of PI 3-kinase. A, proliferating T98G cells were transfected with nonspecific, USF1, MITF, or FoxO3a siRNA for 48 h. Transfected cells were treated with LY294002 for 40 h. Cell viability was determined by MTT assay both prior to and after treatment with LY294002, and results are presented as the percentage of cell death following LY294002 treatment. Data are the mean ± S.E. of 6 independent samples. Knockdown of both MITF and FoxO3a significantly reduced cell death (p < 0.001). B, proliferating T98G cells were transfected with nonspecific, ATROGIN-1, CCNG2, and TXNIP siRNA for 48 h. Transfected cells were treated with LY294002 for 40 h. Cell viability was determined by MTT assay both prior to and after treatment with LY294002, and results are presented as the percentage of cell death following LY294002 treatment. Data are the mean ± S.E. of 10 independent samples. Knockdown of ATROGIN-1 and TXNIP significantly reduced cell death (p < 0.005).
DISCUSSION
The PI 3-kinase/Akt/GSK3 signaling pathway is a central regulator of cell survival and proliferation. This is in part mediated by transcriptional regulation, with both Akt and GSK3 phosphorylating a variety of transcription factors. A key component of this regulation is Akt phosphorylation and inhibition of the FoxO subfamily of transcription factors, which stimulate the expression of multiple target genes that induce cell cycle arrest and apoptosis. However, global expression profiling of genes that were induced in response to inhibition of PI 3-kinase identified genes with an over-representation of E-box sequences as well as FoxO-binding sites within their upstream regulatory regions (9). In the present study, we have therefore investigated the roles of E-box-binding proteins, together with FoxO transcription factors, in the regulation of these genes.
c-Myc was not involved in gene induction in response to PI 3-kinase inhibition, consistent with the general function of c-Myc as a transcriptional activator that is positively regulated by PI 3-kinase signaling (10, 11). c-Myc was not significantly bound to the E-box sites upstream of these genes, either in proliferating cells or following PI 3-kinase inhibition. As expected, inhibition of PI 3-kinase in proliferating cells resulted in a rapid decrease in c-Myc protein levels. In addition, siRNA knockdown of c-Myc had no effect on the expression of the genes induced by PI 3-kinase inhibition, eliminating the possibility that c-Myc was acting as a repressor of these genes in proliferating cells.
In contrast to the lack of c-Myc binding, Max binding at the predicted E-box sites of these genes was comparable with the levels of Max bound to known Myc/Max target genes in proliferating cells. The binding of Max but not c-Myc to E-boxes of the genes induced by inhibition of PI 3-kinase contrasts to the 95% overlap between Max- and c-Myc-binding sites reported in a Burkitt lymphoma cell line (39). This suggests that Max may be associated with another binding partner at these sites, such as the Mnt or Mxd 1–4 repressors. Mnt, but not Mxd 1–4, was detected by immunoblotting and was bound with Max at the predicted E-box sites in proliferating T98G cells. In agreement with repression of these genes by Max/Mnt proteins, Sin3a and Sin3b co-repressors were also bound at these sites in proliferating cells.
The functional role of the Max-Mnt-Sin3 repressor complex was further analyzed with respect to expression of ATROGIN-1, CCNG2, and TXNIP, which had the highest levels of Max/Mnt binding at their upstream E-box sequences. Inhibition of PI 3-kinase was associated with a reduction in Max-Mnt-Sin3a occupancy at the E-box sites upstream of these genes. In addition, siRNA knockdown of Max and Mnt in proliferating cells with active PI 3-kinase signaling was sufficient to induce expression of ATROGIN-1 and CCNG2, as was inhibition of HDAC activity, consistent with the role of HDACs in Max-Mnt-Sin3 repression. Thus, the binding of Max/Mnt contributed to repression of these genes in proliferating cells, which was relieved by inhibition of PI 3-kinase and a reduction in the occupancy of E-box sites by Max-Mnt-Sin3a complexes.
Although Max/Mnt repressed expression of target genes in proliferating cells, two additional E-box-binding proteins, MITF and USF1, activated gene expression in response to PI 3-kinase inhibition. MITF was first identified as a melanocyte differentiation factor, with the tissue-specific MITF-m isoform expressed at high levels in melanocytes (40, 41). However, additional MITF isoforms are expressed at lower levels in a variety of other cell types, including the MITF-h isoform, which is expressed in T98G cells (42–44). Although MITF contributes to melanogenesis and can act as an oncogene in melanomas, it also induces transcription of genes encoding proteins that inhibit cell proliferation, such as p21Cip (45) and p16INK4a (46). In proliferating T98G cells, inhibition of PI 3-kinase led to a substantial recruitment of MITF upstream of ATROGIN-1 and CCNG2, and to a lesser extent upstream of TXNIP. Knockdown of MITF with siRNA directly demonstrated that MITF activates transcription of ATROGIN-1 and CCNG2 following PI 3-kinase inhibition.
USF1 and USF2 are ubiquitously expressed E-box binding transcription factors that can either homo- or heterodimerize to activate transcription. USF is a stress-responsive transcription factor that inhibits cellular proliferation and cell cycle progression through its induction of TGFβ2 (25), p53 (24), and BRCA2 (21). Consistent with a generally antiproliferative role of USF, its overexpression inhibits transformation of primary rat fibroblasts by c-Myc (20, 22) and causes marked growth inhibition of HeLa cells (23). In our studies USF1, but not USF2, was bound at the E-box sites of ATROGIN-1, CCNG2, and TXNIP. USF1 was constitutively bound upstream of all 3 genes in proliferating cells, and its binding upstream of ATROGIN-1 and CCNG2 increased in response to inhibition of PI 3-kinase. siRNA experiments indicated that USF1 contributes to induction of ATROGIN-1 and TXNIP in response to inhibition of PI 3-kinase. The effect of USF-1 siRNA on TXNIP expression indicates that activation of USF-1 in response to inhibition of PI 3-kinase contributed to increased transcription even though USF-1 occupancy (determined by ChIP) did not increase upstream of this gene.
MITF has previously been reported to be activated in response to inhibition of PI 3-kinase and to be phosphorylated by GSK3 (16–18). In agreement with these findings we showed that overexpression of constitutively active GSK3β in T98G cells stimulates the transcriptional activity of MITF. USF1 is known to be activated in response to stress, with phosphorylation by p38 at threonine 153 being one mechanism of its activation (19). In the present study, we have additionally demonstrated that USF1 is phosphorylated by GSK3 at threonine 153, accounting for its activation by GSK3. We further observed that GSK3 phosphorylates USF-1 at serine 186, a residue of USF-1 that has also been reported to be phosphorylated in vivo (47), although the role of this modification remains to be determined. The role of GSK3 in promoting the transcriptional activity of MITF and USF1 was further substantiated by experiments showing that either a small molecule GSK3 inhibitor or siRNA targeting GSK3β prevented the induction of ATROGIN-1, CCNG2, and TXNIP after PI 3-kinase inhibition.
FoxO transcription factors functioned coordinately with Max/Mnt, MITF, and USF1 to control transcription of ATROGIN-1, CCNG2, and TXNIP. Inhibition of PI 3-kinase resulted in the binding of both FoxO1 and FoxO3a upstream of all three genes and siRNA experiments confirmed the requirement for FoxO in gene induction. Coordinate regulation of these genes by both E-box and FoxO transcription factors is an interesting contrast to studies that have found that FoxO and c-Myc directly antagonize each other in the regulation of multiple target genes, with FoxO inhibiting gene induction by c-Myc (48, 49). On the other hand, there is also evidence that the Forkhead family member Foxa2 and USF can act cooperatively to enhance the transcriptional activity of each other (50). In a similar manner, our data suggest that the efficient induction of the E-box-regulated genes after PI 3-kinase inhibition involves the coordinate activity of FoxO, MITF, and USF1. It is noteworthy that FoxO is considered a pioneering transcription factor, in that it can bind to and decondense compacted chromatin (51, 52).
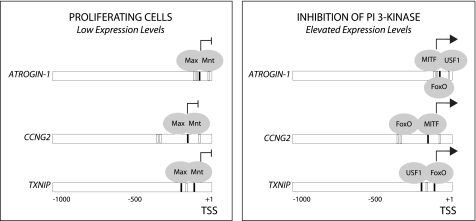
The network of E-box binding and FoxO transcription factors that regulates these genes induced in response to inhibition of PI 3-kinase is summarized in Fig. 11. In proliferating cells in the presence of growth factors, these genes are repressed by Max/Mnt. Inhibition of PI 3-kinase leads to activation of FoxO transcription factors and the GSK3 protein kinase as a result of the loss of inhibitory phosphorylations by Akt. GSK3 in turn activates MITF and USF1 which, together with FoxO, contribute to target gene induction. It is noteworthy that ATROGIN-1, CCNG2, and TXNIP are all repressed by Max/Mnt/Sin3a in proliferating cells and are all activated by FoxO in response to inhibition of PI 3-kinase. However, MITF and USF1 appear to have preferential roles in induction of different target genes. Both siRNA and ChIP experiments indicate that MITF plays a major role in induction of CCNG2 and that both MITF and USF-1 contribute to induction of ATROGIN-1. siRNA experiments also indicate that USF-1 contributes to induction of TXNIP, although this is not associated with increased binding of USF1 to the TXNIP E-box sequences. Interestingly, TXNIP displayed the highest level of FoxO binding following inhibition of PI 3-kinase, suggesting that it may be primarily targeted by FoxO. A larger role for FoxO transcription factors in induction of TXNIP is also consistent with the lower sensitivity of TXNIP to inhibition of GSK3, as compared with ATROGIN-1 and CCNG2.
FIGURE 11.
Gene regulation by FoxO and E-box transcription factors downstream of PI 3-kinase/Akt/GSK3 signaling. E-box sequences (black boxes) and FoxO-binding sites (white boxes) are shown in 1 kb upstream of the transcription start site (TSS) for ATROGIN-1, CCNG2, and TXNIP. The E-box and FoxO-binding sites are those as analyzed in Figs. 1–5. The E-box and FoxO transcription factors that regulate expression of each the indicated target genes are shown, as discussed in the text.
The association of Max/Mnt with E-box sequences upstream of all three genes was reduced following inhibition of PI 3-kinase. This was not associated with a change in Mnt levels or electrophoretic mobility detectable by immunoblotting (data not shown), indicating that the decrease in Mnt promoter occupancy did not result from changes in the amount of the phosphorylation state of Mnt detectable by a shift in electrophoretic mobility, as reported for Mnt phosphorylation by a yet unidentified kinase in the MEK/ERK pathway (53). Although this does not rule out a direct effect of PI 3-kinase inhibition and GSK3 activation on Mnt, it appears more likely that Mnt is displaced from E-box sequences by activating factors MITF and USF-1. Recruitment of FoxoO may also contribute to Mnt displacement, particularly in the case of TXNIP where the E-box and FoxO sites are in close proximity.
The role that the FoxO transcription factors play in cell survival is well established. In the absence of PI 3-kinase/Akt signaling, FoxO induces the expression of genes encoding a variety of proteins, such as Bim, BCL-6, BNIP3, and FasL that promote apoptosis (54). Consistent with this, we found that siRNA knockdown of FoxO3a significantly protected cells from apoptosis following inhibition of PI 3-kinase. Importantly, siRNA knockdown of MITF had a similar effect on cell survival as did knockdown of FoxO3a. Thus, regulation of MITF by PI 3-kinase/Akt/GSK3 signaling also plays a critical role in the control of apoptosis. siRNA knockdowns of either ATROGIN-1 or TXNIP also significantly protected cells from apoptosis following PI 3-kinase inhibition, consistent with previous studies showing that both Atrogin-1 (55) and TXNIP (56) promote apoptosis. These results indicate that E-box binding as well as FoxO transcription factors, regulated by Akt and GSK3, function to regulate the expression of genes downstream of PI 3-kinase signaling.
Acknowledgments
We are grateful to Dr. Robert Roeder (Rockefeller University) for providing USF1 expression plasmids and Dr. Alfred Goldberg (Harvard Medical School) for the ATROGIN-1 promoter luciferase plasmid. We are also grateful to Ulla Hansen for helpful discussions and critical comments on the manuscript and John Tullai for assistance with the in vitro kinase assay.
This work was supported, in whole or in part, by National Institutes of Health Grant RO1 CA18689.
- PI 3-kinase
- phosphatidylinositol 3-kinase
- GSK3
- glycogen synthase kinase 3
- HDAC
- histone deacetylase
- MTT
- 3-(4,5-dimethylthiazol-2-yl)-2, 5-diphenyltetrazolium bromide
- DMSO
- dimethyl sulfoxide
- Pol II
- polymerase II.
REFERENCES
- 1. Brazil D. P., Yang Z. Z., Hemmings B. A. (2004) Trends Biochem. Sci. 29, 233–242 [DOI] [PubMed] [Google Scholar]
- 2. Duronio V. (2008) Biochem. J. 415, 333–344 [DOI] [PubMed] [Google Scholar]
- 3. Engelman J. A., Luo J., Cantley L. C. (2006) Nat. Rev. Genet. 7, 606–619 [DOI] [PubMed] [Google Scholar]
- 4. Jope R. S., Johnson G. V. (2004) Trends Biochem. Sci. 29, 95–102 [DOI] [PubMed] [Google Scholar]
- 5. Brunet A., Bonni A., Zigmond M. J., Lin M. Z., Juo P., Hu L. S., Anderson M. J., Arden K. C., Blenis J., Greenberg M. E. (1999) Cell 96, 857–868 [DOI] [PubMed] [Google Scholar]
- 6. Kops G. J., de Ruiter N. D., De Vries-Smits A. M., Powell D. R., Bos J. L., Burgering B. M. (1999) Nature 398, 630–634 [DOI] [PubMed] [Google Scholar]
- 7. Martínez-Gac L., Alvarez B., García Z., Marqués M., Arrizabalaga M., Carrera A. C. (2004) Biochem. Soc. Trans. 32, 360–361 [DOI] [PubMed] [Google Scholar]
- 8. Fu Z., Tindall D. J. (2008) Oncogene 27, 2312–2319 [DOI] [PMC free article] [PubMed] [Google Scholar]
- 9. Terragni J., Graham J. R., Adams K. W., Schaffer M. E., Tullai J. W., Cooper G. M. (2008) BMC Cell Biol. 9, 6. [DOI] [PMC free article] [PubMed] [Google Scholar]
- 10. Sears R., Nuckolls F., Haura E., Taya Y., Tamai K., Nevins J. R. (2000) Genes Dev. 14, 2501–2514 [DOI] [PMC free article] [PubMed] [Google Scholar]
- 11. Kamemura K., Hayes B. K., Comer F. I., Hart G. W. (2002) J. Biol. Chem. 277, 19229–19235 [DOI] [PubMed] [Google Scholar]
- 12. Eilers M., Eisenman R. N. (2008) Genes Dev. 22, 2755–2766 [DOI] [PMC free article] [PubMed] [Google Scholar]
- 13. Hooker C. W., Hurlin P. J. (2006) J. Cell Sci. 119, 208–216 [DOI] [PubMed] [Google Scholar]
- 14. Levy C., Khaled M., Fisher D. E. (2006) Trends Mol. Med. 12, 406–414 [DOI] [PubMed] [Google Scholar]
- 15. Corre S., Galibert M. D. (2005) Pigment Cell Res. 18, 337–348 [DOI] [PubMed] [Google Scholar]
- 16. Takeda K., Takemoto C., Kobayashi I., Watanabe A., Nobukuni Y., Fisher D. E., Tachibana M. (2000) Hum. Mol. Genet. 9, 125–132 [DOI] [PubMed] [Google Scholar]
- 17. Khaled M., Larribere L., Bille K., Ortonne J. P., Ballotti R., Bertolotto C. (2003) J. Invest. Dermatol. 121, 831–836 [DOI] [PubMed] [Google Scholar]
- 18. Khaled M., Larribere L., Bille K., Aberdam E., Ortonne J. P., Ballotti R., Bertolotto C. (2002) J. Biol. Chem. 277, 33690–33697 [DOI] [PubMed] [Google Scholar]
- 19. Galibert M. D., Carreira S., Goding C. R. (2001) EMBO J. 20, 5022–5031 [DOI] [PMC free article] [PubMed] [Google Scholar]
- 20. Aperlo C., Boulukos K. E., Pognonec P. (1996) Eur. J. Biochem. 241, 249–253 [DOI] [PubMed] [Google Scholar]
- 21. Davis P. L., Miron A., Andersen L. M., Iglehart J. D., Marks J. R. (1999) Oncogene 18, 6000–6012 [DOI] [PubMed] [Google Scholar]
- 22. Luo X., Sawadogo M. (1996) Proc. Natl. Acad. Sci. U.S.A. 93, 1308–1313 [DOI] [PMC free article] [PubMed] [Google Scholar]
- 23. Qyang Y., Luo X., Lu T., Ismail P. M., Krylov D., Vinson C., Sawadogo M. (1999) Mol. Cell. Biol. 19, 1508–1517 [DOI] [PMC free article] [PubMed] [Google Scholar]
- 24. Reisman D., Rotter V. (1993) Nucleic Acids Res. 21, 345–350 [DOI] [PMC free article] [PubMed] [Google Scholar]
- 25. Scholtz B., Kingsley-Kallesen M., Rizzino A. (1996) J. Biol. Chem. 271, 32375–32380 [DOI] [PubMed] [Google Scholar]
- 26. Sandri M., Sandri C., Gilbert A., Skurk C., Calabria E., Picard A., Walsh K., Schiaffino S., Lecker S. H., Goldberg A. L. (2004) Cell 117, 399–412 [DOI] [PMC free article] [PubMed] [Google Scholar]
- 27. Gregor P. D., Sawadogo M., Roeder R. G. (1990) Genes Dev. 4, 1730–1740 [DOI] [PubMed] [Google Scholar]
- 28. Graham J. R., Tullai J. W., Cooper G. M. (2010) J. Biol. Chem. 285, 4472–4480 [DOI] [PMC free article] [PubMed] [Google Scholar]
- 29. Fernandez P. C., Frank S. R., Wang L., Schroeder M., Liu S., Greene J., Cocito A., Amati B. (2003) Genes Dev. 17, 1115–1129 [DOI] [PMC free article] [PubMed] [Google Scholar]
- 30. Wanzel M., Herold S., Eilers M. (2003) Trends Cell Biol. 13, 146–150 [DOI] [PubMed] [Google Scholar]
- 31. Grandori C., Cowley S. M., James L. P., Eisenman R. N. (2000) Annu. Rev. Cell Dev. Biol. 16, 653–699 [DOI] [PubMed] [Google Scholar]
- 32. Bain J., Plater L., Elliott M., Shpiro N., Hastie C. J., McLauchlan H., Klevernic I., Arthur J. S., Alessi D. R., Cohen P. (2007) Biochem. J. 408, 297–315 [DOI] [PMC free article] [PubMed] [Google Scholar]
- 33. Takahashi Y., Rayman J. B., Dynlacht B. D. (2000) Genes Dev. 14, 804–816 [PMC free article] [PubMed] [Google Scholar]
- 34. Stein G. H. (1979) J. Cell Physiol. 99, 43–54 [DOI] [PubMed] [Google Scholar]
- 35. Yao R., Cooper G. M. (1996) Oncogene 13, 343–351 [PubMed] [Google Scholar]
- 36. Cross D. A., Alessi D. R., Cohen P., Andjelkovich M., Hemmings B. A. (1995) Nature 378, 785–789 [DOI] [PubMed] [Google Scholar]
- 37. Nowak M., Helleboid-Chapman A., Jakel H., Martin G., Duran-Sandoval D., Staels B., Rubin E. M., Pennacchio L. A., Taskinen M. R., Fruchart-Najib J., Fruchart J. C. (2005) Mol. Cell. Biol. 25, 1537–1548 [DOI] [PMC free article] [PubMed] [Google Scholar]
- 38. Dijkers P. F., Medema R. H., Lammers J. W., Koenderman L., Coffer P. J. (2000) Curr. Biol. 10, 1201–1204 [DOI] [PubMed] [Google Scholar]
- 39. Li Z., Van Calcar S., Qu C., Cavenee W. K., Zhang M. Q., Ren B. (2003) Proc. Natl. Acad. Sci. U.S.A. 100, 8164–8169 [DOI] [PMC free article] [PubMed] [Google Scholar]
- 40. Hemesath T. J., Steingrímsson E., McGill G., Hansen M. J., Vaught J., Hodgkinson C. A., Arnheiter H., Copeland N. G., Jenkins N. A., Fisher D. E. (1994) Genes Dev. 8, 2770–2780 [DOI] [PubMed] [Google Scholar]
- 41. Hodgkinson C. A., Moore K. J., Nakayama A., Steingrímsson E., Copeland N. G., Jenkins N. A., Arnheiter H. (1993) Cell 74, 395–404 [DOI] [PubMed] [Google Scholar]
- 42. Fuse N., Yasumoto K., Takeda K., Amae S., Yoshizawa M., Udono T., Takahashi K., Tamai M., Tomita Y., Tachibana M., Shibahara S. (1999) J. Biochem. 126, 1043–1051 [DOI] [PubMed] [Google Scholar]
- 43. Steingrímsson E., Copeland N. G., Jenkins N. A. (2004) Annu. Rev. Genet. 38, 365–411 [DOI] [PubMed] [Google Scholar]
- 44. Hershey C. L., Fisher D. E. (2005) Gene 347, 73–82 [DOI] [PubMed] [Google Scholar]
- 45. Carreira S., Goodall J., Aksan I., La Rocca S. A., Galibert M. D., Denat L., Larue L., Goding C. R. (2005) Nature 433, 764–769 [DOI] [PubMed] [Google Scholar]
- 46. Loercher A. E., Tank E. M., Delston R. B., Harbour J. W. (2005) J. Cell Biol. 168, 35–40 [DOI] [PMC free article] [PubMed] [Google Scholar]
- 47. Huttlin E. L., Jedrychowski M. P., Elias J. E., Goswami T., Rad R., Beausoleil S. A., Villén J., Haas W., Sowa M. E., Gygi S. P. (2010) Cell 143, 1174–1189 [DOI] [PMC free article] [PubMed] [Google Scholar]
- 48. Chandramohan V., Jeay S., Pianetti S., Sonenshein G. E. (2004) J. Immunol. 172, 5522–5527 [DOI] [PubMed] [Google Scholar]
- 49. Bouchard C., Marquardt J., Brás A., Medema R. H., Eilers M. (2004) EMBO J. 23, 2830–2840 [DOI] [PMC free article] [PubMed] [Google Scholar]
- 50. Viney T. J., Schmidt T. W., Gierasch W., Sattar A. W., Yaggie R. E., Kuburas A., Quinn J. P., Coulson J. M., Russo A. F. (2004) J. Biol. Chem. 279, 49948–49955 [DOI] [PubMed] [Google Scholar]
- 51. Cirillo L. A., Lin F. R., Cuesta I., Friedman D., Jarnik M., Zaret K. S. (2002) Mol. Cell 9, 279–289 [DOI] [PubMed] [Google Scholar]
- 52. Hatta M., Cirillo L. A. (2007) J. Biol. Chem. 282, 35583–35593 [DOI] [PubMed] [Google Scholar]
- 53. Popov N., Wahlström T., Hurlin P. J., Henriksson M. (2005) Oncogene 24, 8326–8337 [DOI] [PubMed] [Google Scholar]
- 54. Greer E. L., Brunet A. (2005) Oncogene 24, 7410–7425 [DOI] [PubMed] [Google Scholar]
- 55. Xie P., Guo S., Fan Y., Zhang H., Gu D., Li H. (2009) J. Biol. Chem. 284, 5488–5496 [DOI] [PubMed] [Google Scholar]
- 56. Wang Z., Rong Y. P., Malone M. H., Davis M. C., Zhong F., Distelhorst C. W. (2006) Oncogene 25, 1903–1913 [DOI] [PubMed] [Google Scholar]


