Background: We investigated the role of TIM4 in the induction of regulatory T cells (Tregs) in tumors.
Results: High TIM4 levels were detected in glioma tissue and contributed to tumor-specific Treg development.
Conclusion: TIM4 is important in inducing Tregs in gliomas.
Significance: TIM4 may be a target in glioma treatment.
Keywords: Brain Tumors, Immunology, Macrophages, T Cell Biology, Tumor Immunology
Abstract
Tumor tolerance plays a critical role in tumor growth and escape from immune surveillance. The mechanism of tumor tolerance development is not fully understood. Regulatory T cells (Tregs) play a critical role in tumor tolerance. TIM4 (T cell immunoglobulin- and mucin domain-containing molecule-4) is involved in immune regulation. We investigated the role of TIM4 in the induction of Tregs in tumors. Surgically removed glioma tissue and peripheral blood samples were obtained from 25 glioma patients. Immune cells were isolated from the tissue and blood samples. Confocal microscopy was employed to detect macrophages phagocytosing apoptotic T cells. The generation of tumor-specific Tregs and the immune suppression function of Tregs were observed in cell culture models. High levels of TIM4 were detected in glioma-derived macrophages. Phosphatidylserine (PS) was detected in glioma-derived T cells; naïve T cells expressed low levels of PS that could be up-regulated by hypoxia. Glioma-derived macrophages phagocytosed PS-expressing T cells, gaining the tolerogenic properties, which could induce tumor-specific Tregs; the latter could suppress tumor-specific CD8+ T cells. We conclude that macrophage-derived TIM4 plays an important role in the induction of Tregs in gliomas, which may play an important role in tumor tolerance.
Introduction
Tumor tolerance plays a critical role in tumor survival. Regulatory T cells (Tregs),2 characterized by the expression of a cluster of differentiation and intracellular Foxp3 (Foxhead box P3) markers, can inhibit the antitumor immune response and contribute to the development of tumor tolerance. The increase in Tregs within tumors (1) implies their involvement in the pathogenesis and progression of tumors. Tregs may suppress tumor-specific effector T cells (such as tumor-specific CD8+ T cells) in tumor tissue (2) to protect the tumor cells from being killed, but the development of Tregs in tumors needs to be understood in more detail.
Malignant glioma (glioma, in short) is characterized as a diffuse glioma of astrocytic, oligodendroglial, or mixed lineage with a World Health Organization grade of either III or IV and is one of the most common central nervous system cancers of adults and children. Glioblastomas (grade IV glioma) account for ∼70% of such cases, whereas anaplastic glioma (grade III) represents the other 30% (3). Glioma has a number of histological features and responds poorly to standard therapeutic regimens. Compared with patients with other types of tumors such as skin cancer, patients with glioma have a much shorter median survival time (4). The pathogenesis of glioma is poorly understood. The treatment of glioma is not satisfactory currently; additional potent therapeutic remedies for glioma are urgently needed. Therefore, finding new therapeutic targets may lead to the invention of novel treatments for glioma; to break down the tumor tolerance may be a practical approach (5).
One of the microenvironmental stressors associated with tumor progression is the hypoxic microenvironment (6). Hypoxia is known to induce gene transcription involved in the regulation of cell proliferation, extracellular matrix production, cell adhesion, and other hallmarks of tumorigenesis. The mechanism underlying these effects can be mimicked by induction of the hypoxia-inducible factor (HIF), which acts to regulate cellular processes, including glucose metabolism, angiogenesis, cell proliferation, and tissue remodeling (7). Recent reports indicate that hypoxia facilitates the generation of Tregs in tumor tissue (8) or strengthens the function of Tregs (9) in tumors, but the underlying mechanism is incompletely understood.
Gliomas are infiltrated by a number of leukocytes, including macrophages (Mϕs), which are positively correlated with glioma progression (10). Tumor-associated Mϕs are specifically correlated with high-grade glioma and poor prognosis (11). Although the essential role of Mϕs is to fight against invading pathogens, recent reports indicate that Mϕs are also involved in adaptive immunity such as induction of Tregs (12). Whether Mϕs also modulate the generation of Tregs in glioma needs to be further investigated.
TIM4 (T cell immunoglobulin- and mucin domain-containing molecule-4) is a newly described molecule. It is involved in immune regulation such as to initiate skewed Th2 polarization (13, 14) and to mediate phagocytosis of apoptotic cells (15). TIM4 is also found in tumor tissue such as histiocytic and dendritic cell neoplasms, which consistently express TIM3 and TIM4. It has been suggested that these molecules can be new markers of neoplasms derived from histiocytic and dendritic cells (16). Whether TIM4 plays any role in the tumor pathogenesis is unknown.
On the basis of the information above, we hypothesized that TIM4 is involved in the induction of Tregs in tumors such as gliomas, which may be associated with tumor progression, possibly via generating or/and promoting tumor tolerance. Therefore, we studied the relationship between TIM4 and Tregs in glioma tissue with surgically removed glioma specimens. The results show that TIM4 plays an important role in the induction of tumor tolerance.
EXPERIMENTAL PROCEDURES
Reagents
Antibodies against IL-29 (B-21), TGF-β1 (3C11), Foxp3 (F-9), and granzyme B were purchased from Santa Cruz Biotechnology (Shanghai, China). Neutralizing anti-IL-29 antibody (AF1598), neutralizing anti-HIF1α antibody and the IL-29 ELISA kit were purchased from R&D Systems (Shanghai, China). Antibodies using for flow cytometry, permeabilization reagents, and anti-CD3/CD28 plates were from BD Biosciences. Immune cell isolation kits were purchased from Miltenyi Biotec (Shanghai, China). Anti-IL-29 receptor antibody was purchased from Abcam (Shanghai, China). Fluorescently labeled antibodies against CD3, CD4, and CD138 were purchased from eBioscience (Shanghai, China). The ALDEFLUOR® kit was from STEMCELL Technologies (Vancouver, Canada). LE540 was purchased from Wako Chemicals USA (Richmond, VA). All solutions and reagents used in experiments were checked for endotoxin levels with a limulus assay and had <0.2 units of endotoxin/10 μg of reagent.
Patients
Twenty-five glioma patients were recruited for this study. The diagnosis of glioma was reached by routine procedures established in our department, which have been published elsewhere (17). All patients did not receive any special treatment for glioma before surgery. The patients included 12 males (23–65 years old) and 13 females (34–56 years old). According to the World Health Organization classification (17), the group of patients included 16 grade IV and nine grade III astrocytomas. The study was approved by the Human Research Ethic Committee at the Third Military Medical University. Informed consent was obtained from each patient.
Glioma Tissue Collection and Immune Cell Isolation
Surgically removed glioma tissue was cut into small pieces (2 × 2 × 2 mm) and treated with a predigestion solution (1× Hanks' balanced salt solution containing 5 mm EDTA and 1 mm DTT) at 37 °C for 30 min with slow rotation. The tissue was collected by centrifugation at 1500 rpm for 10 min and incubated in digestion solution (0.05 g of collagenase D, 0.05 g of DNase I, and 0.3 g of Dispase II dissolved in 100 ml of 1× PBS) at 37 °C for 60 min with slow rotation. Cells were filtered with a cell strainer (40 μm in diameter). Isolation of the indicated immune cells was performed with commercial magnetic cell sorting kits (MACS®, Miltenyi Biotec) following the manufacturer's instruction.
Blood Collection
Peripheral blood was collected to a container prefilled with anticoagulant from the operative field during surgery. About 100–150 ml of blood was collected from each patient during the surgery. Peripheral blood mononuclear cells were isolated by gradient density centrifugation for further analysis. About 108–109 cells could be harvested from each blood sample.
Flow Cytometry
Cells were collected and fixed with 1% paraformaldehyde and permeabilization reagent for 30 min. After washing with PBS, cells were blocked by incubation with 1% BSA for 30 min and then incubated with fluorescently labeled antibodies (500–1000 ng/ml) for 30 min on ice. The cells were analyzed using a BD FACSCanto (BD Biosciences). Data were analyzed with FlowJo software (TreeStar).
Western Blotting
Total protein was extracted from surgically removed gliomas, separated by SDS-PAGE on 10% polyacrylamide gels, and transferred to nitrocellulose. The membranes were probed with primary antibodies (1:1000) overnight at 4 °C and with horseradish peroxidase-labeled secondary antibodies for 1 h at room temperature. The immunoreactive bands were revealed using an ECL immunoblot assay kit. Results were recorded on x-ray film.
Immunohistochemistry
A piece of glioma tissue was collected and immediately frozen in liquid nitrogen. Cryosections and cultured cells were fixed with cold acetone for 20 min and stained with the indicated antibodies. Samples were observed under an LSM 510 confocal microscope.
TIM4 Promoter Activation Assay with ChIP
The isolated Mϕs were fixed for 10 min with 1% formaldehyde at room temperature. The cells were lysed in SDS lysis buffer (50 mm Tris-HCl (pH 8.1), 10 mm EDTA, and 1% SDS). The lysates were sonicated under conditions that yielded fragments ranging from 200 to 500 bp. The lysates (2% of each) were used for input, and the residual lysate was subjected to the following immunoprecipitation. Samples (25 μg of chromatin) were subsequently precleared at 4 °C with recombinant protein G-agarose beads (Upstate Biotechnology) coated with salmon sperm DNA. Precleared lysates (100 μl) diluted in immunoprecipitation buffer (0.01% SDS, 1.1% Triton X-100, 1.2 mm EDTA, 16.7 mm Tris-HCl (pH 8.1), and 167 mm NaCl) were immunoprecipitated overnight at 4 °C with antibodies against histone H3 (Lys-9 and Lys-14) N-terminal tails (Upstate Biotechnology). Naïve rabbit IgG (Sigma) was used as a control. Immunocomplexes were precipitated for 3 h with protein A- or protein G-Sepharose beads blocked with salmon sperm DNA. After washing the beads and elution with radioimmune precipitation assay buffer (supplemented with 0.5 m NaCl and 100 μg/ml yeast tRNA) three times, the samples were resuspended in 100 μl of Tris/EDTA buffer (10 mm Tris (pH 8) and 1 mm EDTA). Formaldehyde cross-linking was reversed by incubation at 55 °C for 3 h. DNA was extracted with phenol/chloroform, precipitated in ethanol, and dissolved in 50 μl of Tris/EDTA buffer. Precipitated chromatin samples (2 μl) were subjected to PCR (95 °C for 1 min, 51 °C for 1 min, 72 °C for 0.5 min, and 72 °C for 5 min) with TIM4 promoter primers 5′-CAA CAA TGC CAT TCT ATT TCC AA-3′ (sense) and 5′-AAC CAC TCA ACC CTC CTT CAAT-3′ (antisense) (662-bp product) in a total volume of 50 μl. After 30 cycles of amplification, PCR products (10 μl of each sample) were analyzed on a 1.5% agarose gel.
Immune Cell Isolation
Immune cell isolation was performed by magnetic bead-coupled antibody cell sorting with commercial reagent kits purchased from Miltenyi Biotec following the manufacturer's instruction.
T Cell Proliferation Assay
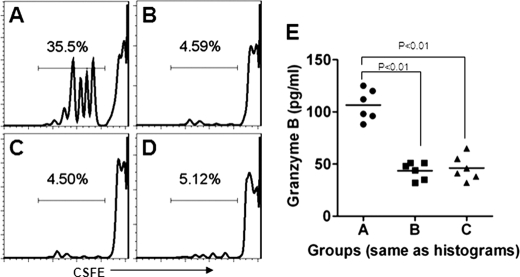
CD8+ T cells and dendritic cells (DCs) were isolated from the collected surgical blood by MACS technology. After staining with carboxyfluorescein succinimidyl ester, CD8+ T cells were co-cultured with DCs (CD8+ T cell/DC = 10:1) with or without isolated Tregs (CD8+ T cell/Treg = 1:1) in the presence of glioma protein extracts (1 μg/ml) for 96 h. Cells were collected at the end of culture and analyzed by flow cytometry.
Cell Culture under Hypoxia
Some T cells were subjected to hypoxia that was obtained using a nitrogen-balanced hypoxia chamber providing a gas mixture containing 5% CO2 and 1% O2 at 37 °C. The cells were cultured for the indicated times.
ELISA
The levels of granzyme B in the supernatant were determined by ELISA with commercial reagent kits following the manufacturer's instruction.
Statistics
Data are expressed as means ± S.D. Values were analyzed by Student's two-tailed unpaired t test when the data consisted of two groups or by analysis of variance when three or more groups were compared. The correlation assay was performed with Microsoft Excel. p < 0.05 was set as the statistically significant criterion.
RESULTS
Mϕs Isolated from Gliomas Express TIM4
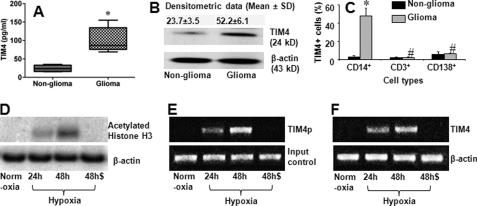
Published data indicate that TIM4 is involved in the regulation of Mϕ function (18) and has been observed in cancer tissue (16). To determine whether TIM4 plays any role in glioma pathogenesis, we measured the levels of TIM4 in surgically removed glioma tissue from 25 patients. The results showed that TIM4 could be detected in glioma tissue and that the level was much higher than in control tissue (the marginal non-glioma tissue) (Fig. 1, A and B). To identify the types of TIM4-expressing cells, we isolated single cells from glioma tissue and analyzed these cells by flow cytometry. The results showed a high frequency of TIM4+ Mϕs in the isolated cells, but very few TIM4+ T cells or TIM4+ B cells were detected (Fig. 1C). The results indicate that high levels of TIM4 can be detected in glioma tissue. Mϕs are the major source of TIM4 in gliomas.
FIGURE 1.
TIM4 is detected in glioma tissue. Total proteins were extracted from each surgically removed glioma tissue and normal tissue (marginal non-glioma; proved by a pathologist) to assess the TIM4 levels by ELISA (A) and Western blotting (B). A, levels of TIM4 determined by ELISA. B, TIM4 blots. C, single cells were prepared with the surgically removed glioma tissue and non-glioma tissue. The cells were stained with antibodies against TIM4, CD14, CD3, and CD138 and analyzed by flow cytometry. Bars indicate the frequency of TIM4+ cells in CD14+, CD3+, or CD138+ cells. Each specimen was processed individually. The data are presented as means ± S.D. from 25 patients. *, p < 0.01 compared with the non-glioma tissue; #, p < 0.01 compared with the group of CD14+ cells. D–F, data from ChIP assay. D, blots of acetylated histone H3 (upper panel). E, expression of the TIM4 promoter (TIM4p; upper panel). F, expression of TIM4 mRNA (upper panel). The data in D–F represent three experiments. Cells were cultured under normoxia or hypoxia. Cells cultured under hypoxia were cultured for 24 or 48 h as indicated with (48h$) or without (48h) the anti-HIFα1 antibody (500 ng/ml) added to the culture medium. Samples from patients were analyzed individually.
We next examined whether the peripheral Mϕs express TIM4. We isolated CD14+ cells from the glioma patients. As shown by flow cytometry, the signal of TIM4 was undetectable in isolated CD14+ cells. Because hypoxia is a conspicuous feature in glioma tissue, we inferred that the hypoxic environment might induce the expression of TIM4 in Mϕs. To test this hypothesis, we cultured isolated CD14+ cells under hypoxia for 48 h. Indeed, the expression of TIM4 was induced in 36.3 ± 12.2% of the CD14+ cells, which could be abolished by pretreatment with anti-HIF1α antibody. In contrast, the expression of TIM4 in CD14+ cells was below detectable levels when cultured under normoxia for 48 h.
To investigate further the molecular mechanism of the expression of TIM4 by CD14+ cells under hypoxia, we analyzed the cell extracts by ChIP. The results showed that culture under hypoxia promoted histone H3 acetylation (Fig. 1D) and TIM4 promoter activation (Fig. 1E) and increased TIM4 mRNA transcription (Fig. 1F), which could be abrogated by pretreatment with anti-HIF1α antibody (Fig. 1, D--F).
Glioma-derived T Cells Express Phosphatidylserine (PS)
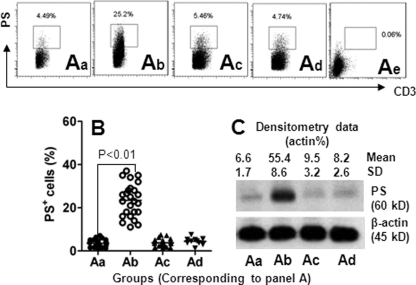
A previous reported indicates that tumor-infiltrating T cells play an important role in tumor survival (19). TIM4 is involved in modulating T cell functions in a number of immune responses, including promoting the phagocytosis of Mϕs (20); but how TIM4 is involved in tumor immunity needs to be further investigated. Previous studies have shown that TIM4 is the receptor of PS (20). We next observed the expression of PS in CD3+ T cells in gliomas. As shown by flow cytometry (Fig. 2), PS was expressed in glioma-derived T cells as well as peripheral T cells from glioma patients and healthy subjects. The frequency of PS+ T cells was markedly higher in glioma-isolated T cells than in cells derived from peripheral blood. However, the frequency of PS+ T cells from peripheral blood was not significantly different between glioma patients and healthy subjects. The results indicate that glioma-derived T cells express significantly more PS compared with peripheral T cells, i.e. the causative factors inducing PS expression in T cells may exist inside glioma tissue.
FIGURE 2.
Expression of PS in T cells is increased in glioma tissue. A, T cells (CD3+ cells) were isolated from marginal normal tissue (panel a; determined by pathologists), glioma tissue (panel b), and the peripheral blood of 25 patients with glioma (panel c), and the peripheral blood of 10 healthy volunteers (panel d). The cells were analyzed by flow cytometry and Western blotting. The dot plots in panels a–d show the frequency of PS+ CD3+ cells (gated cells). Panel e is an isotype control. B, scatter dot plots show individual data points of panels a–d in A. Each dot represents an individual data point. C, representative immunoblots (from 25 experiments) show IFNλ receptor protein levels from isolated T cells in panels a–d in A. Samples from patients were analyzed individually.
Hypoxia Induces T Cells to Express PS
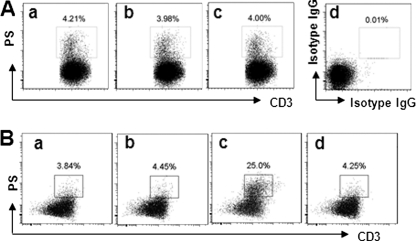
It is of significance to identify the causative factors in the induction of PS in T cells as revealed above. The hypoxic milieu is a conspicuous difference between glioma tissue and peripheral blood (21). Thus, we observed the effect of hypoxia on the expression of PS in human naïve T cells. Peripheral blood T cells were isolated from healthy volunteers and cultured under hypoxia for 48 h. However, the expression of PS was not changed significantly compared with T cells cultured under normoxia (Fig. 3A). Because other peripheral cell types might contribute to the expression of PS in T cells, we then isolated peripheral blood mononuclear cells from healthy volunteers and cultured them under hypoxia for 48 h. As shown by the flow cytometry data, the expression of PS was markedly increased in T cells (Fig. 3B, panel c). It has been reported that HIF1α plays a critical role in hypoxia-induced bioactivities in immune cells (22); it might also play a role in induction of the expression of PS in T cells. We then pretreated T cells with anti-HIF1α antibody, followed by hypoxia treatment. Indeed, the expression of PS in T cells induced by hypoxia was abolished (Fig. 3B, panel d). Because the expression of PS is a sign of apoptosis (18, 20), the results indicate that hypoxia can induce T cell apoptosis in glioma tissue.
FIGURE 3.
Hypoxia induces PS expression in T cells. T cells (A) and peripheral blood mononuclear cells (B) were isolated from the peripheral blood of healthy volunteers, cultured under hypoxia for 48 h, and analyzed by flow cytometry for the frequency of PS-expressing T cells (gated cells). Panels a, freshly prepared naïve T cells; panels b, cells cultured under normoxia; panels c, cells cultured under hypoxia; panel d in A, negative staining control (stained with matched isotype IgG); panel d in B, cells cultured under hypoxia in the presence of anti-HIF1α antibody (500 ng/ml). Data represent three experiments.
Glioma-derived Mϕs Gain Tolerogenic Features after Culturing with T Cells under Hypoxia
To understand further the biological behavior of glioma-derived PS+ CD3+ cells, we observed glioma tissue by immunohistochemistry. The results showed that the signals of CD3 and PS were located inside Mϕs (Fig. 4A); this phenomenon implied that Mϕs phagocytosed the apoptotic T cells, as shown in several other studies on the induction of immune tolerance (23, 24). The finding was confirmed by subsequent in vitro experiments (Fig. 4, B–D): CD14+ Mϕs phagocytosed PS+ CD3+ cells after culture under hypoxia. With Western blotting, we further observed that the Mϕs had the tolerogenic features after phagocytosing apoptotic T cells manifesting high level expression of aldehyde dehydrogenase (an enzyme that catalyzes the synthesis of retinoic acid from retinaldehyde) and TGF-β (Fig. 4E) (25).
FIGURE 4.
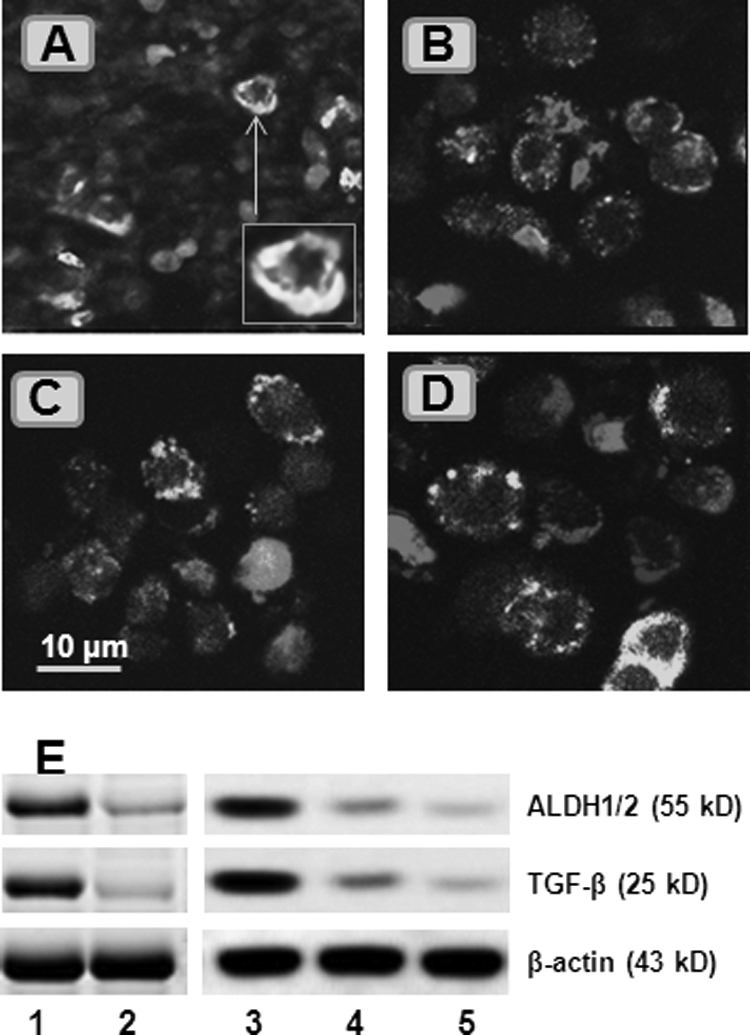
Glioma-derived Mϕs phagocytose apoptotic T cells to become tolerogenic. A, surgically removed glioma tissue was processed for cryosectioning and stained with FITC-conjugated anti-CD14 (1:200) and Cy5-conjugated anti-CD3 (1:100) antibodies and phycoerythrin-conjugated annexin V. The representative confocal image shows CD14-positive staining (in green) and CD3-positive staining (in red). Some CD3+ cells were localized inside CD14+ cells (inset). B–D, CD14+ and CD3+ cells were isolated from peripheral blood mononuclear cells, cultured under hypoxia (B and C) or normoxia (D) for 48 h, and processed for staining with the reagents used in A. The representative confocal images show that some CD14+ cells phagocytosed apoptotic CD3+ cells (labeled with asterisks). E, total proteins were extracted from CD14+ cells (isolated from glioma tissue or peripheral blood) in the glioma group (lane 1), non-glioma group (lane 2), cells in B (lane 3), cells in C (lane 4), and cells in D (lane 5). The immunoblots show the levels of aldehyde dehydrogenase-1/2 (ALDH1/2) and TGF-β. Data represent five experiments. The image original magnification was ×630.
Generation of Tregs by Glioma-derived Mϕs
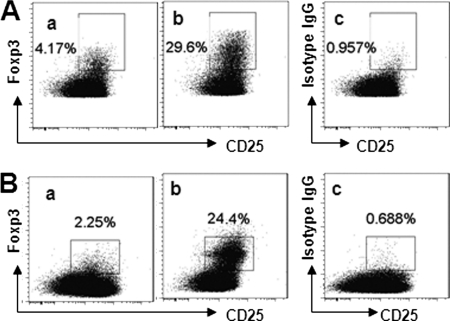
Because the glioma-derived Mϕs express aldehyde dehydrogenase and TGF-β (Fig. 4), which implies that glioma-infiltrating Mϕs might have the ability to induce Foxp3+ Tregs (25), we further examined the frequency of CD4+CD25+Foxp3+ Tregs in glioma-derived CD4+ T cells. As shown by flow cytometry, ∼30% CD4+CD25+Foxp3+ Tregs were detected in glioma-isolated CD4+ T cells, which was markedly less in control tissue (Fig. 5A). To confirm that the Tregs shown in Fig. 5A were induced by the Mϕs in glioma tissue, we isolated Mϕs from glioma tissue and co-cultured them with naïve peripheral CD4+CD25− T cells. The results showed that >20% of the CD4+CD25− T cells were converted to CD4+CD25+Foxp3+ Tregs (Fig. 5B).
FIGURE 5.
Foxp3+ Tregs in glioma tissue. A, CD3+ T cells were isolated from the glioma tissue of 25 patients as described in the legend to Fig. 1 and stained with antibodies against Foxp3 and CD4. The dot plots show the frequency of Tregs from normal control tissue (panel a) and glioma tissue (panel b). Panel c is a negative control (stained with matched isotype IgG). B, CD4+CD25− T cells were isolated from six healthy volunteers and co-cultured with glioma-derived Mϕs (panel a) or peripheral CD14+CD11b+ cells from healthy volunteers (panel b) (T cell/Mϕ = 10:1) in the presence of IL-2 for 4 days. The dot plots show the frequency of CD4+CD25+Foxp3+ Tregs. Panel c is a negative control that was stained with anti-CD25 antibody and isotype IgG (matched with the anti-Foxp3 antibody). Data represent six separate experiments.
Tregs Generated in Vitro Suppress Tumor-specific CD8+ T Cells
We next investigated whether the glioma-derived Tregs could suppress tumor-specific CD8+ T cells. CD8+ T cells were isolated from peripheral blood (collected from the surgical operative field) and cultured in the presence of DCs and glioma tissue-extracted protein (containing the tumor-specific antigens) for 96 h. As shown by carboxyfluorescein succinimidyl ester dilution assay, the exposure to tumor protein induced the tumor-specific CD8+ T cells to proliferate significantly as well as to secrete granzyme B (Fig. 6). CD8+ T cell activation was inhibited by the presence of Tregs isolated from healthy subjects as well as the generated Tregs.
FIGURE 6.
Glioma-derived Tregs suppress tumor-specific CD8+ T cells. CD4+CD25high Tregs were sorted out from glioma-derived CD4+ T cells using the FACSVantage system and the generated Tregs. CD8+ T cells were isolated from blood collected from the surgical operative field of the patients with glioma and were labeled with carboxyfluorescein succinimidyl ester in the presence of DCs and glioma-extracted proteins (1 μg/ml; containing the tumor antigens using to activate tumor-specific Tregs and tumor-specific CD8+ T cells) (A). Two other groups of cells were also cultured with glioma-derived Tregs (B) or generated Tregs (C) (CD8+ T cell/Treg/DC = 105:105:104/well). Cells were collected 4 days later and analyzed by flow cytometry. A–C, histograms show CD8+ T cell proliferation. D, CD8+ T cells were cultured with DCs and BSA. E, scatter dot plots show the levels of granzyme B in the culture medium. Each dot represents a single data point. Data represent six experiments.
DISCUSSION
This study provides novel information on glioma immune tolerance that includes the following. Glioma-derived Mϕs express TIM4. Glioma-derived T cells express PS, which can be induced under hypoxia. The interaction of TIM4 and PS induces Mϕs to phagocytose the PS+ T cells to gain the tolerogenic properties, which can induce the development of the tumor-specific Tregs; the latter suppress tumor-specific CD8+ T cells upon activation.
TIM4 is expressed mainly by antigen-presenting cells such as DCs (13, 26). Our data indicate that Mϕs also express TIM4 in gliomas. Because Mϕs are a subset of antigen-presenting cells, our data are in agreement with those pioneer studies. The previous data indicate that activation of DCs by microbial stimulation is a causative factor for induction of TIM4 expression. In addition to these reports, our data further confirm that hypoxia is another causative factor for induction of TIM4 expression in Mϕs.
HIF1α is a transcription factor, and its expression can be up-regulated upon hypoxia. HIF1α is the key transcription factor regulating the expression of hypoxia-induced genes; it is critical for a number of tumor cell functions such as tumor cell survival and clonal selection to metastasis (27). Our data show that the expression of TIM4 by Mϕs can be up-regulated under hypoxia; the increase in TIM4 can be abrogated by pretreatment with anti-HIF1α antibody. The data indicate that the expression of HIF1α is critical for the expression of TIM4 by Mϕs under hypoxia. Overexpression of TIM4 is involved in some immune disorders such as intestinal skewed Th2 inflammation (13) and autoimmune disorders (28). Whether regulation of TIM4 expression can ameliorate these immune disorders is worth further investigation.
The tumor tolerance mechanism plays a critical role in tumor cell survival and growth. It protects tumor cells from attack by the body's immune system. Thus, to understand the mechanism of tumor tolerance may be beneficial to the treatment of tumors. In this study, we have demonstrated a novel mechanism by which TIM4-expressing Mϕs phagocytose apoptotic T cells in glioma tissue to gain the tolerogenic properties and to facilitate further the generation of Tregs in glioma. Because Tregs are the most important component of immune tolerance, the TIM4-expressing Mϕs contribute directly to the establishment of tumor tolerance.
Tumor-infiltrating Tregs play an important role in tumor pathogenesis by suppressing tumor antigen-specific cytotoxic CD8+ T cells (29). In line with this established concept, we also observed increases in Tregs in glioma tissue; the glioma-derived Tregs have the ability to suppress glioma-specific CD8+ T cells. Although the function of tumor-infiltrating Tregs has been well described as suppressing effector T cell function (29), the source of tumor-infiltrating Tregs is not yet fully understood. Our data show that glioma-derived Mϕs phagocytose apoptotic T cells and become tolerogenic. The finding implies that the glioma-derived tolerogenic Mϕs have the ability to induce Tregs. This postulation is supported by subsequent data that glioma-derived tolerogenic Mϕs induce Tregs in a TIM4/HIF1α-dependent manner. The finding further emphasizes the importance of glioma-derived Mϕs and TIM4 in glioma pathogenesis by strengthening tumor tolerance.
In summary, in this study, we have demonstrated that the Mϕs in glioma tissue express high levels of TIM4. TIM4-expressing Mϕs phagocytose apoptotic T cells in glioma and gain the immune tolerogenic properties, further facilitating the development of Tregs. Activation of glioma-isolated Tregs can suppress tumor-specific CD8+ T cell function and proliferation.
The work was supported by National Natural Science Foundation of China Grant 30872649/C1608.
- Treg
- regulatory T cell
- HIF
- hypoxia-inducible factor
- Mϕ
- macrophage
- DC
- dendritic cell
- PS
- phosphatidylserine.
REFERENCES
- 1. Fecci P. E., Sweeney A. E., Grossi P. M., Nair S. K., Learn C. A., Mitchell D. A., Cui X., Cummings T. J., Bigner D. D., Gilboa E., Sampson J. H. (2006) Clin. Cancer Res. 12, 4294–4305 [DOI] [PubMed] [Google Scholar]
- 2. Flavell R. A., Sanjabi S., Wrzesinski S. H., Licona-Limón P. (2010) Nat. Rev. Immunol. 10, 554–567 [DOI] [PMC free article] [PubMed] [Google Scholar]
- 3. Wen P. Y., Kesari S. (2008) N. Engl. J. Med. 359, 492–507 [DOI] [PubMed] [Google Scholar]
- 4. Stupp R., Mason W. P., van den Bent M. J., Weller M., Fisher B., Taphoorn M. J., Belanger K., Brandes A. A., Marosi C., Bogdahn U., Curschmann J., Janzer R. C., Ludwin S. K., Gorlia T., Allgeier A., Lacombe D., Cairncross J. G., Eisenhauer E., Mirimanoff R. O. (2005) N. Engl. J. Med. 352, 987–996 [DOI] [PubMed] [Google Scholar]
- 5. Katz J. B., Muller A. J., Prendergast G. C. (2008) Immunol. Rev. 222, 206–221 [DOI] [PubMed] [Google Scholar]
- 6. Sorensen A. G., Batchelor T. T., Wen P. Y., Zhang W. T., Jain R. K. (2008) Nat. Clin. Pract. Oncol. 5, 634–644 [DOI] [PMC free article] [PubMed] [Google Scholar]
- 7. Murdoch C., Muthana M., Lewis C. E. (2005) J. Immunol. 175, 6257–6263 [DOI] [PubMed] [Google Scholar]
- 8. Yang S., Wang B., Guan C., Wu B., Cai C., Wang M., Zhang B., Liu T., Yang P. (2011) J. Leukocyte Biol. 89, 85–91 [DOI] [PubMed] [Google Scholar]
- 9. Wei J., Barr J., Kong L. Y., Wang Y., Wu A., Sharma A. K., Gumin J., Henry V., Colman H., Priebe W., Sawaya R., Lang F. F., Heimberger A. B. (2010) Mol. Cancer Ther. 9, 67–78 [DOI] [PMC free article] [PubMed] [Google Scholar]
- 10. Kren L., Muckova K., Lzicarova E., Sova M., Vybihal V., Svoboda T., Fadrus P., Smrcka M., Slaby O., Lakomy R., Vanhara P., Krenova Z., Michalek J. (2010) J. Neuroimmunol. 220, 131–135 [DOI] [PubMed] [Google Scholar]
- 11. Douglass T. G., Driggers L., Zhang J. G., Hoa N., Delgado C., Williams C. C., Dan Q., Sanchez R., Jeffes E. W., Wepsic H. T., Myers M. P., Koths K., Jadus M. R. (2008) Int. Immunopharmacol. 8, 1354–1376 [DOI] [PubMed] [Google Scholar]
- 12. Hussain S. F., Yang D., Suki D., Aldape K., Grimm E., Heimberger A. B. (2006) Neuro-Oncology 8, 261–279 [DOI] [PMC free article] [PubMed] [Google Scholar]
- 13. Yang P. C., Xing Z., Berin C. M., Soderholm J. D., Feng B. S., Wu L., Yeh C. (2007) Gastroenterology 133, 1522–1533 [DOI] [PubMed] [Google Scholar]
- 14. Meyers J. H., Chakravarti S., Schlesinger D., Illes Z., Waldner H., Umetsu S. E., Kenny J., Zheng X. X., Umetsu D. T., DeKruyff R. H., Strom T. B., Kuchroo V. K. (2005) Nat. Immunol. 6, 455–464 [DOI] [PubMed] [Google Scholar]
- 15. Kobayashi N., Karisola P., Peña-Cruz V., Dorfman D. M., Jinushi M., Umetsu S. E., Butte M. J., Nagumo H., Chernova I., Zhu B., Sharpe A. H., Ito S., Dranoff G., Kaplan G. G., Casasnovas J. M., Umetsu D. T., DeKruyff R. H., Freeman G. J. (2007) Immunity 27, 927–940 [DOI] [PMC free article] [PubMed] [Google Scholar]
- 16. Dorfman D. M., Hornick J. L., Shahsafaei A., Freeman G. J. (2010) Hum. Pathol. 41, 1486–1494 [DOI] [PMC free article] [PubMed] [Google Scholar]
- 17. Hartmann C., Hentschel B., Wick W., Capper D., Felsberg J., Simon M., Westphal M., Schackert G., Meyermann R., Pietsch T., Reifenberger G., Weller M., Loeffler M., von Deimling A. (2010) Acta Neuropathol. 120, 707–718 [DOI] [PubMed] [Google Scholar]
- 18. Miyanishi M., Tada K., Koike M., Uchiyama Y., Kitamura T., Nagata S. (2007) Nature 450, 435–439 [DOI] [PubMed] [Google Scholar]
- 19. Piersma S. J., Welters M. J., van der Burg S. H. (2008) Hum. Immunol. 69, 241–249 [DOI] [PubMed] [Google Scholar]
- 20. Freeman G. J., Casasnovas J. M., Umetsu D. T., DeKruyff R. H. (2010) Immunol. Rev. 235, 172–189 [DOI] [PMC free article] [PubMed] [Google Scholar]
- 21. Allen M., Louise Jones J. (2011) J. Pathol. 223, 163–177 [DOI] [PubMed] [Google Scholar]
- 22. Jokilehto T., Jaakkola P. M. (2010) J. Cell. Mol. Med. 14, 758–770 [DOI] [PMC free article] [PubMed] [Google Scholar]
- 23. Perruche S., Zhang P., Liu Y., Saas P., Bluestone J. A., Chen W. (2008) Nat. Med. 14, 528–535 [DOI] [PubMed] [Google Scholar]
- 24. He S. H., Chen X., Song C. H., Liu Z. Q., Zhou L. F., Ma W. J., Zhao L. D., Li T. L., Tang S. G., Xing Z., Yang P. C. (2011) Gastroenterology 141, 249–258 [DOI] [PubMed] [Google Scholar]
- 25. Coombes J. L., Siddiqui K. R., Arancibia-Cárcamo C. V., Hall J., Sun C. M., Belkaid Y., Powrie F. (2007) J. Exp. Med. 204, 1757–1764 [DOI] [PMC free article] [PubMed] [Google Scholar]
- 26. Rodriguez-Manzanet R., Meyers J. H., Balasubramanian S., Slavik J., Kassam N., Dardalhon V., Greenfield E. A., Anderson A. C., Sobel R. A., Hafler D. A., Strom T. B., Kuchroo V. K. (2008) J. Immunol. 180, 4706–4713 [DOI] [PMC free article] [PubMed] [Google Scholar]
- 27. Semenza G. L. (2003) Nat. Rev. Cancer 3, 721–732 [DOI] [PubMed] [Google Scholar]
- 28. Zhao P., Xu L., Wang P., Liang X., Qi J., Liu P., Guo C., Zhang L., Ma C., Gao L. (2010) Cell. Mol. Immunol. 7, 152–156 [DOI] [PMC free article] [PubMed] [Google Scholar]
- 29. Yang L., Pang Y., Moses H. L. (2010) Trends Immunol. 31, 220–227 [DOI] [PMC free article] [PubMed] [Google Scholar]


