Abstract
This protocol describes how biological samples, like brain tissue, can be imaged in three dimensions using the focussed ion beam/scanning electron microscope (FIB/SEM). The samples are fixed with aldehydes, heavy metal stained using osmium tetroxide and uranyl acetate. They are then dehydrated with alcohol and infiltrated with resin, which is then hardened. Using a light microscope and ultramicrotome with glass knives, a small block containing the region interest close to the surface is made. The block is then placed inside the FIB/SEM, and the ion beam used to roughly mill a vertical face along one side of the block, close to this region. Using backscattered electrons to image the underlying structures, a smaller face is then milled with a finer ion beam and the surface scrutinised more closely to determine the exact area of the face to be imaged and milled. The parameters of the microscope are then set so that the face is repeatedly milled and imaged so that serial images are collected through a volume of the block. The image stack will typically contain isotropic voxels with dimenions as small a 4 nm in each direction. This image quality in any imaging plane enables the user to analyse cell ultrastructure at any viewing angle within the image stack.
Keywords: Neuroscience, Issue 53, Focussed ion beam, scanning electron microscopy, FIB
Protocol
1. Sample fixation and resin embedding
Samples of fresh tissue and cells are fixed for at least 2 hours in 2% paraformaldehyde, and 2.5% glutaraldehyde in 0.1 M phosphate buffer at a pH of 7.4. The sample size should not exceed 0.150 mm in thickness to allow adequate penetration or fixative, and should not be left in the fix for longer than 12 hours.
Place the samples in 20ml glass scintillation vials and rinse them three times, 5 minutes each, in 0.1M cacodylate buffer.
Stain with 1.5 % (w/v) potassium ferrocyanide and 1% (w/v) osmium tetroxide in 0.1 M cacodylate buffer (0.1 M, pH 7.4) for 30 minutes.
Stain with 1.0 % (w/v) osmium tetroxide in 0.1M cacodylate buffer for 30 minutes.
Rinse once with double distilled water for 3 minutes.
Stain with 1 % (w/v) uranyl acetate in double distilled water for 30 minutes.
Rinse sections for 5 minutes in double distilled water, and then dehydrate in graded alcohol series, 2 mins each change (1 x 50 %, 1 x 70 %, 1 x 90 %, 1 x 95 %, 2 x 100 %).
Embed in increasing concentrations of Durcupan resin mixed with ethanol, 30 minutes each change, starting at 50% Durcupan in ethanol, then followed by: 70%, 90%, 95%, and then 100%.
Replace with fresh Durcupan and agitate slowly for 4 hours.
Place sections, using wooden cocktail sticks, on glass microscopes slides coated with mould separating agent, and place in 65° C oven for 24 hours.
2. Preparing the sample for the FIB/SEM
Separate the resin layer, containing the samples, from between the two glass microscope slides and wash thoroughly to remove any mould separating agent.
Using a transmitted light microscope with low power objectives, or dissecting microscope with transmitted illumination, to identify the region of interest within the slice of resin.
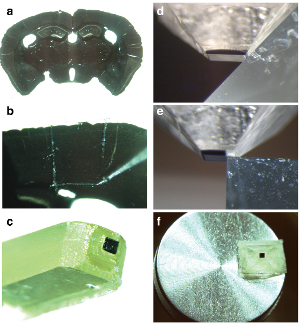
Cut a small (3 mm x 3 mm) square around the region of interest using a razor blade and stick this to the top of blank resin block with acrylic glue (Figure 1). Wait 5 minutes for the glue to harden, and then proceed with the next step.
Clamp the block into the holder of the ulramicrotome and, using the attached stereomicroscope, trim around the region of interest with a razor blade until only a small pyramid of material remains.
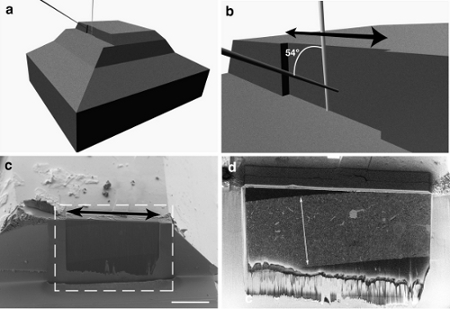
Further trim the block, using a glass knife fixed into the ultramicrotome, so that the region of interest can be precisely located with respect the dimensions of the block’s surface (Figure 1). Cut one edge of the block, close to the region of interest, so that a perpendicular step is cut through the sample (Figure 1 and 2). This step forms the imaging face (Figure 2).
Remove the block from the ultramicrotome and photograph the region of interest within the block, using a transmitted light microscope.
Cut the trimmed block away from the remaining resin stub. This is done by using a jeweller’s saw and ensures that only a small block is placed inside the FIB/SEM. The total height of this block should not be more than 5 mm.
Glue the block to an aluminium stub with carbon paste ensuring that the side to be imaged is on the outermost edge (Figure 1).
After the glue has dried, coat the block with a thin layer of gold (> 20 nm; Cressington vacuum evaporation system).
3. Imaging in the FIB/SEM
At a low magnification, and using secondary electron imaging ( 5 kV, 0.5 nAmp), orient the block so that the chosen region of interest and the side of the block to be imaged is facing the operator (Figure 2 c, d).
Orient the block so that the face to be imaged lies parallel to the milling beam. This will mean that electron beam is oriented at 54 ° to this face (Figure 2 b).
Using an ion beam current of 13 - 27 nAmps at 30 kV remove a narrow band of resin from the front of the region to be imaged.
Switch to backscattered imaging mode to view the milled face that overlies the region of interest.
Using the light microscopy reference image (taken at step 16) and the image of the milled face locate the exact region on the block to be milled and imaged (Figure 2).
Deposit a protective layer (approximately 1 micron thick) of carbon (or metal), using the gas injection system of the microscope, onto the surface of the block, above the region of interest (Figure 2).
Using a current of 700 picoAmps, finely mill the region of the block within which the final images will be taken.
Leave the milling beam to completely mill this image face until no milling artifacts can be seen on the face. A complete mill of the face is checked by observing changes in each subsequent image across the entire field of view. Inadequate milling can also seen as white streaks or ‘curtains’ appearing vertically in the image.
Leave the microscope for a least 2 hours for any thermal changes to dissipate. This reduces the risk that the block face will drift during imaging, resulting in misaligned images.
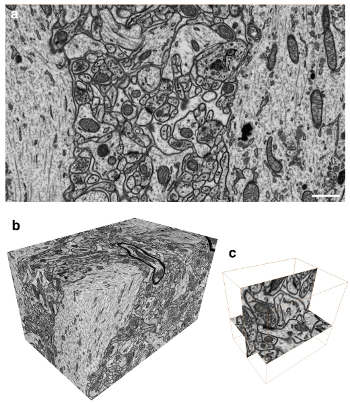
Select the microscope parameters for imaging the face serially. Ensure that the electron beam has a voltage that is low enough to only image a very shallow depth of material in the block face. This should also be much shallower than the thickness of the face to be removed. Typical parameters for imaging are voltages of between 1.2 - 2.0 kV with pixel sizes of between 4 - 20 nm. The pixel dwell time needs to be kept around 10 μsecs so that the total time to mill the face and acquire one image is maintained below 2 minutes (Figure 3).
4. Secrets to success
Step 1) Ensure the samples are not thicker than 150 microns. This will enable adequate penetration of the different stains and resin into the material. This can be achieved by sectioning the samples with a vibratome immediately after the fixation. This thickness is appropriate for brain tissue. Other tissues need to be tested to ensure adequate fixation and staining.
Step 3) The samples must be freely distributed throughout the solution, and not clumped together in one part of the vial while this secondary fixative is introduced. This will ensure maximum penetration of the sample and reduce the sample becoming distorted during this fixation process. This is achieved by gently swirling the samples within the vial immediately after the solution is added.
Step 15) Ensure that the region of interest is located immediately below (< 30 microns) the surface of the block. This will reduce the amount of milling by the ion beam during the image acquisition phase.
Step 22) The scanning time of the ion beam needs to be adequte to ensure that the entire imaging face is completely milled. Inadequate milling will be shown as white streaks, or ‘curtains’ appearing vertically down the imaging face.
Step 26) The final milled face must be larger than the face that is imaged. This is because the milled resin is ejected from the block and redeposits on the block surface in the immediate vicinity. This redeposition can encroach onto the imaging field of view, and is avoided by milling a much large area than is imaged. For an imaging window that is 20 microns wide, the milled block face is greater than 30 microns wide.
Step 29) It is critical that the electron beam parameters are such that the image is generated by electrons that emerge from only the first few nanometres of the block’s surface. This a acheved by minimising the voltage to below 2 kV and ensuring that no electrons penetrate too far. This is also helped by using a grid voltage on the detector so that only the electron with the highest energies contribute to the final image. Typically, a grid tension of 1.3 kV is used for an imaging voltage of 1.5 kV.
5. Representative Results:
 Figure 1. Preparation of resin block. a) Resin embedded coronal section (80 microns thick) through an adult rat brain viewed in a steromicroscope. The image clearly shows the different brain regions that can be cut from the section (b) using a scalpel blade. Here, a 1 mm square from the cortex is removed and (c) stuck to a blank resin block. d) The resin block is then trimmed with a glass knife mounted in an ultramicrotome, and once the block has been reduced to only leave the region of interest (e), a step is cut perpendicular to the front surface of the embedded material. f) This entire trimmed region is then cut from the rest of the resin and mounted onto a aluminium stub ready for metal coating and imaging in the scanning electron microscope.
 Figure 2. Preparing the block face for FIB/SEM imaging. a) and b) show illustrations of the block and the edge that is milled to create the imaging face (indicated with the black double-headed arrow). The position of the ion beam (white) is shown parallel to the imaging face, and the electron beam (grey) is shown hitting the face at 54° to the ion beam. c) shows a view of the block taken with the electron beam and imaged with the secondary electrons. Along this side of the block a darker region (indicated with dotted white box) shows a portion of the face that has been roughly milled (shown with double-headed black arrow) to reveal the underlying sample. d) When this region is imaged using only the backscattered electrons the embedded tissue can be seen. Here, the full width of the embedded tissue section is indicated with a double headed white arrow. Scale bar in c) is 100 microns.
 Figure 3. Imaging the a volume of brain tissue with isotropic voxels. a) Reversed contrast backscattered image of the block face showing the ultrastructure within a region of the rat brain. All membranes are visible as well as large macromolecular structures. b) A total of 1600 images were collected at 5 nm spacing resulting in an image stack with isotropic voxels. c) This stack can be imaged in any plane with the same resolution. This image shows single synaptic connection that is imaged in the x y plane and the y z plane.
Discussion
The technique of FIB/SEM works optimally when the region of interest is not too large. The upper limit for an imaged volume depends on the ion beam and the area that it can consistently mill repeatedly over many hours. So far this has been done with areas of around 60 x 60 microns, however, imaging this entire area is not possible with a suitable image resolution, mainly due to the time factor in collecting such a large image. As an example, a 4 k x 4 k image with a pixel dwell time to 10 microseconds would take 2 minutes and 40 seconds to acquire, and for a field of view of 60 microns this would only give a pixel size of 15 nm. For imaging the ultrastructure of cells and tissue, a smaller pixel size is more suitable; usually between 4 and 10 nm / pixel. For an area of 60 x 60 microns the image would be acquired in 10 hours, even if the microscope had this capability. For these reasons, the microscope is an ideal tool for image volumes in the order of 10 x 10 x 10 microns, or significant regions of whole cells. This can easily be done within a 48 hour period on samples that are well-contrasted with this procedure.
So far the protocol has been used mainly with brain tissue, as well as various types of cultured mammalian cells adhering to coverslips. However, the fixation and staining procedure can be used with many other types of biological material, including plant material to produce equally well-contrasted image stacks.
Therefore the main advantage of this technique is its capacity to image volumes with isotropic voxels. Image stacks of this type allow for analyses of the 3d volume using images taken at any plane in the stack. The benefit of this is to allow the observer to image features in the image series from any direction and providing a greater image detail (Figure 3).
Disclosures
No conflicts of interest declared.
References
- Knott G, Marchman H, Wall D, Lich B. Serial section scanning electron microscopy of adult brain tissue using focused ion beam milling. J Neurosci. 2008;28:2959–2964. doi: 10.1523/JNEUROSCI.3189-07.2008. [DOI] [PMC free article] [PubMed] [Google Scholar]
- Hekking LH, Lebbink MN, De Winter DA, Schneijdenberg CT. Focused ion beam-scanning electron microscope: exploring large volumes of atherosclerotic tissue. J Microsc. 2009;235:336–347. doi: 10.1111/j.1365-2818.2009.03274.x. [DOI] [PubMed] [Google Scholar]
- Armer HE, Mariggi G, Png KM, Genoud C. Imaging transient blood vessel fusion events in zebrafish by correlative volume electron microscopy. PLoS One. 2009;4:e7716–e7716. doi: 10.1371/journal.pone.0007716. [DOI] [PMC free article] [PubMed] [Google Scholar]


