Abstract
OHCs are cylindrical sensorimotor cells located in the Organ of Corti, the auditory organ inside the mammalian inner ear. The name "hair cells" derives from their characteristic apical bundle of stereocilia, a critical element for detection and transduction of sound energy 1. OHCs are able to change shape —elongate, shorten and bend— in response to electrical, mechanical and chemical stimulation, a motor response considered crucial for cochlear amplification of acoustic signals 2.
OHC stimulation induces two different motile responses: i) electromotility, a.k.a fast motility, changes in length in the microsecond range derived from electrically-driven conformational changes in motor proteins densely packed in OHC plasma membrane, and ii) slow motility, shape changes in the millisecond to seconds range involving cytoskeletal reorganization 2, 3. OHC bending is associated with electromotility, and result either from an asymmetric distribution of motor proteins in the lateral plasma membrane, or asymmetric electrical stimulation of those motor proteins (e.g., with an electrical field perpendicular to the long axis of the cells) 4. Mechanical and chemical stimuli induce essentially slow motile responses, even though changes in the ionic conditions of the cells and/or their environment can also stimulate the plasma membrane-embedded motor proteins 5, 6. Since OHC motile responses are an essential component of the cochlear amplifier, the qualitative and quantitative analysis of these motile responses at acoustic frequencies (roughly from 20 Hz to 20 kHz in humans) is a very important matter in the field of hearing research 7.
The development of new imaging technology combining high-speed videocameras, LED-based illumination systems, and sophisticated image analysis software now provides the ability to perform reliable qualitative and quantitative studies of the motile response of isolated OHCs to an external alternating electrical field (EAEF) 8. This is a simple and non-invasive technique that circumvents most of the limitations of previous approaches 9-11. Moreover, the LED-based illumination system provides extreme brightness with insignificant thermal effects on the samples and, because of the use of video microscopy, optical resolution is at least 10-fold higher than with conventional light microscopy techniques 12. For instance, with the experimental setup described here, changes in cell length of about 20 nm can be routinely and reliably detected at frequencies of 10 kHz, and this resolution can be further improved at lower frequencies.
We are confident that this experimental approach will help to extend our understanding of the cellular and molecular mechanisms underlying OHC motility.
Protocol
1. Isolation of OHCs
Begin this procedure by harvesting temporal bones from guinea pigs, mice or your mammalian animal model.
Next, open the temporal bones using a malleus nipper in order to expose the cochlea, and immerse them in Leibovitz L-15. Remove bone excess carefully, keeping the bony shell intact. Whereas this is a general procedure applicable to temporal bones of any mammalian species, minor changes to the technique may be necessary when dealing with temporal bones from very small animals. In old animals the bulla is usually calcified, introducing an additional complication to the procedure.
Under microscopical observation, open the apical region of the cochlea and remove stria vascularis and spiral ligament using the tip of a #11 scalpel blade, a micro point pick and a fine tweezer.
Take the Organ of Corti off from the cochlear modiolus using the tweezer, and put it in 1mg/ml collagenase in L-15 at room temperature for 5 min.
If OHCs from basal turns of the cochlea are needed, remove the bony shell covering the base of the cochlea with the pick, and separate the spiral from the temporal bone using the scalpel blade before removing the Organ of Corti.
Transfer the Organ of Corti to the recording chamber using a 50 μL Hamilton syringe. Afterward, dissociate cells by reflux through the needle.
2. Experimental Setup
Diagram of the External Alternating Electrical Field (EAEF) generator and their links with the image capture system (Fig. 1). The control circuitry was specially implemented at the Engineering Core of the House Ear Institute.
The experimental setup used in our experiments consists of an Axiovert 135TV inverted microscope (Zeiss, Thornwood, NY) with an alternative LED-based illumination system (High Power LED System-36AD3500, Lightspeed Technologies, Campbell, CA), two electronic micromanipulators (Eppendorf "Patchman", Germany), a PC-controlled ultra-high speed Photron Fastcam X 1024 PCI camera (Photron USA Inc.) in the Keller port and an additional regular CCD camera in the trinocular port. The Fastcam camera is able to capture images at high frequencies (up to 100,000 fps) and high resolution (e.g., 1024 x 1024 pixels at 1,000 fps, 512 x 128 at 10,000 fps, 384 x 96 at 18,000 fps, and so on). The images provided by the high-speed camera are directly observed in the PC monitor, whereas the CCD camera is connected to a different monitor. The LED-based illumination system works in two different modes: low-power analog and high-power digital. All the preliminary procedures (electrodes positioning, cell positioning, focus, etc) are performed using the low-power analog mode. The high-power illumination is switched on by the aperture of the camera shutter and then switched off by shutter closing, facilitating heat dissipation. Homemade software, also developed at the House Ear Institute Engineering Core, running on the same PC controls the trigger of the high-speed camera, the LED-based illumination system, and the EAEF. A conventional digital photo camera in the front port allows for still frames as needed. (Fig. 2 A).
Electrodes (two 0.25 mm-diameter Ag wires with tip distance of 0.8 mm) are driven to position using one of the electronic micromanipulators. Electrodes' position is monitored visually and through the microscopic image; a change in the focal plane of the image indicates that the electrodes touched the bottom of the experimental chamber. Initially, the electrical field is calibrated using an external electrode. This electrode measures the electric potential at different points, generating a "map" of the electrical field. If a single isolated outer hair cell is placed between the tips of the electrodes with its longitudinal axis parallel to the applied EAEF, it will move elongating and shortening at the same frequency of the electric field. If the cell is placed perpendicular to the field a different type of OHC response (bending) can be observed and investigated. (Fig. 2 B)
3. EAEF stimulation and image capture
- Four different stimulation protocols are selectable (Fig. 3):
- continuous single frequency (Fig. 3 A). Note that stimulus mode, frequency, amplitude and wave type can be selected using the home-made control software (red circles).
- bursted single frequency (Fig. 3 B). The length of the bursts and gaps between burst are also selectable.
- linear sweep (Fig. 3 C). The initial and final frequencies are selectable.
- multi-stimulation (Fig. 3 D). Single frequency and linear sweeps can be combined in a single experiment. After selecting the corresponding parameters, the control software configures the system and allows the operator to initiate light-synchronized video recording and cell stimulation by clicking a single button in the computer screen.
Images are captured in AVI format for further analysis at high frequencies.
4. Representative Results
In this movie, two isolated outer hair cells show changes in the length or curvature when they are being stimulated with an External Alternating Electrical Field that is parallel or transversal, respectively, to their longitudinal axis. (Movie #2).
OHCs motile responses are analyzed off-line using ProAnalyst software (Xcitex Inc., Cambridge, MA). "Feature Tracking" function in this software provides the distance between two points frame-by-frame (Fig. 4). During cell shortening the distance between points selected at the apex (Cuticular plate; red color) and the base of the cell (Basal pole; green color) is smaller, and increases with cell elongation. The movie shows the software analyzing frame-by-frame the changes in length. The panel at the bottom of the image shows the trace of the movement. In this example, the total change in length is about 6.5 pixels.
"Contour Tracking" function in ProAnalyst software can detect cell edge and automatically measure the area of the optical section (Fig. 5).
Polystyrene microspheres added to the bath solution randomly and firmly attach to the plasma membrane (Fig. 6 A). Different microspheres can be selected simultaneously, and the software can automatically track all of them frame by frame. In this way, the cells can be divided in sections and the motility of each section evaluated independently. (Fig. 6 A)
By selecting microspheres located on the lateral edges of the cell image, changes in length of each segment and changes in angle of one segment respect to other (bending) can also be independently evaluated. (Fig. 6B)
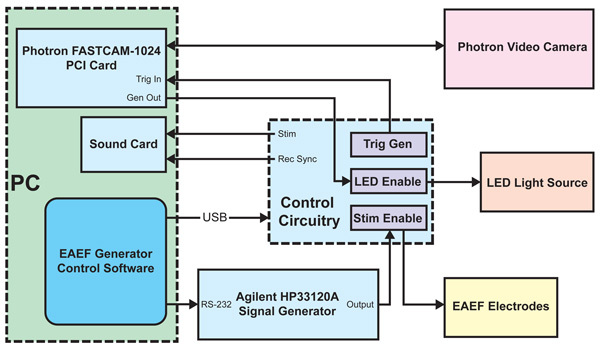 Figure 1. Diagram of the EAEF generator and their links with the image capture system.
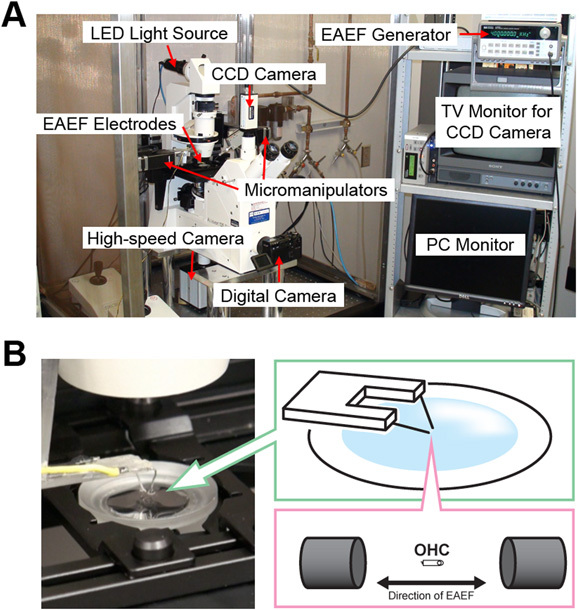 Figure 2. A) Picture of the experimental setup. B) Detail of the microscope stage, with cartoons depicting the electrodes and a single OHC placed between them with its longitudinal axis parallel to the electrical field.
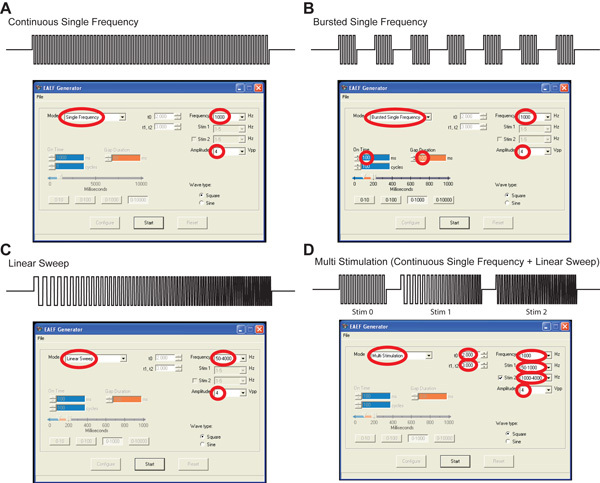 Figure 3. A) User interface of the homemade control software configured for single-frequency stimulation. The selected parameters are circled in red. B) User interface of the home-made control software configured for burst single-frequency stimulation. C) User interface of the home-made control software configured for Linear sweep stimulation. D) User interface of the homemade control software configured for multi-stimulation.
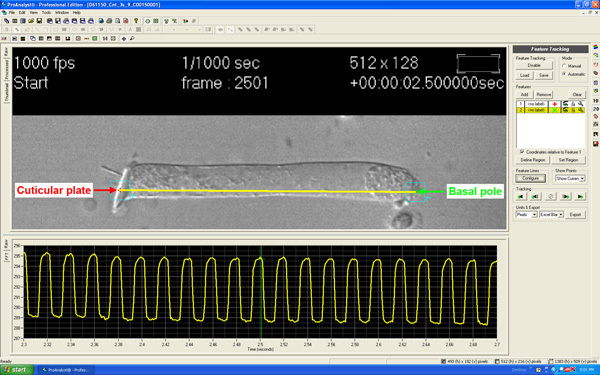 Figure 4. Single frame of an OHC with two points selected at the base (green) and the apex (red) of the cell, respectively, using the "Feature tracking" function of the ProAnalyst software. The curve below the cell shows the periodic changes in distance between the selected points associated with electrical stimulation. Moving the vertical bar different frames can be selected for individual analysis.
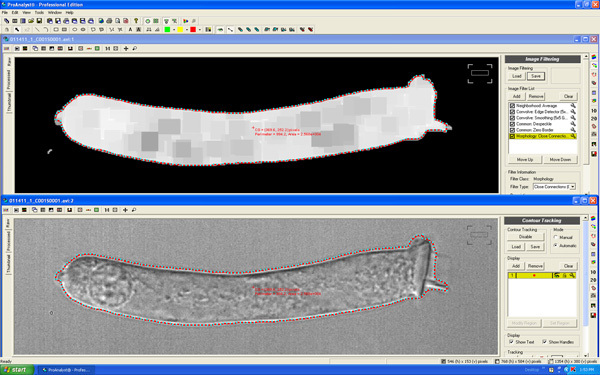 Figure 5. The "Contour Tracking" function in ProAnalyst detects the cell edge and automatically measure the area of the optical section.
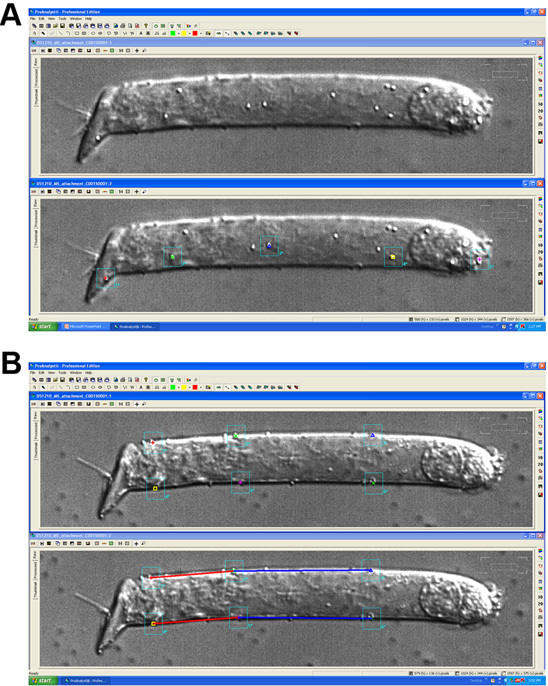 Figure 6. A) Captured image of an isolated OHC decorated with polystyrene microspheres (top), and the same image with five microspheres individually selected (bottom). A different color was assigned to each microsphere, and their displacements can be individually and automatically tracked frame by frame, analyzed and compared. B) Segments of arbitrary length can be defined by selecting polystyrene microspheres located on the edges of the cell, and changes in length of these segments as well as changes in orientation of one segment respect to others (cell bending) can be automatically evaluated frame by frame with the image analysis software.
Movie 1. Isolation of guinea pig OHCs. Click here to watch video
Movie 2. OHCs parallel and perpendicular to the EAEF showing typical electromotility and bending responses. Click here to watch video
Discussion
The experimental method presented here enables estimating OHC motile responses in the kHz range without any restriction to the cell's movement. Different stimulation protocols, additional markers (microspheres), as well changes in the orientation of the cell with respect to the electric field, make it possible to investigate new aspects of OHC motility with a level of detail previously inaccessible. Other methods, e.g. those using photodiodes 9 or laser Doppler vibrometry 10, require a tight control of the position of the cell. Here, in contrast, all the measurements are performed between points belonging to the same cell, and every displacement is only associated with changes in cell shape and not with their movement with respect to an external frame of reference. Reliable measurements of cross-sectional OHC area are also easily obtained, which allows for an estimation of fast changes in OHC volume. In addition, the continuous development of faster and more sensitive cameras and better image analysis software, guarantee a continuous improvement in the quality of the method. A downside of the technique, no control on the electric potential across the plasma membrane, is a limitation shared with all the current methods used to evaluate OHC motility in the kHz range.
Thus, the method described here might be an important tool for hearing research, capable of providing new and important clues about the cellular and molecular mechanisms underlying OHCs' motile responses
Disclosures
No conflicts of interest declared.
Acknowledgments
Work supported by National Institutes of Health Grants R01DC10146/R01DC010397, NIDCD P30 DC006276 Research Core, and HEI. Its content is solely responsibility of the authors and do not necessarily represent the official views of NIH or HEI. The authors declare no existing or potential conflict of interest.
References
- Frolenkov GI. Genetic insights into the morphogenesis of inner ear hair cells. Nat Rev Genet. 2004;5:489–498. doi: 10.1038/nrg1377. [DOI] [PubMed] [Google Scholar]
- Ashmore J. Cochlear outer hair cell motility. Physiol Rev. 2008;88:173–210. doi: 10.1152/physrev.00044.2006. [DOI] [PubMed] [Google Scholar]
- Dallos P, Fakler B. Prestin, a new type of motor protein. Nature Rev. Mol. Cell Biol. 2002;3:104–111. doi: 10.1038/nrm730. [DOI] [PubMed] [Google Scholar]
- Frolenkov GI. Cochlear outer hair cell bending in an external electrical field. Biophys. J. 1997;73:1665–1672. doi: 10.1016/S0006-3495(97)78198-0. [DOI] [PMC free article] [PubMed] [Google Scholar]
- Matsumoto N, Kalinec F. Extraction of Prestin-Dependent and Prestin-Independent Components from Complex Motile Responses in Guinea Pig Outer Hair Cells. Biophys J. 2005;89:4343–4351. doi: 10.1529/biophysj.105.064626. [DOI] [PMC free article] [PubMed] [Google Scholar]
- Matsumoto N, Kalinec F. Prestin-dependent and prestin-independent motility of guinea pig outer hair cells. Hear Res. 2005;208:1–12. doi: 10.1016/j.heares.2005.03.030. [DOI] [PubMed] [Google Scholar]
- Ashmore J. The remarkable cochlear amplifier. Hear Res. 2010;266:1–17. doi: 10.1016/j.heares.2010.05.001. [DOI] [PMC free article] [PubMed] [Google Scholar]
- Kitani R, Kakehata S, Kalinec F. Motile responses of cochlear outer hair cells stimulated with an alternating electrical field. Hearing Research. 2011 doi: 10.1016/j.heares.2011.05.013. [DOI] [PMC free article] [PubMed] [Google Scholar]
- Dallos P, Evans BN. High-frequency outer hair cell motility: corrections and addendum. Science. 1995;268:1420–1421. [PubMed] [Google Scholar]
- Frank G, Hemmert W, Gummer AW. Limiting dynamics of high-frequency electromechanical transduction in outer hair cells. Proc. Natl. Acad. Sci. 1999;96:4420–4425. doi: 10.1073/pnas.96.8.4420. [DOI] [PMC free article] [PubMed] [Google Scholar]
- Santos-Sacchi J. On the frequency limit and phase of outer hair cell motility: effects of the membrane filter. J. Neurosci. 1992;12:1906–1916. doi: 10.1523/JNEUROSCI.12-05-01906.1992. [DOI] [PMC free article] [PubMed] [Google Scholar]
- Inoué S. Video Microscopy. New York: Plenum Press; 1986. [Google Scholar]


