Abstract
The present analysis was conducted to validate an automated measurement system of noise violations by participants in the therapeutic workplace, which is a model workplace that offers paid employment and vocational training programs to illicit drug users. We collected data on dB levels via an electronic dB meter in a computer classroom with many different sound sources, and defined noise violations as sounds exceeding 55 dB. Human observers recorded whether staff or participants were responsible for violations, the types of events that resulted in violations, and whether these events were a result of participant behavior. Our analyses revealed that participants caused the majority of noise violations. These results suggest that the automated measurement system collects valid data on participant behavior that contributes to noise violations. Our results also suggest that these behaviors can in principle be modified to reduce the frequency of noise violations. Suggestions for replication in other settings and interventions designed to reduce behaviors leading to noise violations involving feedback and incentives are discussed.
Keywords: automated data collection, feedback, incentives, noise, therapeutic workplace
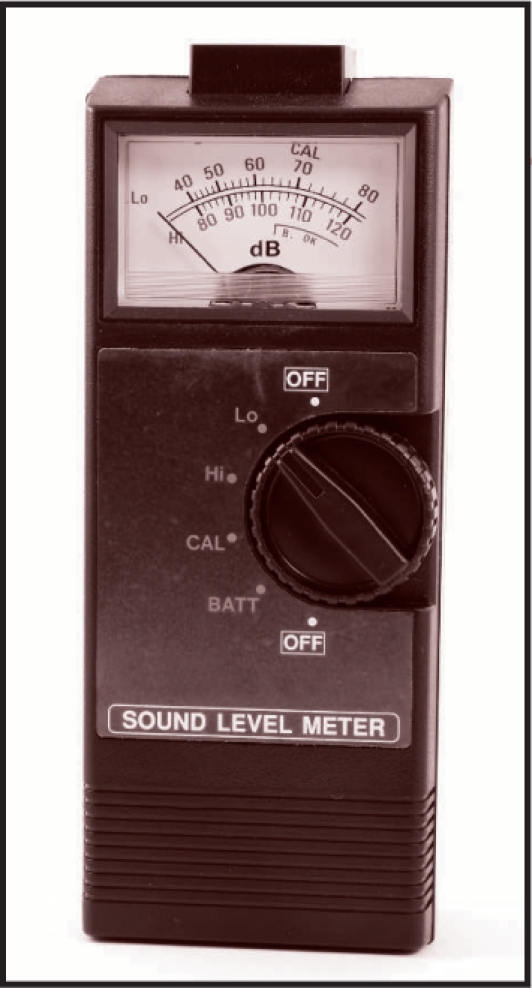
Automated data collection reduces researcher time and effort (Wright, 2005) as compared to human observation, and costs associated with data collection are often reduced with automation (Panos & Freed, 2007). Another benefit of automated collection is that automated data can be used to deliver feedback immediately (Yu, Moon, Oah, & Lee, in press), whereas human observers need time to collate and summarize data before feedback can be delivered.
Some approaches to validating new automated data collection systems include identifying whether the system detects the occurrence of an event accurately, or identifying whether the system measures some specific dimension of an event with high validity. Validation of a new automated data collection system can occur through comparison to data collected using a gold standard (Gupta, Mittal, Rizzo, Bikkina, & DeBari, 2009), or by comparison of automated data with human observation (Panos & Freed, 2007; Yu et al., in press). For example, Yu and colleagues validated an automated system designed to detect whether office workers adopted ergonomically safe postures at computer workstations by comparing data gathered by trained human observers to data collected by the automated system.
Measuring environmental noise is important in educational and organizational settings, as environmental noise can affect performance on educational tasks (Tafalla & Evans, 1997) and other cognitive tasks (Taylor, Melloy, Dharwada, Gramopadhye, & Toler, 2004). Valid measurement of ambient sound levels is clearly a prerequisite for managing noise exposure, and guidelines exist for measuring noise exposure from machinery in occupational settings such as industry installations (e.g., Occupational Safety and Health Administration, 1999). However, few guidelines exist for measuring noise in settings in which human-generated noise should be kept at a minimum. One such setting is the therapeutic workplace (e.g., Silverman, 2004), a model workplace that offers access to vocational training to chronically unemployed drug users.
Automated Data Collection of Noise Violations in the Therapeutic Workplace
Background. Participants at the therapeutic workplace must meet certain standards of professional conduct to access vocational training (Carpenedo et al., 2007), as one of the aims of the therapeutic workplace is to prepare participants for community employment (Sigurdsson, DeFulio, Long, & Silverman, in press). Carpenedo et al. found that the most prevalent violations of professional demeanor standards, as identified by staff in the therapeutic workplace, were noise violations of a library mode standard, defined as keeping “noise level low so that someone standing 10 feet away from the trainee cannot hear them well enough to transcribe or imitate the words, sounds, or noises they are saying or making” (p. 1146). In fact, these noise violations were the only type of conduct violation that was pervasive. An informal assessment revealed that the noise violations were also directly correlated with vulgar language violations, professional communication violations, and rate of incorrect responses on a typing training program; and inversely correlated with correct responses on the typing training program.
Barriers to automated collection of noise violation data. In order to consistently reduce noise violations in the therapeutic workplace, a valid measurement system of such violations must first be developed. Schmidt and Ulrich (1969) used a dB meter to measure noise levels in a grade school classroom, and were successful in reducing those levels via feedback on noise level violations and incentives for maintaining low noise levels. However, in Schmidt and Ulrich, a human observer had to observe the dB meter to determine noise levels and noise violations. Since the publication of Schmidt and Ulrich, advances in computer technology have made it possible to collect dB data automatically, reliably, and in a more practical manner without a human observer.
A technical problem arises, however, when noise levels are measured in an automated fashion, as dB meters are sensitive only to levels of sound pressure and as such cannot discriminate between sound types and sources. In the therapeutic workplace, participants and staff, may be responsible for loud sounds, and an automated data collection system that is only sensitive to dB levels cannot discriminate between those sources. If participant noise levels are to be measured reliably and consequences delivered for maintaining relative quiet, it must be clear that participants are responsible for the majority of noise violations registered by an automated system.
Study Purpose
This article describes a method of verifying an automated data collection system for noise violations in the therapeutic workplace. The aim of this research is to establish via human observation over a sample period of time that participants in fact generate a significant majority of noise violations. These procedures can be adapted to other settings in which relative quiet may be required, such as workplaces, K-12 classrooms, special education classrooms, and regular workplaces. The article concludes with some suggestions for interventions to reduce noise violations.
Method
Participants and Setting
Participants were enrolled at the therapeutic workplace at the Center for Learning and Health located in Baltimore, Maryland. The therapeutic workplace program consists of pharmacological and behavioral treatment for drug addiction and provisions of employment training. Participants had the opportunity to attend the program for approximately four hours per weekday, divided into two-hour shifts (a.m. and p.m.), and engage in computerized training and education delivered on-site. The therapeutic workplace is divided into three classrooms, and all participants in the current study worked in the same classroom. All participant computer workstations had a computer on a desk. During the study, all participants worked at training programs designed to improve typing and keypad skills (Silverman, 2004; Silverman et al., 2007). The ambient sound level in the classroom was approximately 43 dB.
Procedures
Automated sound level measurement. A Smart Sensor Digital Sound Level Meter Model AR834 from Intell Instruments was used to measure sound levels. The sound meter was located in the ceiling in the middle of the classroom (see Figure 1). The sound meter was connected to a personal computer, and a graphic user interface program included with the sound meter displayed sound levels in dB via text and a line graph on the computer screen. The meter sampled sound levels two times per s, and the output displayed on the computer screen in real time was the average dB level per s. The average dB level per s was also logged in a computer text file for subsequent analysis. Sound measures were collected for four hours per day for 78 workdays.
Figure 1.
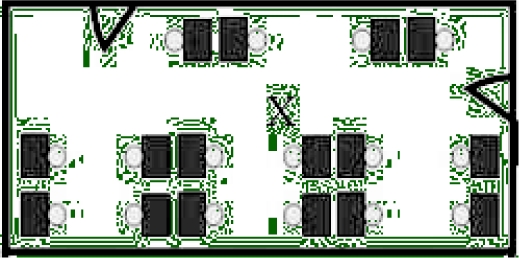
Layout of classroom. An “X” marks the location of the dB meter.
A noise violation was defined as any auditory stimulus that exceeded 55 dB, based on criteria established in Pawlaczyk-Łuszczyńska, Szymczak, Dudarewicz, Śliwińska-Kowalska (2006) as appropriate sound levels for activities related to “administration, . . . research work, data handling” without telephone use (p. 189). This definition of a noise violation differs from the Carpenedo and colleagues' (2007), definition of a library mode violation, as staff was responsible for detecting violations in that study without the aid of a dB meter.
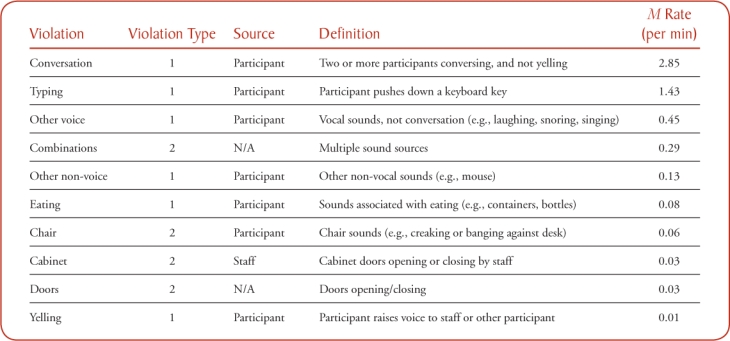
Human observation of noise sources. Research assistants collected data on sources of noise violations in the classroom for one hour during six separate shifts (see Table for a list of sound sources and definitions provided to research assistants prior to each session). Multiple violations were defined as two or more co-occurring sources of a noise violation.
Table.
Summary of Noise Violation Types and Mean Rate of Occurrence
| Violation | Violation Type | Source | Definition | M Rate (per min) |
| Conversation | 1 | Participant | Two or more participants conversing, and not yelling | 2.85 |
| Typing | 1 | Participant | Participant pushes down a keyboard key | 1.43 |
| Other voice | 1 | Participant | Vocal sounds, not conversation (e.g., laughing, snoring, singing) | 0.45 |
| Combinations | 2 | N/A | Multiple sound sources | 0.29 |
| Other non-voice | 1 | Participant | Other non-vocal sounds (e.g., mouse) | 0.13 |
| Eating | 1 | Participant | Sounds associated with eating (e.g., containers, bottles) | 0.08 |
| Chair | 2 | Participant | Chair sounds (e.g., creaking or banging against desk) | 0.06 |
| Cabinet | 2 | Staff | Cabinet doors opening or closing by staff | 0.03 |
| Doors | 2 | N/A | Doors opening/closing | 0.03 |
| Yelling | 1 | Participant | Participant raises voice to staff or other participant | 0.01 |
Three observations occurred during a.m. shifts and three observations occurred during p.m. shifts.
Validation of noise sources. One research assistant continuously observed a computer monitor that displayed dB meter readings as numerical values in real time from the classroom throughout each session, and alerted one or two (during interobserver agreement sessions) research assistants with a hand gesture when a sound registered more than 55 dB on the monitor. Research assistants tasked with recording sound sources were located in a doorway to the classroom, and independently recorded the source of any noise that registered more than 55 dB. If an event occurred for more than one second (e.g., conversation), the source was scored for every second during which sounds exceeded 55 dB.
Interobserver agreement for human observation. We collected interobserver data for four sessions, and calculated agreement by dividing the number of times that the two observers agreed on a source for a given violation by the total number of violations. Interobserver agreement averaged 90% (range: 83%–93%).
Results
Data Analysis
For purposes of data analysis, we re-coded all noise violations into one of two violation categories: Type 1 and Type 2 (see Table). The Type 1 violation category encompassed modifiable noise violations that were due do undesirable participant behavior, and the Type 2 violation category included all other noise generated by participants or staff. Noise violations due to cabinet use were exclusively generated by staff, thus, these were considered Type 2 violations. It was not possible to determine whether staff or participants contributed to door noise and violations with multiple sound sources, as these events occurred outside the line of sight of research assistants; these were also categorized as Type 2 violations.
Classroom Observations
The Table displays the types and rate of noise violations observed during classroom observations by research assistants, and Figure 2 depicts the frequency of Type 1 and 2 violations during classroom observations. Classroom observations indicated that the most frequently observed noise violation per shift was conversation, followed by keyboard typing, other voice sounds, combinations, and other non-voice noise. Other categories of noise were recorded on fewer occasions than once per work shift. Figure 3 depicts dB readings during a sample observation, and indicates types of events for a sample of noise violations.
Figure 2.
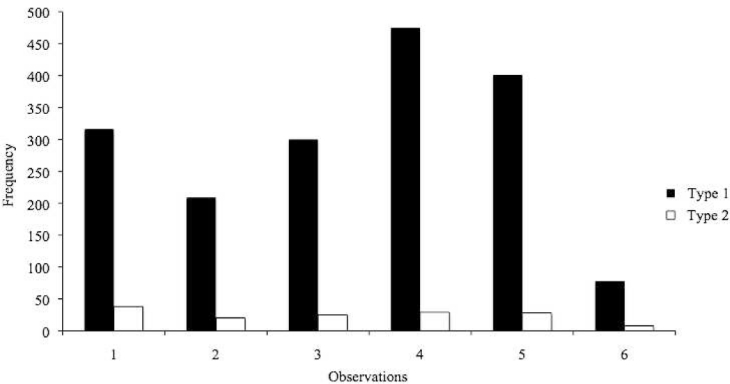
Frequency of violation types across classroom observations.
Figure 3.
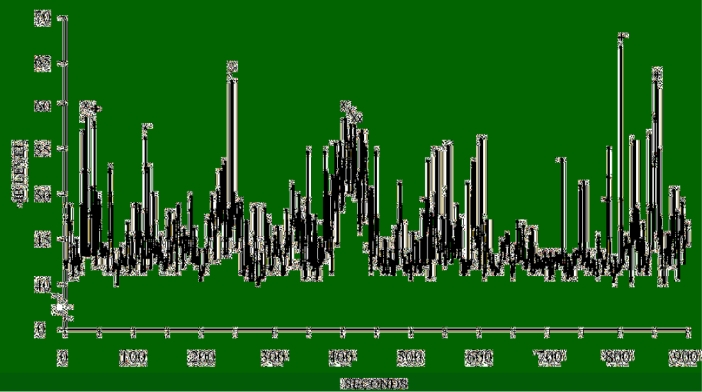
dB meter readings during sample observation session. The letter “x” (x) indicates conversation, plus (+) indicates other voice sounds, diamond (⋄) indicates other non-vocal, and star (*) indicates cabinet closing.
Automated Measurement of Noise Violations
During the 78 days that sound level data were collected, the number of noise violations per day ranged from 3 to 1,612 (M = 437, SD = 438), total min in attendance per day for all participants present that day ranged from 279 to 2,174 (M = 1003, SD = 463) and the total number of participants in attendance per day ranged from 2 to 9 (M = 5, SD = 2).
Discussion
Validation Outcomes
The automated data collection system was successfully validated for the measure of behaviors that contribute to elevated noise levels in the study setting. Of all noise violation types observed during classroom observations, only 8% were considered to be non-modifiable as they are out of the control of participants. That number includes sounds generated by staff, and sounds that occurred because of office furniture use (chairs, cabinet doors, doors, etc.).
Most noise violations involved conversations between two or more participants, and the type of violation observed with the third highest frequency involved non-vocal sounds generated by participants. The type of violation observed with the second highest frequency involved keyboard use. It must be noted that only one participant located approximately 2–2.5 m from the sound meter contributed to all of these violations. Two other participants were located a similar distance from the meter, and typed in a fashion that yielded dB readings below our criterion for a noise violation. The typing violations recorded by the meter do not appear to be due to proximity to the meter, but rather to an idiosyncratic typing style that should be amenable to intervention.
These results provide support for the feasibility of measuring noise violations in the therapeutic workplace, as the overwhelming majority (92%) of the other types of violations recorded during classroom observations can be considered as being under participants' control, and hence amenable to intervention using behavior analytic methods. Based on the results of our analyses, human observers should hence not be needed for ongoing measurement of noise violations in the therapeutic workplace. Automated data collection on this variable therefore appears warranted in this setting.
Considerations for Replication in Other Settings
Researchers or practitioners interested in using automated data collection systems for noise violations in other settings, such as classrooms or workplaces, should be able to replicate the procedures described herein to determine if automated data collection is viable. However, any intervention aimed at reducing sound levels would also have to take into account the fact that approximately 8% of violations were not caused by participants in our study. A complete absence of violations would therefore not be an attainable goal in this or other settings in which loud noises occur as a result of events other than modifiable participant behavior.
Study Weaknesses
Sound pressure decreases as the distance from the sound source increases (Pierce, 1989). It is possible that some sounds that would have registered as above 55 dB in closer physical proximity to the source were not recorded as being above 55 dB at the meter's location (sounds above 55 dB were always truly above that value). However, it would have been impractical and cost-prohibitive to outfit every single workstation with a sound meter. If dB readings are to be used for practical purposes in large spaces, there will always be a trade-off between practicality and accuracy. We therefore used one sound meter in keeping with Schmidt and Ulrich (1969) to maintain a practical approach to sound level measurement.
Secondary Validation of Measurement System
As an aside, we also measured the number of people working at any given time and the number of min worked during any given interval of time during 78 days and found that noise levels were positively correlated. The correlation between the total number of violations per day and total min in attendance per day by all participants was significant (r [78] = .72, p < .001) and the correlation between the total number of violations per day and total number of participants attending the workplace per day was also significant (r [78] = .68, p < .001). Although not a primary focus of our analysis, these findings further suggest that noise levels are primarily a function of worker behavior.
Interventions to Reduce Noise
The focus should now turn to how the occurrence of noise violations can be reduced in settings with varied sources of noise violations. A first step would involve ensuring that participants themselves can gauge sound levels in the environment and discriminate in some way between acceptable (low dB) and unacceptable (high dB) sound levels through feedback. Another consideration is how to motivate individual participants to minimize their own contribution to sound levels.
Feedback. Alvero, Bucklin, and Austin (2001), in their review of feedback studies, observed that group feedback was more consistently associated with positive intervention effects than individual feedback. In terms of feedback sources, Alvero et al. also found that graphic feedback coupled with either written or verbal feedback was most consistently associated with positive intervention effects. For purposes of accuracy and practicality, monitoring and management of sound levels would most likely have to be based on mechanical sound monitoring systems that do not discriminate between sound sources. In a setting with multiple participants in which individual sound sources cannot be differentiated, any sound level feedback delivered to participants would hence have to be based on group levels of noise. Furthermore, based on the findings of Alvero et al. (2001), it appears that graphic and written feedback indicating group performance would be ideal in these settings.
One potentially viable mechanism of feedback delivery would involve displaying sound level readings from a dB meter with a marker indicating a sample boundary between acceptable and unacceptable sound levels in terms of noise violations. A line graph indicating a time-based depiction of sound levels combined with a numeric tally of violations over a given time span would ensure that all participants could be exposed to exactly the type of feedback suggested by Alvero and colleagues. For example, sound level feedback could be displayed in a small Web browser window on individual participants' computers in settings in which participants have personal computers.
Alternative methods of delivering noise feedback include, for example, using an alarm that would sound briefly every time a sound-level violation occurred (similar to the whistle blown by the human observer in Schmidt & Ulrich, 1969). Sound levels could also be displayed on a single monitor or display device in plain view of all participants in a manner similar to Christ and Christ (2006), and Packard (1970) in which a countdown clock in a classroom stopped if any student engaged in disruptive or off-task behavior, and all students received incentives contingent on the clock timing out.
Incentives. While it could be ensured that all participants have access to feedback on sound levels and number of noises in the environment, there is no guarantee that participants would be motivated to reduce them. In order to manage the occurrence of noise violations, a motivational component would undoubtedly have to be added to any intervention involving feedback, as was done in Christ and Christ (2006) and Packard (1970).
Incentives for maintaining sounds levels below the threshold for a noise violation could be delivered to the entire group or individuals, contingent on not exceeding a pre-set criterion for a maximum number of violations. Group level incentives could involve, for example, breakfast or lunch being made available to the group. If participants as a group were not to exceed the maximum number of violations, monetary incentives, paid time off, or gift certificates could also be delivered based on individual participants' attendance. In order to determine the “amount” of an incentive that each individual participant would receive in such an arrangement, the pay-out could be based on min attended per day. Participants who attend the setting for longer periods of time would receive more than those who attended less. In that manner, the individual incentives could be dispersed in a fair manner across individuals although the performance measure would be at the group level.
Summary
In this article, we have attempted to identify methods of measuring and managing the occurrence of noise violations in the therapeutic workplace, with the ultimate goal of preparing participants for gainful employment in the community. We describe two possible methods, one correlational and one observational, for establishing sources of sounds. This is a prerequisite for any intervention aimed at reducing sound levels in environments with multiple sound sources. Finally, we have suggested some methods of intervention based on literature in the areas of classroom management and Organizational Behavior Management.
Footnotes
Action Editor: Timothy Vollmer
References
- Alvero A, Bucklin B, Austin J. An objective review of the effectiveness and essential characteristics of performance feedback in organizational settings. Journal of Organizational Behavior Management. 2001;21:3–29. [Google Scholar]
- Carpenedo C. M, Needham M, Knealing T. W, Kolodner K, Fingerhood M, Wong C. J, Silverman K. Professional demeanor of chronically unemployed cocaine- dependent methadone patients in a therapeutic workplace. Substance Use & Misuse. 2007;42:1141–1159. doi: 10.1080/10826080701410089. [DOI] [PMC free article] [PubMed] [Google Scholar]
- Christ T. J, Christ J. A. Application of an interdependent group contingency mediated by an automated feedback device: An intervention across three high school classrooms. School Psychology Review. 2006;35:78–90. [Google Scholar]
- Gupta P, Mittal L, Rizzo R. A, Bikkina M, DeBari V. A. In-use comparison of blood pressure measurements from an automated blood pressure instrument with those from a mercury sphygmomanometer. Biomedical Instrumentation & Technology. 2009;43:158–163. doi: 10.2345/0899-8205-43.2.158. [DOI] [PubMed] [Google Scholar]
- Occupational Safety and Health Administration. Measuring Exposure: OSHA Directive TED 01-00-015 [TED 1-0.15A] 1999. Retrieved from Occupational Safety and Health Administration: http://www.osha.gov.
- Packard R. G. The control of “classroom attention”: A group contingency for complex behavior. Journal of Applied Behavior Analysis. 1970;3:13–28. doi: 10.1901/jaba.1970.3-13. [DOI] [PMC free article] [PubMed] [Google Scholar]
- Panos R, Freed T. IEEE International Conference on Automation Science and Engineering. Piscataway, NJ: Institute of Electrical and Electronics Engineers; 2007. The benefits of automatic data collection in the fresh produce supply chain; pp. 1034–1038. [Google Scholar]
- Pawlaczyk-Łuszczyńska, Szymczak, Dudarewicz, Śliwińska-Kowalska M. Proposed criteria for assessing low frequency noise annoyance in occupational settings. International Journal of Occupational Medicine and Environmental Health. 2006;19:185–197. doi: 10.2478/v10001-006-0022-9. [DOI] [PubMed] [Google Scholar]
- Pierce A. D. Acoustics: An introduction to its physical principles and applications. Melville, NY: Acoustical Society of America; 1989. [Google Scholar]
- Schmidt G. W, Ulrich R. E. Effects of group contingent events upon classroom noise. Journal of Applied Behavior Analysis. 1969;2:171–179. doi: 10.1901/jaba.1969.2-171. [DOI] [PMC free article] [PubMed] [Google Scholar]
- Sigurdsson S. O, Defulio A, Long L, Silverman K. Propensity to Work Among Chronically Unemployed Adult Drug Users. Substance Use and Misuse. (in press) [DOI] [PMC free article] [PubMed]
- Silverman K. Exploring the limits and utility of operant conditioning in the treatment of drug addiction. Behavior Analyst. 2004;27:209–230. doi: 10.1007/BF03393181. [DOI] [PMC free article] [PubMed] [Google Scholar]
- Silverman K, Wong C. J, Needham M. J, Diemer K. N, Knealing T. W, Crone-Todd D, Fingerhood M, Nuzzo P, Kolodner K. A randomized trial of employment-based reinforcement of cocaine abstinence in injection drug users. Journal of Applied Behavior Analysis. 2007;40:387–410. doi: 10.1901/jaba.2007.40-387. [DOI] [PMC free article] [PubMed] [Google Scholar]
- Tafalla R. J, Evans G. W. Noise, physiology, and human performance: The potential role of effort. Journal of Occupational Health Psychology. 1997;2:148–155. doi: 10.1037//1076-8998.2.2.148. [DOI] [PubMed] [Google Scholar]
- Taylor W, Melloy B, Dharwada P, Gramopadhye A, Toler J. The effects of static multiple sources of noise on the visual search component of human inspection. International Journal of Industrial Ergonomics. 2004;34:195–207. [Google Scholar]
- Wright K. B. Researching Internet based populations: Advantages and disadvantages of online survey research, online questionnaire authoring software packages, and web survey services. Journal of Computer-Mediated Communication. 2005;10(3) article 11. Retrieved from http://jcmc.indiana.edu/vol10/issue3/wright.html. [Google Scholar]
- Yu E, Moon K, Oah S, Lee Y. An examination of the effects of immediate and continuous feedback on safe sitting postures using an automated observation and feedback system. Journal of Organizational Behavior Management. (in press)


