Abstract
Through controlled synthesis and molecular assembly, biological systems are able to organize molecules into supramolecular structures that carry out sophisticated processes. Although chemists have reported a few examples of supramolecular assembly in water, the controlled covalent synthesis of large molecules and structures in vivo has remained challenging. Here we report a condensation reaction between 1,2-aminothiol and 2-cyanobenzothiazole that occurs in vitro and in living cells under the control of pH, disulfide reduction and enzymatic cleavage. In vitro, the size and shape of the condensation products, and nanostructures subsequently assembled, were different in each case and could thus be controlled by tuning the structure of the monomers. Direct imaging of the products obtained in the cells revealed their locations – near the Golgi bodies under enzymatic cleavage control – demonstrating the feasibility of a controlled and localized reaction in living cells. This intracellular condensation process enabled the imaging of the proteolytic activity of furin.
Introduction
Non-covalent self-assembly can rapidly build supramolecular structures from small molecules.1–2 With certain small organic molecules, this process can occur in water and even in cells.3–6 Controlled chemical syntheses of large molecules and structures from simple building blocks in cells, on the other hand, has been challenging because of general incompatibility and lack of selectivity of conventional chemical reactions in vivo. There are a few water-compatible chemical reactions that have been demonstrated in labelling cell-surface receptors, for example, the Staudinger reaction between the azides and triphenylphosphines,7,8 the Huisgen cycloaddition or “Click chemistry” between the azides and alkynes,9–12 the reaction between ketones and aminooxy containing reagents (or hydrazides).13–14 However, these reacting groups are often not naturally present in the biological system, and their reactivity cannot be controlled by cells.
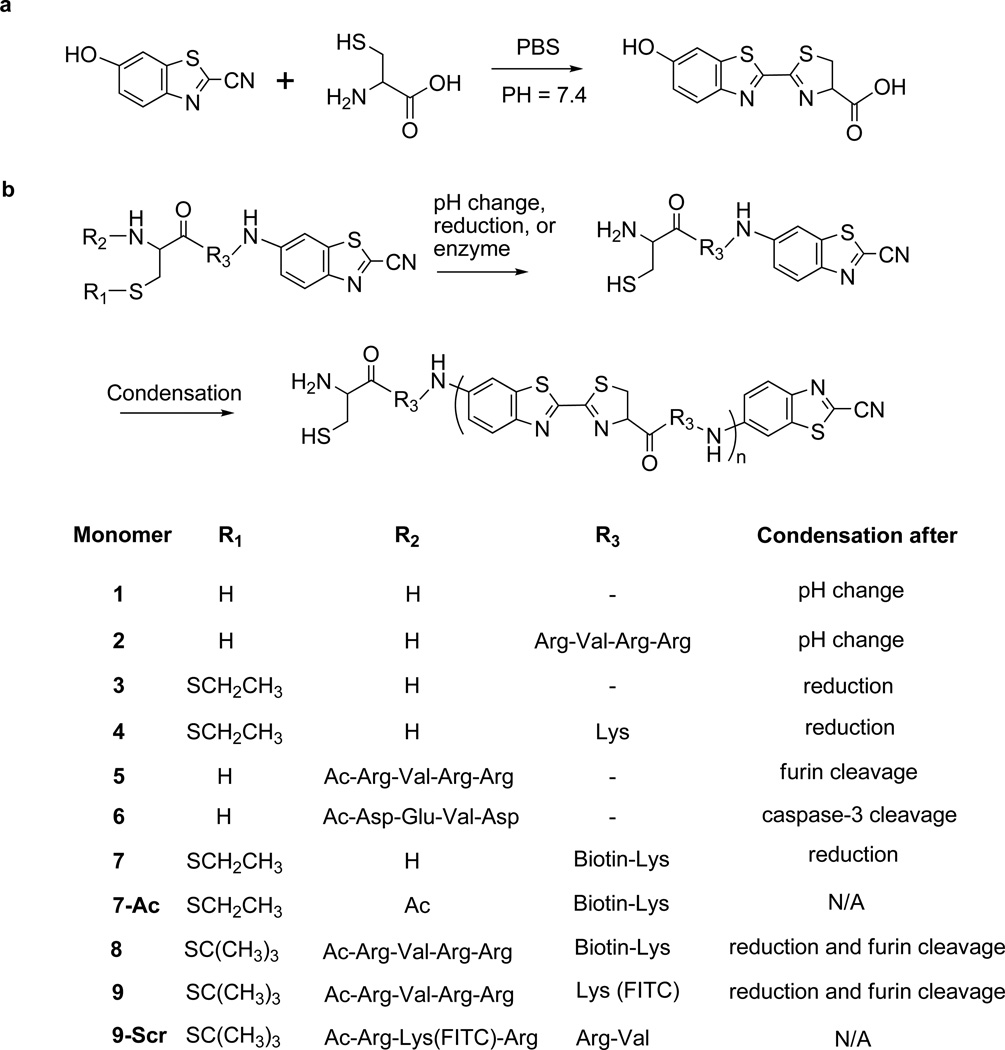
In developing chemical reactions for a controlled synthesis of large molecules and structures in cells, we focused on the condensation reaction between 2-cyanobenzothiazole (CBT) and D-cysteine at the last step of the synthesis of D-luciferin, a common substrate for firefly luciferase (Fig. 1a).15 This reaction proceeds smoothly in mild conditions.16 In fact, it has been suggested for the regeneration of D-luciferin in fireflies, indicating its cell compatibility.17,18 Replacing either cysteine by compounds lacking 1,2-aminothiol group such as glutathione, or CBT by other aromatic cyano compounds such as benzonitirile and picolinonitrile produced little or no condensation products under the same conditions except with 1,3-aminothiol.16 The requirement for both thiol and amino groups presents a simple, convenient means to control this reaction such as through pH change, disulfide reduction, and proteolytic hydrolysis. In this work we designed and synthesized a series of monomers and used them to demonstrate controlled syntheses of large molecules and structures upon pH adjustment, reduction, or enzyme cleavage (Fig. 1b) in vitro and in cells. We further showed that this condensation process could be applied to selectively trap monomers in live cells for imaging the proteolytic activity of furin, a trans-Golgi protease in the family of proprotein convertases that plays crucial roles in development, homeostasis, and diseases ranging from anthrax, Ebola fever, Alzheimer’s disease and cancer.19
Figure 1. Schemes of controlled condensation reaction between 2-cyanobenzothiazole (CBT) and 1,2-aminothiol.
a, The condensation reaction between free cysteine and CBT for the synthesis of luciferin; the 7-hydroxyl group on CBT is replaced by an amino group in the synthesis of aminoluciferin. b, Proposed two-step condensation of monomers controlled by pH, reduction, and a protease. Structures of monomers (1–9) are as shown; 7-Ac is a negative control of monomer 7 and does not condense after reduction, and 9-Scr is a negative control of monomer 9 and cannot be processed by furin.
Results and discussion
Condensation process in vitro
We began with preparing a simple monomer 1 by coupling the carboxylate of cysteine to the amino group of the CBT unit (Fig. 1b). Under acidic conditions (pH ~ 5), the aqueous solution of monomer 1 containing 0.05% DMSO (200 µM) was clear. However, when the pH was raised to 7.4, this solution immediately turned cloudy (Supplementary Figure 1). Readjustment to pH 5 failed to redissolve the precipitates, demonstrating that the process was irreversible.
The progression of the self-condensation of monomer 1 was evaluated by an HPLC assay. The precipitates were collected by centrifugation and extracted with acetonitrile for any trapped, unreacted monomer 1. Both the supernatant and the extract of the precipitates were injected into HPLC for quantification of the remaining unreacted monomer 1. Our results showed that the pH-induced self-condensation process was very quick (Supplementary Table 1): at a concentration of 200 µM, more than half of monomer 1 disappeared from the solution and formed precipitates within 5 minutes (Supplementary Figure 1).
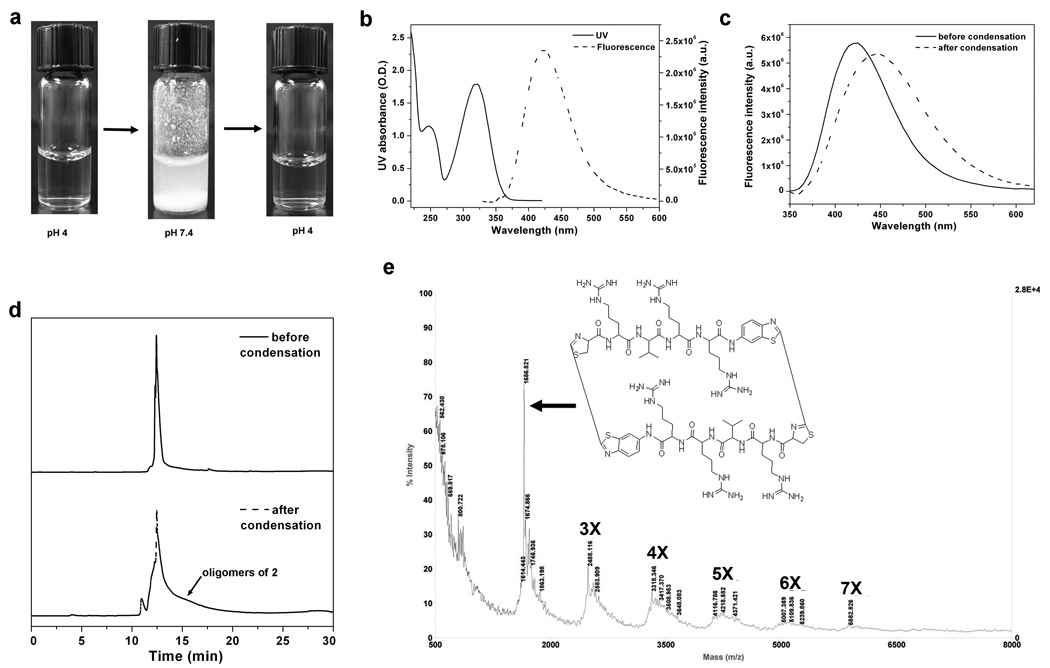
To facilitate the characterization of the reaction product, we designed monomer 2 (Fig. 1b) containing four amino acid residues between two reacting partners so that the condensation product of monomer 2 would dissolve in water. When the pH was changed from 4 to 7.4, monomer 2 generated similar precipitates like monomer 1. However, when the pH was adjusted back to 4 after condensation, the suspension became clear but slightly greenish (Fig. 2a). The fluorescence spectrum of the clear solution exhibited a red shift of the maximum from 425 nm to 450 nm compared with that of the solution of monomer 2 before condensation (Fig. 2c), indicating the formation of the five-member ring after condensation. HPLC analysis of the condensation product showed a broader peak than that of free monomer 2 (Fig. 2d). Matrix-assisted laser desorption/ionization (MALDI) mass spectroscopic analysis of the reaction products of monomer 2 revealed that they were a mixture of oligomers whose molecular weights corresponded to those of a cyclized dimer, trimer, tetramer, pentamer, hexamer, heptamer and higher numbers of oligomers (Fig. 2e). While the finding that monomer 2 condensed to macrocyclic ring structures was surprising, it has been reported that Click chemistry can also produce cyclic dimer peptides.20,21 These results support the hypothesis that controlling the amine reactivity of 1,2-aminothiol by a simple pH change can modulate the condensation and self-polymerization.
Figure 2. pH-controlled condensation of monomer 2.
a, Photographs of aqueous solution of monomer 2 during the pH adjustment; pH increase initiates the reaction and produces the insoluble oligomers of 2 (middle), and pH reverse to 4 turns it into a lightly greenish clear solution (right). b, UV-Vis absorption and fluorescence spectra of 2 in water at pH 4 with a typical absorption peak at 320 nm and a fluorescence emission peak at 425 nm. c, Fluorescence emission of the condensation products of 2 red-shifts from 425 nm to 450 nm. d, HPLC analysis of monomer 2 before (upper trace) and after pH-triggered condensation (lower trace) at pH 4 in water. e, MALDI mass spectrum of the condensation products of monomer 2.
We next synthesized monomer 3 (Fig. 1b) containing a disulfide-protected cysteine to test whether the disulfide reduction could similarly control the condensation process. Monomer 3 was stable at pH 7.4, but after treatment with the reducing reagent tris(2-carboxyethyl)phosphine (TCEP), it formed oligomers similarly to monomers 1 and 2 in the pH-triggered reactions (Supplementary Figure 2a). Subsequent HPLC analysis of a two-step reaction—reduction at pH 5 in order to trap the intermediate followed by pH adjustment to 7.4—verified that the intermediate was monomer 1 (Supplementary Figure 2b).
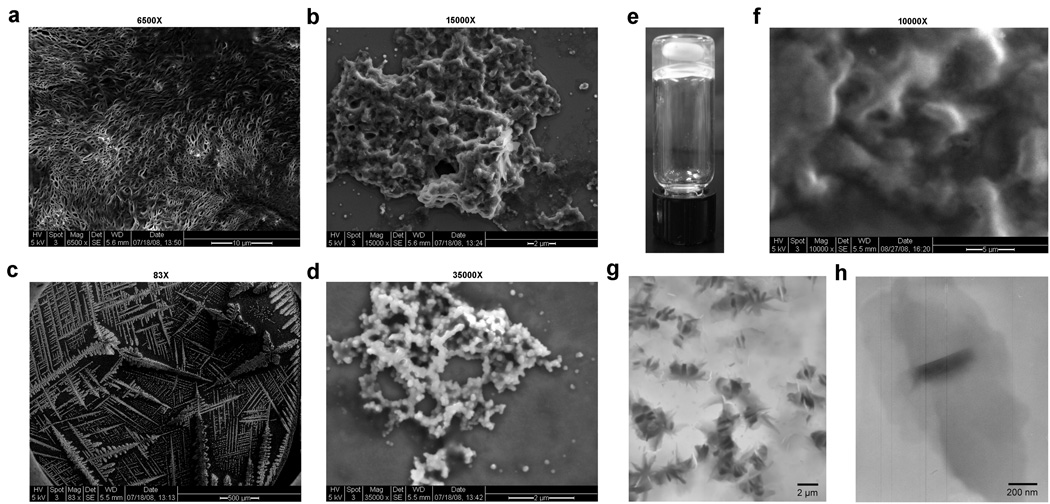
As seen with monomers 1 and 2, the motifs between CBT and the cysteine strongly affect the properties of the condensation products. For example, unlike monomer 3, the clear solution of monomer 4 with a lysine residue in the middle (Fig. 1b) became a transparent hydrogel that could be dissolved in DMSO (Fig. 4e) after TCEP reduction at pH 7.4. MALDI mass spectroscopic analysis revealed the same pattern of molecular weight peaks as observed with the condensation products of monomer 2 (Supplementary Figure 3a). 1H NMR characterization confirmed the loss of the CH2CH3 group in the disulfide motif and a different chemical shift of the proton at the alpha-carbon of cysteine after condensation (Supplementary Figure 3b). We successfully isolated the cyclic dimer for structural characterization by MALDI mass spectroscopy and 2D Heteronuclear Multiple Bond Correlation (HMBC) NMR, both of which confirmed the formation of the macrocyclic ring in the dimer (Supplementary Figure 4). These results demonstrated that the reactivity of the thiol group in the 1,2-aminothiol unit of a monomer could also control the condensation process. Since mammalian cells have a reducing intracellular environment, this reduction-dependent control of the reactivity would provide a simple, convenient mechanism to control the intracellular condensation.
Figure 4. SEM and TEM characterizations of products from controlled condensation of monomers 3, 4 and 5.
a and b, SEM images of the product of monomer 3 in water: 6500× (a), and 15000× (b). c and d, SEM images of the furin-controlled condensation product of monomer 5 in buffer: 83× (c), and 35000× (d). e, White light image of polymer hydrogel of monomer 4 (with stirring bar inside) after TCEP reduction. f, SEM image (10000×) of polymer hydrogel of monomer 4 in (e). g and h, Low (g) and high magnification (h) TEM images of the polymer hydrogel of monomer 4 in (e).
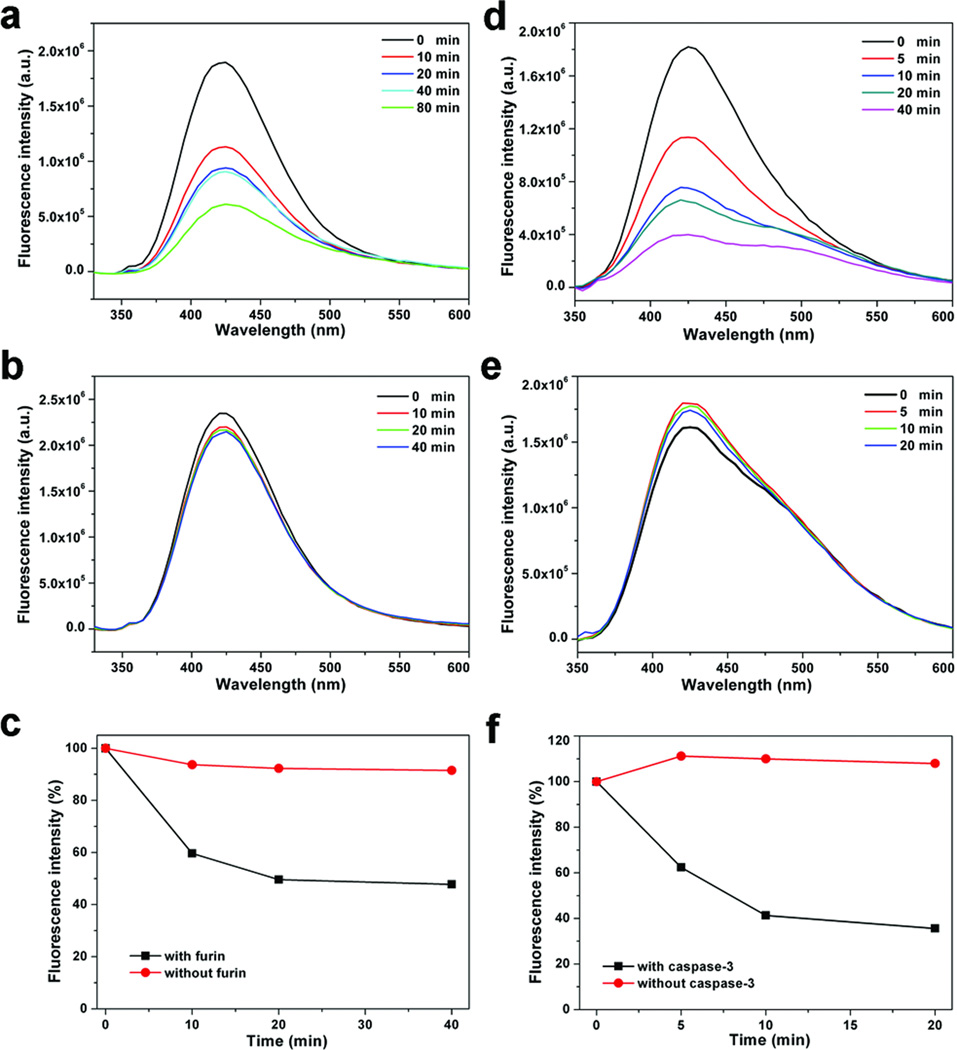
We further explored whether an enzyme such as a protease could control the condensation reaction by regulating the activity of the amino group on 1,2-aminothiol. Two monomers 5 and 6 (Fig. 1b) were prepared and tested with two proteases—furin that prefers a substrate Arg-X-Lys/Arg-Arg↓X (where X can be any residue and ↓ indicates the cleavage site),19,22 and caspase-3 that cleaves at the C-terminus of the Asp residue of a sequence of Asp-Glu-Val-Asp↓X (Fig. 1b).23 Each monomer (at 1 or 2 µM concentration) was incubated with its corresponding protease, and a fluorescence assay measured the concentration of remaining monomers in the solution to monitor the progression of the enzyme-triggered condensation (Fig. 3). After 20 mins, more than 50% of monomer 5 disappeared from the solution due to the cleavage and subsequent condensation (Fig. 3a). For monomer 6, there was 38% decrease in the concentration after 5 mins, and 64% drop after 20 mins (Fig. 3d). In the absence of the proteases, little changes (<5%) were observed with the monomers after 40 mins.
Figure 3. Enzyme-controlled condensation of monomers 5 and 6.
a and b Fluorescence spectra of monomer 5 (2 µM) in furin buffer (pH 7.5) treated with furin (100 pmol/U) (a) or without furin (b) for 0, 10, 20, 40 and 80 min at 30 °C. c, A plot of the relative fluorescence intensity at 425 nm of monomer 5 in a and b vs. time. d and e, Fluorescence spectra of the supernatant of monomer 6 (1 µM) in caspase-3 buffer (pH 7.4) treated with caspase-3 (200 pmol/U) (d) or without caspase-3 (e) for 0, 5, 10, 20 and 40 min at 37 °C. f, A plot of the relative fluorescence intensity at 425 nm of monomer 6 in d and e vs. time.
It is interesting to note that the condensation products from the pH change, reduction and enzymatic cleavage displayed different structural patterns. This difference appears to be related with both the formation rate of the products and the structure of the motif between the two reacting partners. For example, Scanning Electron Microscope (SEM) imaging showed that monomer 3 produced a 3-dimensional fibrous nanostructure after reduction (Fig. 4a) but monomer 5 gave a 2-dimensional snowflake-shaped nanofiber after the furin cleavage (Fig. 4c). In both cases, similar nanoparticles were observed with an average diameter of about 130 nm (Supplementary Figure 5a). However, under our conditions, the TCEP reduction of 3 was faster in generating reactive monomers than the protease cleavage of 5, which resulted in assembling a less ordered nanostructure with monomer 3 than with monomer 5, as confirmed by SEM (Fig. 4b&d).
The effect of the middle motif of a monomer is clearly manifested by the hydrogel which was formed by self-assembly of the condensation products of monomer 4 under TCEP reduction (Fig. 4e). SEM examination of the hydrogel showed a 3-dimentional porous network (Fig. 4f), while the Transmission Electron Microscope (TEM) uncovered that this network was made of micro “bee” shape nanostructures (Fig. 4g) with each of them composed by a middle dark ribbon and two light petal-shape wings (Fig. 4h). High resolution TEM revealed that the dark ribbon was made of nanoparticles with an average diameter of 7–12 nm and the light petal was made of smaller nanoparticles with an average size of 3.5 nm in diameter (Supplementary Figure 5b).
The results from these in vitro experiments with monomers 1–6 collectively suggest that the controlled synthesis of nanostructures proceeds through chemical condensation and subsequent nanoassembly: the monomers are first condensed into oligomers (including the cyclic forms observed with monomers 2 and 4) after activation, and the oligomers are then assembled into nanoparticles and nanostructures.
Reduction and enzyme triggered condensation in cells
Our next goal was to examine whether this condensation process could take place in cells. We first performed the reaction in the lysates of breast cancer cells (MDA-MB-468). The supernatant of the cell lysate was incubated with monomer 4 (200 µM) for 1 h and then analyzed by HPLC. The reduction by glutathione should similarly reduce the disulfide to trigger the condensation reaction in the cell lysate. Indeed, HPLC analysis showed the formation of condensation products in the cell lysate (Supplementary Figure 6). One of the products was isolated and MALDI mass spectroscopy confirmed it as previously identified cyclic dimer. HPLC analysis also showed the side reaction product of monomer 4 with free cysteine in the lysate (Supplementary Figure 6). This side product was able to leak or be secreted out by cells since HPLC analysis revealed its presence in the extracellular medium after incubation of monomer 4 with cells (Supplementary Figure 7). This result demonstrates that the self-condensation reaction can occur in the complex aqueous environment of cells even in the presence of free intracellular cysteine.
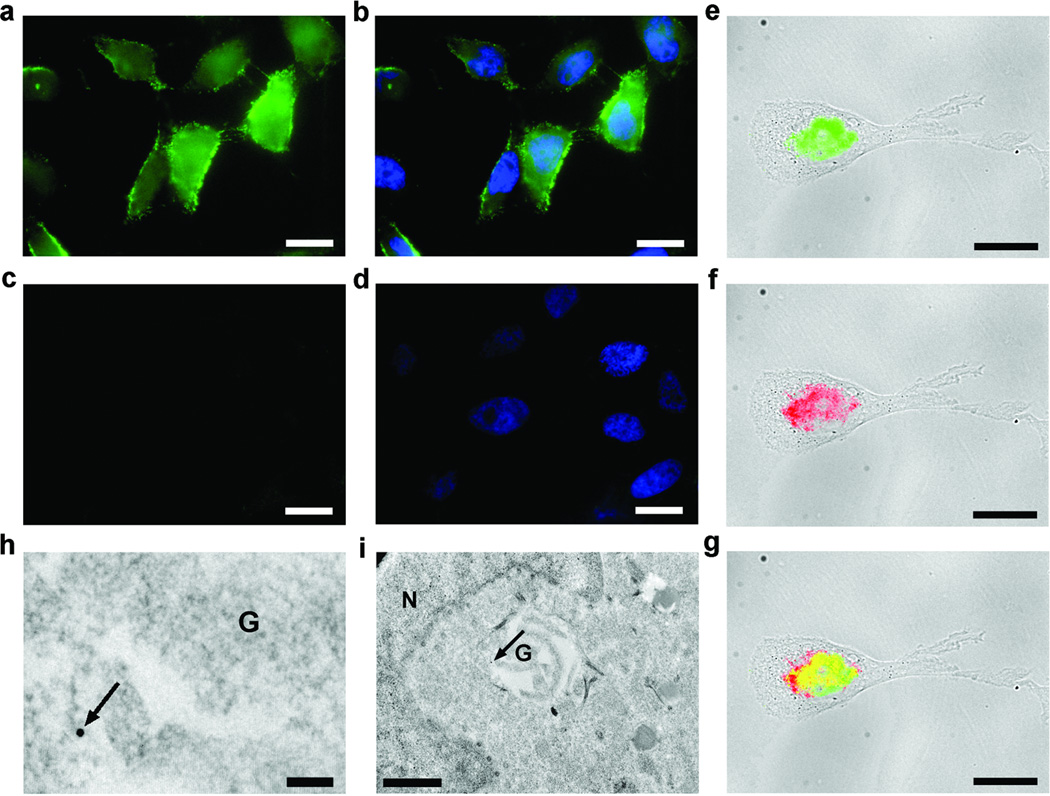
To image the condensation products in cells, we designed monomer 7 with a disulfide-protected cysteine and biotinylated lysine (Fig. 1b). After entering into cells, its disulfide will be reduced by the abundant intracellular glutathione (GSH) to trigger the condensation reaction. The biotin tag on lysine of 7 would allow subsequent fluorescence imaging with FITC-labeled streptavidin for direct imaging of the condensation products. The formed condensation products will be retained inside cells during the fixation and permeabilization for imaging due to their large size, but free monomers and their side-products with intracellular free cysteine will be easily washed off out of cells. HeLa cells were incubated with monomer 7 at 200 µM for 8 hours, then fixed and permeabilized for staining with FITC-labeled streptavidin. Before staining, the cells were washed to remove any remaining monomer 7. As expected, strong fluorescence emission was seen in the cytosols and nuclei of nearly all cells incubated with monomer 7 for 8 hours (Fig. 5a&b), confirming the formation of large molecular weight products during the incubation of monomer 7. For cells without the incubation of 7, the same procedure produced no fluorescence staining signals. As another negative control, an analog of 7 with an acetylated amine, 7-Ac (Fig. 1b), was similarly incubated and stained with FITC-labeled streptavidin. Without free 1,2-aminothiol, 7-Ac should not condense; indeed, staining with FITC-labeled streptavidin did not produce any fluorescence emission (Fig. 5c). Lower concentrations of 7 (e.g. 2 and 20 µM) were also tested, for example, in just 2 hours, strong fluorescence staining by FITC-labeled streptavidin was observed in cells incubated with 2 µM of 7. These results demonstrate that the condensation reaction is efficient in living cells even at a low concentration of monomers. In comparison to the reported examples of supramolecular hydrogelation inside cells, the minimal condensation concentrations of our monomers (2 µM) are almost 500-fold lower.24
Figure 5. Visualization of controlled condensation in cells.
a–d, Fluorescence images of HeLa cells incubated with 200 µM of monomer 7 (a and b) or 100 µM of control monomer 7-Ac (c and d) and stained with FITC-labeled streptavidin after fixation: a and c, EGFP channel for imaging the condensation product; b and d, an overlay of images (in a and c) with nuclear staining with DAPI. Scale bar: 20 µm. e–g, Merged fluorescence and transmitted light images of MDA-MB-468 cells incubated with monomer 8 (200 µM) for 8 hrs: e, FITC-labeled streptavidin staining of condensation products (transmitted light and EGFP channel); f, immunofluorescence staining of furin with rhodamine-labeled antibody (transmitted light and DsRed channel); g, overlay of images in e and f. Scale bar: 20 µm. h and i, Electron microscope images of MDA-MB-468 cells incubated with monomer 8 (200 µM) for 8 hrs and stained with streptavidin-gold nanoparticles (15 nm): h, enlarged image showing the location of gold nanoparticle (arrow indicated) around Golgi bodies (G) (scale bar: 100 nm); i, whole image shows the location of gold nanoparticle (arrow indicated) around Golgi bodies (G) near nuclear (N) (scale bar: 1 µm).
We then evaluated whether enzymes such as proteases could similarly control the condensation in cells. Taking the same imaging approach as with monomer 7, we designed monomer 8 by coupling a peptide which has a furin substrate sequence (RVRR) to the amino group on CBT (Fig. 1b). The use of biotin tag offers an additional advantage that streptavidin-gold nanoparticle conjugates are available for high resolution electron microscopic (EM) imaging. Cleavage of monomer 8 by furin and reduction by GSH in cells would generate the 1,2-aminothiol and lead to the condensation intracellularly. Using the same staining protocol as with monomer 7, we observed strong fluorescence signals in breast cancer cells (MDA-MB-468) incubated with monomer 8 (Fig. 5e). Immunofluorescence staining was performed with a rhodamine-labeled secondary antibody and confirmed the expression of furin in MDA-MB-468 cells (Fig. 5f).25 The overlay of the two fluorescently stained images (Fig. 5g) indicates that the condensation signals (in green) are closely located to the furin enzyme sites—the Golgi bodies (in red). The same fluorescence staining pattern was also observed with other furin-expressing cell lines such as HeLa, and COS-7 cells (Supplementary Figure 8). However, when a furin inhibitor (decanoyl-RVRR-cmk)26 was applied together with monomer 8, the fluorescence staining pattern previously observed was absent, confirming that furin was responsible for the localized condensation of monomer 8 at the Golgi bodies (Supplementary Figure 9). To further confirm the intracellular location of condensation, we stained the cells with streptavidin-Au15 conjugates for high-resolution EM imaging after incubation of MDA-MB-468 cells with 8 (200 µM) for 8 hrs (Fig. 5h–i, and Supplementary Figure 10), and showed that the streptavidin-gold conjugates indeed bind the condensation products of monomer 8 close to the Golgi apparatus (G). All these imaging results provide direct evidence that upon the furin cleavage, monomer 8 can condense into aggregates at or near the enzyme site in cells.
Imaging of the protease activity in single live cells
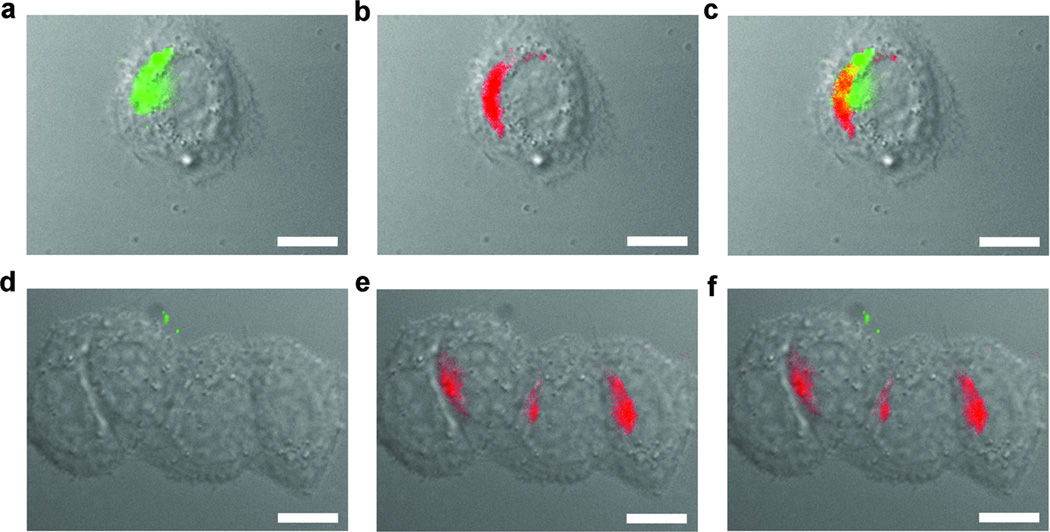
An immediate application of this intracellular condensation process is to image the protease activity and localization in single living cells. We replaced the biotin tag with FITC to prepare monomer 9 for direct imaging of the furin activity. Incubation of MDA-MB-468 cells with monomer 9 (2 µM) for 2 hours followed by co-staining of the cells with a Golgi marker (BODIPY TR C5-ceramide-BSA complexes) revealed a good overlap of green fluorescence (from the condensation product) and red fluorescence (from the Golgi marker), supporting that the intracellular condensation happened at or near Golgi bodies in cells (Fig. 6a–c). Live cells treated with a scrambled control of monomer 9 (9-Scr in Fig. 1b) which cannot be cleaved by furin showed little overlap of green and red fluorescence; weak, uniform green fluorescence might simply reflect the distribution of 9-Scr inside cells, and its overall intensity was 2–3 fold less than the intensity around the locations of Golgi bodies in cells treated with monomer 9 (Fig. 6d and Supplementary Figure 11). Furin activity in other cell lines such as C6 glioma cells can also be imaged with monomer 9 (Supplementary Figure 12). This result demonstrates that this condensation reaction can be applied to image specific furin activity in living cells.
Figure 6. Imaging of furin-triggered localized condensation in live cells.
MDA-MB-468 cells are incubated with monomer 9 (a–c) or 9-scr (d–f) at a concentration of 2 µM for 2 hrs then co-stained with a Golgi marker (BODIPY TR C5-ceramide-BSA complexes) before imaging: a and d, an overlay of differential interference contract (DIC) and fluorescence image of condensation product (EGFP channel); b and e, an overlay of DIC and Golgi staining (DsRed channel); c, an overlay of images in a and b, and f, an overlay of images in d and e. Scale bar: 10 µm.
Collectively, our data have demonstrated the biocompatibility of the condensation reaction between CBT and 1,2-aminothiol for controlled assembly of nanoparticles. Free cysteine in cells can react with CBT on the monomers, however, this side reaction terminates the monomers from further condensation to form cyclic oligomers. As seen with monomer 4, such a side product can leak or be secreted out of cells. The depletion of free cysteine by CBT alone does not appear to render cytotoxicity, as revealed from an MTT assay of 2-cyano-6-aminobenzothiazole (250 µM) in HeLa cells. For monomers that enter cells through endocytosis, the side reaction with free cysteine in the cytosol may not be significant.
In summary, we have discovered a new, cell-compatible condensation process which can be controlled by pH, disulfide reduction, and enzyme to synthesize large molecules and form different nanostructures. Properties of the condensation products and assembled nanostructures such as molecular weight, nanoparticle size, and morphology may be controlled by the chemical structures of the monomers and the methods for generating the condensation products (pH, reduction, or enzyme). Direct imaging of the condensation products generated by glutathione reduction and proteolytic hydrolysis inside cells reveals their different subcellular locations and demonstrates the feasibility of controlled and localized condensation in cells with this system. The ability of controlling the condensation process by enzymes is particularly attractive for many applications such as in vivo molecular imaging of cancer and selective drug delivery to tumor cells since many cancers have overexpressed proteases like furin and cathepsins.27–31 By attaching an anticancer drug or imaging tag to the monomer, the tumor-overexpressed proteases may lead to selective condensation and accumulation of drug or imaging tag in tumor cells.
METHODS
General methods
Syntheses and characterizations of monomers are in the online Supplementary Methods. HPLC analyses were performed on a DIONEX HPLC System equipped with a GP50 gradient pump and an in-line diode array UV detector using Phenomenax C18 RP column with CH3CN (0.1% of TFA) and water (0.1% of TFA) as the eluent (detailed gradients used for analyses and purifications in Supplementary Table 2 and 3). SEM micrographs were obtained on an FEI XL30 Sirion Microscope at an accelerating voltage of 5 kV. TEM micrographs were obtained on a JEM 1230 Electron Microscope. The cryo-dried samples were prepared as following: a copper grid coated with carbon was dipped into the hydrogel and placed into a vial, which was plunged into liquid nitrogen until no bubbles appear. Then, water was removed from the frozen specimen by a freeze-drier. MALDI TOF/TOF mass spectra were obtained on an Applied Biosystems Voyager DE-RP at an accelerating voltage of 20 kV, 2800 of laser intensity, and 150 nsec of extraction delay. Furin was purchased from Biolabs (2,000 U/mL); one unit is defined as the amount of furin that releases 1 pmol of methylcoumarinamide (MCA) from the fluorogenic peptide Boc-RVRR-MCA (Bachem) in one minute at 30 °C. Caspase-3 was bought from BioVision as lyophilized powder; one unit is defined as the amount of caspase-3 that cleaves 1 nmol of substrate DEVD-pNA per hour at 37 °C in a reaction solution.
Cell culture
HeLa human cervix adenocarcinoma epithelial cells, COS-7 monkey kidney fibroblast cells, C6 rat brain glioma cells, and MDA-MB-468 human breast adenocarcinoma epithelial cells were cultured in DMEM (GIBCO) supplemented with 10% fetal bovine serum (FBS, GIBCO), 100 unit/mL penicillin and 100 µg/mL streptomycin (GIBCO).
In vitro fluorescence assay of protease-controlled reaction
100 µL of solution of monomer 5 at 2 µM in furin buffer (100 mM HEPES, 1 mM CaCl2, 1 mM TCEP, pH 7.5) was treated with 2 U of furin (100 pmol/U) at 30 °C. At each time point, the reaction mixture was centrifuged at 14,000 rpm for 1 min. The supernatant was taken out for the measurement of the fluorescence intensity with a fluorometer. 200 µL of solution of monomer 6 at 1 µM in caspase-3 buffer (50 mM HEPES, 50 mM NaCl, 10 mM EDTA, 5% glycerol, 1 mM TCEP, pH 7.4) was treated with 1 U of caspase-3 (0.2 nmol/U) at 37 °C. At each time point, the reaction mixture was centrifuged at 14,000 rpm for 1 min. The supernatant was taken out to measure the fluorescence intensity with a fluorometer.
Cell staining and imaging
For fixed cell staining, cells were incubated with monomer 7 or 8 at 200 µM for 8 h, washed with PBS (3x), fixed with 4% paraformaldehyde at r.t. for 30 min, washed with PBS (3x) again and then permeabilized with 1% Triton X-100 in PBS for 20 min at room temperature. Cells were stained with FITC-labeled streptavidin (1 µg/mL) at r.t. for 30 min, wash with PBS (3x), incubated for 1 h at r.t. with 4 changes of 10 mM biotin in PBS. After that, cells were washed with PBS (3x) and 1x with distilled water then mounted with mounting medium (with DAPI) and imaged with a fluorescence microscope equipped with DAPI and EGFP filters. The exposure time was 150 ms for DAPI and 600 ms for FITC, respectively. Similar procedures were used for furin immunofluorescence staining (Supplementary methods).
Electron microscopic imaging
MDA-MB-468 cells were incubated with monomer 8 (200 µM) for 8 h. After stained with streptavidin-Au15 using the furin immunostaining protocol (Supplementary Methods), the cells were fixed with 2% glutaraldehyde for 20 min at room temperature and then the fixation was replaced with 1% OsO4 in double-distilled water for 1 h. After washing, the solution was changed to 1% uranyl acetate and the cells were stained for another 2 hrs. The cells then were dehydrated in ethanol and embedded in Epon. After the removal of the glass coverslip with 49% HF, thin sections (100 nm) were cut, mounted on copper grids for electron microscope observation.
Live-cell imaging co-stained with a Golgi marker
Cells were first incubated with 9 or 9-scr at 2 µM for 2 h and washed with cold HBSS/HEPES (3x) before incubated for 30 min at 4 °C with 5 µM of BODYPY TR C5-ceramide-BSA complexes (Invitrogen) in HBSS/HEPES. After several times of rinsing with ice-cold medium, the cells were incubated in fresh medium for another 30 min at 37 °C. Finally the medium was replaced before imaging under a fluorescence microscope equipped with EGFP and DsRed filters. The exposure time was 20 ms for green fluorescence (EGFP filter) acquisition and 50 ms for Golgi marker (DsRed filter).
Supplementary Material
Table 1.
| Compound 1 | 2-amino-N-(2-cyanobenzo[d]thiazol-6-yl)-3-mercaptopropanamide |
| Compound 2 | CRVRR-CBT |
| Compound 3 | 2-amino-N-(2-cyanobenzo[d]thiazol-6-yl)-3-(2-ethyldisulfanyl)propanamide |
| Compound 4 | 6-amino-2-(2-amino-3-(2-ethyldisulfanyl)propanamido)-N-(2-cyanobenzo[d]thiazol-6-yl)hexanamide |
| Compound 5 | Ac-RVRRC-CBT |
| Compound 6 | 4-(2-acetamido-3-carboxypropanamido)-5-(1-(3-carboxy-1-(1-(2-cyanobenzo[d]thiazol-6-ylamino)-3-mercapto-1-oxopropan-2-ylamino)-1-oxopropan-2-ylamino)-3-methyl-1-oxobutan-2-ylamino)-5-oxopentanoic acid |
| Compound 7 | 2-(2-amino-3-(2-ethyldisulfanyl)propanamido)-N-(2-cyanobenzo[d]thiazol-6-yl)-6-(5-(2-oxo-hexahydro-1H-thieno[3,4-d]imidazol-4-yl)pentanamido)hexanamide |
| Compound 7-Ac | 2-(2-acetamido-3-(2-ethyldisulfanyl)propanamido)-N-(2-cyanobenzo[d]thiazol-6-yl)-6-(5-(2-oxo-hexahydro-1H-thieno[3,4-d]imidazol-4-yl)pentanamido)hexanamide |
| Compound 8 | 2-(2-(2-(2-(2-(2-acetamido-5-guanidinopentanamido)-3-methylbutanamido)-5-guanidinopentanamido)-5-guanidinopentanamido)-3-(2-tert-butyldisulfanyl)propanamido)-N-(2-cyanobenzo[d]thiazol-6-yl)-6-(5-(2-oxo-hexahydro-1H-thieno[3,4-d]imidazol-4-yl)pentanamido)hexanamide |
| Compound 9 | Ac-RVRRC(StBu)K(FITC)-CBT |
| Compound 9-Scr | Ac-RK(FITC)RC(StBu)RV-CBT |
Acknowledgements
The authors thank Dr. Richard Chin at Stanford Nanocharacterization Laboratory for the technical assistance with TEM experiments, Dr. Stephen R. Lynch at the NMR Facility of Stanford Chemistry Department for help with the HMBC 2D NMR experiment, and John Perrino at the Cell Sciences Imaging Facility of Stanford University for electron microscope imaging, and Dr. Anca Dragulescu-Andrasi for help with the furin immunofluorescence staining. This work has been supported by a grant from NIGMS (R01GM086196-01) and an IDEA award from Department of Defense Breast Cancer Research Program (W81XWH-09-1-0057).
Footnotes
Author contributions
G. L. and J. R. conceived and designed the experiments: G. L. and H. R. performed the experiments: G. L. and J. R. analyzed the data: G. L. and J. R. co-wrote the paper.
References
- 1.Whitesides GM, Mathias JP, Seto CT. Molecular self-assembly and nanochemistry: A chemical strategy for synthesis of nanostructure. Science. 1991;254:1312–1319. doi: 10.1126/science.1962191. [DOI] [PubMed] [Google Scholar]
- 2.Lehn JM. Perspectives in supramolecular chemistry-from molecular recognition towards molecular information-processing and self-organization. Angew. Chem. Int. Ed. 1990;29:1304–1319. [Google Scholar]
- 3.Estroff LA, Hamilton AD. Water gelation by small organic molecules. Chem. Rev. 2004;104:1201–1217. doi: 10.1021/cr0302049. [DOI] [PubMed] [Google Scholar]
- 4.Silva GA, et al. Selective differentiation of neural progenitor cells by high-epitope density nanofibers. Science. 2004;303:1352–1355. doi: 10.1126/science.1093783. [DOI] [PubMed] [Google Scholar]
- 5.Petka WA, Harden JL, McGrath KP, Wirtz D, Tirrell DA. Reversible hydrogels from self-assembling artificial proteins. Science. 1998;281:389–392. doi: 10.1126/science.281.5375.389. [DOI] [PubMed] [Google Scholar]
- 6.Yang Z, Liang G, Xu B. Enzymatic hydrolation of small molecules. Acc. Chem. Res. 2008;41:315–326. doi: 10.1021/ar7001914. [DOI] [PubMed] [Google Scholar]
- 7.Saxon E, Bertozzi CR. Cell surface engineering by a modified Staudinger reaction. Science. 2000;287:2007–2010. doi: 10.1126/science.287.5460.2007. [DOI] [PubMed] [Google Scholar]
- 8.Laughlin ST, Baskin JM, Amacher SL, Bertozzi CR. In vivo imaging of membrane-associated glycans in developing zebrafish. Science. 2008;320:664–667. doi: 10.1126/science.1155106. [DOI] [PMC free article] [PubMed] [Google Scholar]
- 9.Kolb HC, Finn MG, Sharpless KB. Click chemistry: diverse chemical function from a few good reactions. Angew. Chem. Int. Ed. 2001;40:2004–2021. doi: 10.1002/1521-3773(20010601)40:11<2004::AID-ANIE2004>3.0.CO;2-5. [DOI] [PubMed] [Google Scholar]
- 10.Link AJ, Tirrell DA. Cell surface labeling of Escherichia coli via copper (I)-catalyzed [3+2] cycloaddition. J. Am. Chem. Soc. 2003;125:11164–11165. doi: 10.1021/ja036765z. [DOI] [PubMed] [Google Scholar]
- 11.Agard NJ, Prescher JA, Bertozzi CR. A strain-promoted [3+2] azide-alkyne cycloaddition for covalent modification of biomolecules in living systems. J. Am. Chem. Soc. 2004;126:15046–15047. doi: 10.1021/ja044996f. [DOI] [PubMed] [Google Scholar]
- 12.Hsu T-L, et al. Alkynyl sugar analogs for labeling and visualization of glycoconjugates in cells. Proc. Natl. Acad. Sci. USA. 2007;104:2614–2619. doi: 10.1073/pnas.0611307104. [DOI] [PMC free article] [PubMed] [Google Scholar]
- 13.Mahal LK, Yarema KJ, Bertozzi CR. Engineering chemical reactivity on cell surfaces through oligosaccharide biosynthesis. Science. 1997;276:1125–1128. doi: 10.1126/science.276.5315.1125. [DOI] [PubMed] [Google Scholar]
- 14.Zeng Y, Ramya TNC, Dirksen A, Dawson PE, Paulson JC. High-efficiency labeling of sialylated glycoproteins on living cells. Nat. Methods. 2009;6:207–209. doi: 10.1038/nmeth.1305. [DOI] [PMC free article] [PubMed] [Google Scholar]
- 15.White EH, McCapra F, Field GF, McElroy WD. The structure and synthesis of firefly luciferin. J. Am. Chem. Soc. 1961;83:2402–2403. [Google Scholar]
- 16.Ren H, et al. A biocompatible condensation reaction for labeling of terminal cysteine on proteins. Angew. Chem. Int. Ed. 2009 doi: 10.1002/anie.200903627. In press. [DOI] [PMC free article] [PubMed] [Google Scholar]
- 17.Okada K, Iio H, Kubota I, Goto T. Firefly bioluminescence III. Conversion of oxyluciferin to luciferin in firefly. Tetrahedron Lett. 1974;32:2771–2774. [Google Scholar]
- 18.Gomi K, Kajiyama N. Oxyluciferin, a luminescence product of firefly luciferase, is enzymatically regenerated into luciferin. J. Biol. Chem. 2001;276:36508–36513. doi: 10.1074/jbc.M105528200. [DOI] [PubMed] [Google Scholar]
- 19.Thomas G. Furin at the cutting edge: From protein traffic to embryogenesis and disease. Nat. Rev. Mol. Cell Biol. 2002;3:753–766. doi: 10.1038/nrm934. [DOI] [PMC free article] [PubMed] [Google Scholar]
- 20.Jagasia R, Holub JM, Bollinger M, Kirshenbaum K, Finn MG. Peptide cyclization and cylcodimerization by Cu+-mediated azide-alkyne cycloaddition. J. Org. Chem. 2009;74:2964–2974. doi: 10.1021/jo802097m. [DOI] [PMC free article] [PubMed] [Google Scholar]
- 21.Punna S, Kuzelka J, Wang Q, Finn MG. Head-to-tail peptide cyclodimerization by copper-catalyzed azide-alkyne cycloaddition. Angew. Chem. Int. Ed. 2005;44:2215–2220. doi: 10.1002/anie.200461656. [DOI] [PubMed] [Google Scholar]
- 22.Hosaka M, et al. Arg-X-Lys/Arg-Arg motif as a signal for precursor cleavage catalyzed by furin. J. Biol. Chem. 1991;266:12127–12130. [PubMed] [Google Scholar]
- 23.Talanian RV, et al. Substrate specificities of caspase family proteases. J. Biol. Chem. 1997;272:9677–9682. doi: 10.1074/jbc.272.15.9677. [DOI] [PubMed] [Google Scholar]
- 24.Yang ZM, Xu KM, Guo ZF, Guo ZH, Xu B. Intracellular enzymatic formation of nanofibers results in hydrogelation and regulated cell death. Adv. Mater. 2007;17:3152–3156. [Google Scholar]
- 25.Shapiro J, et al. Localization of endogenous furin in cultured cell lines. J. Histochem. Cytochem. 1997;45:3–12. doi: 10.1177/002215549704500102. [DOI] [PubMed] [Google Scholar]
- 26.Henrich S, et al. The crystal structure of the proprotein processing proteinase furin explains its stringent specificity. Nat. Struct. Biol. 2003;10:520–526. doi: 10.1038/nsb941. [DOI] [PubMed] [Google Scholar]
- 27.Bassi DE, Fu J, de Cicco RL, Klein-Szanto AJP. Proprotein convertases: “Master switches” in the regulation of tumor growth and progression. Mol. Carcinog. 2005;44:151–161. doi: 10.1002/mc.20134. [DOI] [PubMed] [Google Scholar]
- 28.Cheng M, et al. Pro-protein convertase gene expression in human breast cancer. Int. J. Cancer. 1997;71:966–971. doi: 10.1002/(sici)1097-0215(19970611)71:6<966::aid-ijc10>3.0.co;2-4. [DOI] [PubMed] [Google Scholar]
- 29.Tandon AK, Clark GM, Chamness GC, Chirgwin JM, McGuire WL. Cathepsin-D and prognosis in breast cancer. New Eng. J. Med. 1990;322:297–302. doi: 10.1056/NEJM199002013220504. [DOI] [PubMed] [Google Scholar]
- 30.Yan SQ, Sameni M, Solane BF. Cathepsin B and human tumor progression. Biol. Chem. 1998;379:113–123. [PubMed] [Google Scholar]
- 31.Dragulescu-Andrasi A, Liang GL, Rao J. In vivo bioluminescence imaging of furin activity in breast cancer cells using bioluminogenic substrates. Bioconjugate Chem. 2009;20:1660–1666. doi: 10.1021/bc9002508. [DOI] [PMC free article] [PubMed] [Google Scholar]
Associated Data
This section collects any data citations, data availability statements, or supplementary materials included in this article.


