Abstract
Structural and functional abnormalities in tumor blood vessels impact the delivery of oxygen and nutrients to solid tumors, resulting chronic and cycling hypoxia. While chronically hypoxic regions exhibit treatment resistance, more recently it has been shown that cycling hypoxic regions acquire pro-survival pathways. Angiogenesis inhibitors have been shown to transiently normalize the tumor vasculatures and enhance tumor response to treatments. However, the effect of anti-angiogenic therapy on cycling tumor hypoxia remains unknown. Using electron paramagnetic resonance imaging (EPRI) and magnetic resonance imaging (MRI) in tumor bearing mice, we have examined the vascular re-normalization process by longitudinally mapping tumor partial pressure of oxygen (pO2) and microvessel density during treatments with a multi-tyrosine kinase inhibitor sunitinib. Transient improvement in tumor oxygenation was visualized by EPRI 2–4 days following anti-angiogenic treatments, accompanied by a 45% decrease in microvessel density. Radiation treatment during this time period of improved oxygenation by anti-angiogenic therapy resulted in a synergistic delay in tumor growth. Additionally, dynamic oxygen imaging obtained every 3 minutes was conducted to distinguish tumor regions with chronic and cycling hypoxia. Sunitinib treatment suppressed the extent of temporal fluctuations in tumor pO2 during the vascular normalization window, resulting in the decrease of cycling tumor hypoxia. Overall, the findings suggest that longitudinal and noninvasive monitoring of tumor pO2 makes it possible to identify a window of vascular renormalization to maximize the effects of combination therapy with anti-angiogenic drugs.
Keywords: anti-angiogenic therapy, cycling hypoxia, EPR imaging, radiotherapy, vascular normalization
Introduction
Tumors can grow up to 2–3 mm3 in size by relying on passive supplies of nutrients and oxygen. For further growth, tumors activate angiogenesis pathways to develop new vascular networks (1). In normal processes such as wound healing, angiogenesis is tightly regulated and creates a balance between pro- and anti-angiogenic factors. However in tumors, the balance is tilted toward promoting angiogenesis, causing the development of architecturally and functionally abnormal vasculature (2–3). The aberrant tumor blood vessel is neither as efficient nor well organized in delivering oxygen and nutrients (4–6). The consequent hypoxic and acidotic microenvironment diminishes tumor responsiveness to treatments (7).
Tumor hypoxia can be categorized into two types; chronic or cycling hypoxia. Chronic hypoxia exists in tumor regions beyond the diffusion distance of oxygen. Longitudinal oxygen gradient, where the vascular oxygen concentration remains low, in tumor blood vessels makes the radial oxygen diffusion distance shortened, leading to chronic hypoxia (8). Cycling hypoxia, also known as acute or intermittent hypoxia, has been attributed to fluctuations in tumor perfusion and erythrocyte flux (9–10). Chaplin et al. reported in preclinical studies that at least 20% of solid tumor cells experience cycling hypoxia (11). One consequence of cycling hypoxia is increased resistance to treatments by conferring tumor cells and endothelial cells of tumor blood vessels with enhanced pro-survival pathways (12–13). These observations make cycling hypoxia a common hallmark existing in a tumor microenvironment. Baudelet et al. have noninvasively observed the characteristic fluctuations of T2* (transversal relaxation time)-weighted magnetic resonance imaging (MRI) signal in solid tumors attributed to physiological noise which in turn may correlate with instability of tumor oxygenation (14). These fluctuations were suppressed by treatments including carbogen combined with nicotinamide and flunarizine. Although the signal interpretation of T2* -weighted MRI is complex with regard to the absolute value of partial pressure of oxygen (pO2), such non-invasive and longitudinal imaging approaches to study the temporal dynamics of pO2 would be useful to identify effective treatments targeting cycling tumor hypoxia.
Anti-angiogenic drugs have been shown to exhibit efficacy in selectively destroying tumor blood vessels in experimental animals and in humans (1). Though as a monotherapy, anti-angiogenic agents yielded modest success in human trials, they are being explored in combination therapies with cytotoxic cancer therapies (15–16). While decrease in delivery of oxygen and therapeutics to the tumor should be expected on anti-angiogenic treatments, numerous reports point to the significant benefit in patient survival when used with chemotherapy or radiotherapy, suggesting an improvement of tumor oxygenation and perfusion (17–19). To explain this paradox, Jain and colleagues put forward a hypothesis that tumor vasculature transiently normalizes during the course of anti-angiogenic treatments, where the immature and ineffective vessels get pruned, making the residual vessels structurally competent with improved function (20). Further research was carried out to serially monitor changes in the vascular normalization process that identify a window, in which chemotherapy or radiotherapy was delivered with maximal therapeutic gain (17, 21–22). A major challenge identified in this effort is the development of non-invasive imaging biomarkers of the vascular normalization process in tumors (20). Optimization of anti-angiogenic therapies is complicated by the fact that these agents are not directly cytotoxic to malignant cells, making tumor growth kinetics an unreliable approach to identify the vascular normalization window (23). Useful criteria for an imaging modality would be non-invasive and capable of longitudinally monitoring tumor physiology, and would provide a surrogate quantitative biomarker for tumor blood flow/perfusion (18, 20, 22).
Electron paramagnetic resonance (EPR) is a spectroscopic technique similar to nuclear magnetic resonance imaging (MRI) but detects paramagnetic species. Recent availability of triarylmethyl radical (TAM) derivatives as in vivo-compatible paramagnetic tracers made EPR imaging (EPRI) capable of mapping tissue pO2 (24–25). The sequential imaging with EPRI for tissue oxygen and conventional MRI for anatomy in a system operating at a common resonance frequency provides anatomically overlaid pO2 maps with tumor micro-vessel density maps (25). In the present study, we report the results from the imaging experiments monitoring tumor pO2 to identify the tumor vascular re-normalization window and optimize sequence of combination therapy of anti-angiogenic drugs and radiation. The “normalization window” in tumor oxygenation in response to anti-angiogenic treatment was non-invasively visualized, and radiation treatment during this narrow time period resulted in synergistic tumor growth delay. Further, the temporal resolution of EPRI made it feasible to obtain three-dimensional (3D) pO2 maps every 2–3 minutes and enabled to distinguish the phenomenon of cycling hypoxia (12, 26). The results show that the consequence of sunitinib treatment is a decrease in the extent of cycling hypoxia in tumors.
Methods
Tumor implantation
We established SCCVII tumors (obtained from Dr. T. Phillips, UCSF, San Francisco, CA and was tested in 2011 by RADIL using a panel of microsatellite markers) in mouse hind leg as described previously (25). Tumor bearing female C3H mice were treated daily with oral administration of 50 mg sunitinib (LC Laboratories) per kg body weight 6 or 10 days after tumor implantation. X-ray irradiation (10 Gy) was delivered 6 or 10 days after tumor implantation using an XRAD-320 (Precision X-ray Inc.) with or without pretreatment of sunitinib. We carried out all our procedures in compliance with the Guide for the care and use of laboratory animal resources (National Research Council, 1996), and experimental protocols were approved by the National Cancer Institute Animal Care and Use Committee.
EPRI for pO2
Technical details of the EPR scanner and oxygen image reconstruction were described in Supplemental Data 1. Parallel coil resonators tuned to 300 MHz were used for EPRI and MRI. After the animal was placed in the resonator, TAM (1.125 mmol/kg bolus) was injected intravenously under isoflurane anesthesia. The repetition time (TR) was 6.0 µs. The free induction decay (FID) signals were collected following the radiofrequency (RF) excitation pulses under a nested looping of the x, y, z gradients and each time point in the FID underwent phase modulation enabling 3D spatial encoding. Since FIDs last for 1–5 microseconds, it is possible to generate a sequence of T2* maps i.e. EPR line width maps, which linearly correlate with local concentration of oxygen and allows pixel-wise estimation of pO2.
MRI for anatomy and blood volume
MRI scans were conducted using a 7 T scanner (Bruker BioSpin MRI GmbH). T2-weighted anatomical images were obtained using a fast spin echo sequence (RARE) with an echo time (TE) of 13 ms, TR of 2500 ms, RARE factor 8, and resolution of 0.125 × 0.125 mm. For convenience of coregistration with EPRI, all MRI images had the same slice thickness of 2 mm and field of view (FOV) of 3.2 cm with 16 slices or 2.8 cm FOV with 14 slices. For blood volume calculation, spoiled gradient echo (SPGR) sequence images were collected before and 5 min after ultrasmall superparamagnetic iron oxide (USPIO, from BioPal Inc, colloidal size of 30 ns) injection (1.2 µL /g body weight) with the following parameters: matrix = 256 × 256; TE = 5.4 ms; TR = 250 ms. The percentage of tumor blood volume was estimated as described previously (27). Co-registration of EPRI and MRI images was accomplished using code written in MATLAB (Mathworks) as described previously (25).
Immunohistochemical analysis
Tumor tissues were excised on hour after intravenous injection of a pimonidazole (60 mg/kg). Tumor tissues were fixed with 4% paraformaldehyde and frozen, and 10 µm thick sections were obtained. After blocking non-specific binding sites, the slides were covered by CD31 antibody (BD Biosciences, San Jose, CA; 1:250) combined with αSMA antibody (Abcam Inc., Cambridge, MA; 1:250) or rabbit anti-pimonidazole antisera (Natural Pharmacia International, Inc., Burlington, MA; 1:250) overnight at 4°C. The sections were incubated with Alexa Fluor 488 anti-rat and Alexa Fluor 555 anti-rabbit secondary antibody (Invitrogen, Carlsbad, CA; 1:500).
Statistical analysis
All results were expressed as the mean ± SEM. The differences in means of groups were determined by student t-test. The minimum level of significance was set at P<0.05.
Results
Tumor pO2 can be non-invasively and longitudinally monitored by EPRI
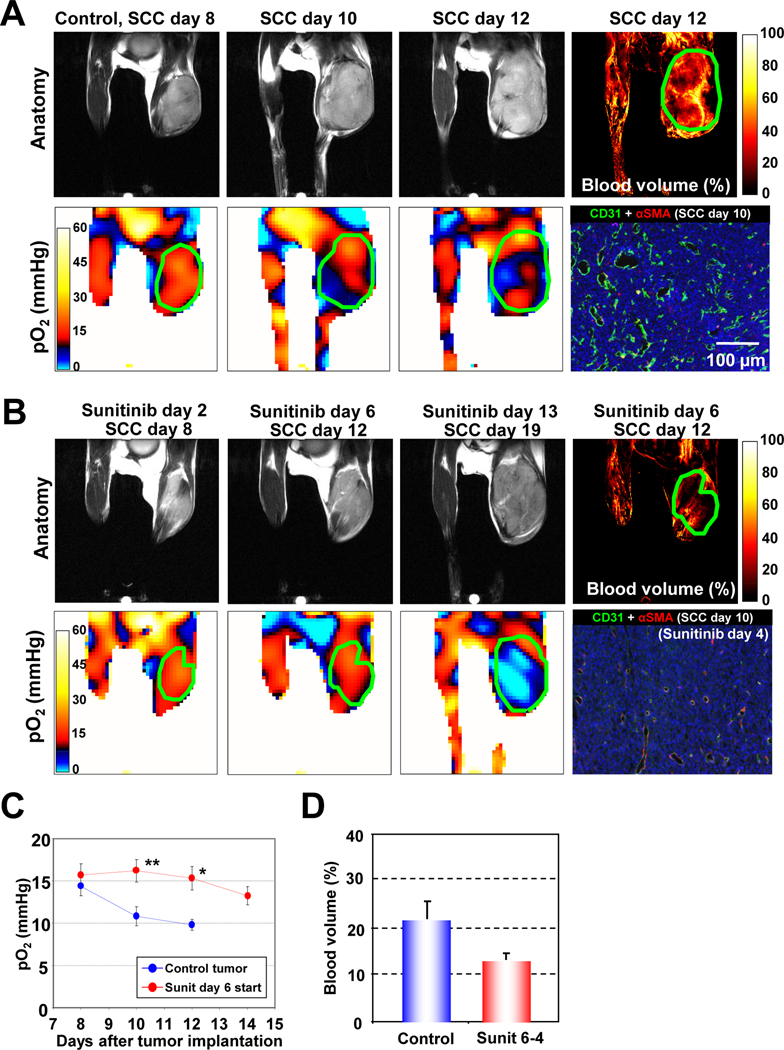
The collisional interaction between molecular oxygen and the paramagnetic TAM leads to broadening of the EPR spectral line widths of TAM. By extracting the pO2-dependent EPR line width distribution of TAM, an in vivo pO2 map can be generated where TAM is present at detectable levels (25). Figure 1A (top row) shows anatomic images taken on days 8, 10, and 12 and an image representing the microvessel density (MRI) taken on day 12 of a squamous cell carcinoma (SCC) tumor bearing control (untreated) mouse. The corresponding pO2 maps from the same time points are shown in Figure 1A (bottom), along with an independent immunohistochemical analysis of microvessel density (CD31, green) and pericytes (αSMA, red). Longitudinal pO2 imaging showed that the extent of hypoxia increased with tumor size. The hypoxic fraction (pO2 <10 mmHg) was 24.2 ± 6.8% on day 8 and increased to 40.9 ± 6.1% and 47.4 ± 8.3% on days 10 and 12, respectively. Blood volume images obtained by MRI using the blood pool contrast agent USPIO as an in vivo marker of microvessel density (27) showed substantial vascularization in this tumor. However, immunohistochemical analyses indicated that the tumor blood vessels had inadequate pericyte coverage, suggesting inefficient oxygen delivery by these vessels (4, 6), consistent with the hypoxic nature of this tumor.
Figure 1.
Longitudinal and non-invasive monitoring of tumor pO2 by EPRI and effects of anti-angiogenic drug. (A) MRI anatomic images (top row) and EPR oxygen images (bottom row) of a C3H mouse, bearing a SCC VII tumor at the right leg, show an increasing hypoxic region (pO2 <10 mmHg, blue color) along with its growth. Blood volume image by MRI with USPIO revealed promoted angiogenesis in this tumor (top right panel). Immunohistochemical analysis (bottom right panel) confirmed a high density of microvasculature (CD31, green), which is poorly covered with perivascular cells (αSMA, red). (B) Antiangiogenic treatment with sunitinib, initiated at the early stage of tumor, delayed SCC tumor growth. Tumor pO2 levels were transiently higher than the day-matched control tumors during the 2–6 days after daily sunitinib treatment, in spite of the ~40 % reduction in tumor blood volume (third row). Histology (bottom left panel) showed a significant reduction in microvascular density without changing the number of perivascular cells. (C) pO2 changes in tumors in sunitinib treated (red circles) and untreated (blue circles) mice. *P <0.05, **P <0.01. (D) Blood volume in SCC tumors in control and sunitinib treated mice.
Early treatment with an anti-angiogenic drug delays progression of tumor hypoxia
In earlier preclinical studies with anti-angiogenic drugs, a renormalization of tumor vasculature along with a transient improvement in oxygen status was observed (17, 22). We hypothesized that if the vascular normalization is occurred by sunitinib treatment, tumor oxygenation improves simultaneously with reduced vascular microvessel density under the assumption of unchanged cellular oxygen consumption. To non-invasively study this phenomenon, daily sunitinib treatment was initiated at an early stage before tumors became hypoxic (6 days after SCC tumor implantation, hypoxic fraction <3%). In mice receiving early anti-angiogenic treatment initiation, sunitinib significantly delayed the SCC tumor growth (Figure. 1B). When the pO2 status and microvessel density were evaluated by consecutive EPRI and MRI scans, a different pattern emerged. The pO2 levels in treated tumors were transiently higher compared to untreated mice (P <0.01) followed by a monotonous decrease (Figure 1C), whereas approximately 40% reduction in the microvessel density as assessed by MRI (Figure 1D) and immunohistochemistry (Figure 1B bottom) was observed after 2–6 days of sunitinib treatment. The increase in tumor pO2, which was accompanied by a decrease in microvascular density, after sunitinib treatment compared to untreated controls may be attributed to a phenomenon known as transient vascular renormalization, where the delivery of nutrients including oxygen improves as a result of pruning immature blood vessels and the subsequent recruitment of pericytes (19, 22). Further continuation of sunitinib treatment resulted in hypovascularity for up to 2 weeks after initiating treatment, at which time the tumors became severely hypoxic compared with the size-matched control tumors.
Anti-angiogenic treatment at a later stage improves tumor oxygenation by vascular normalization
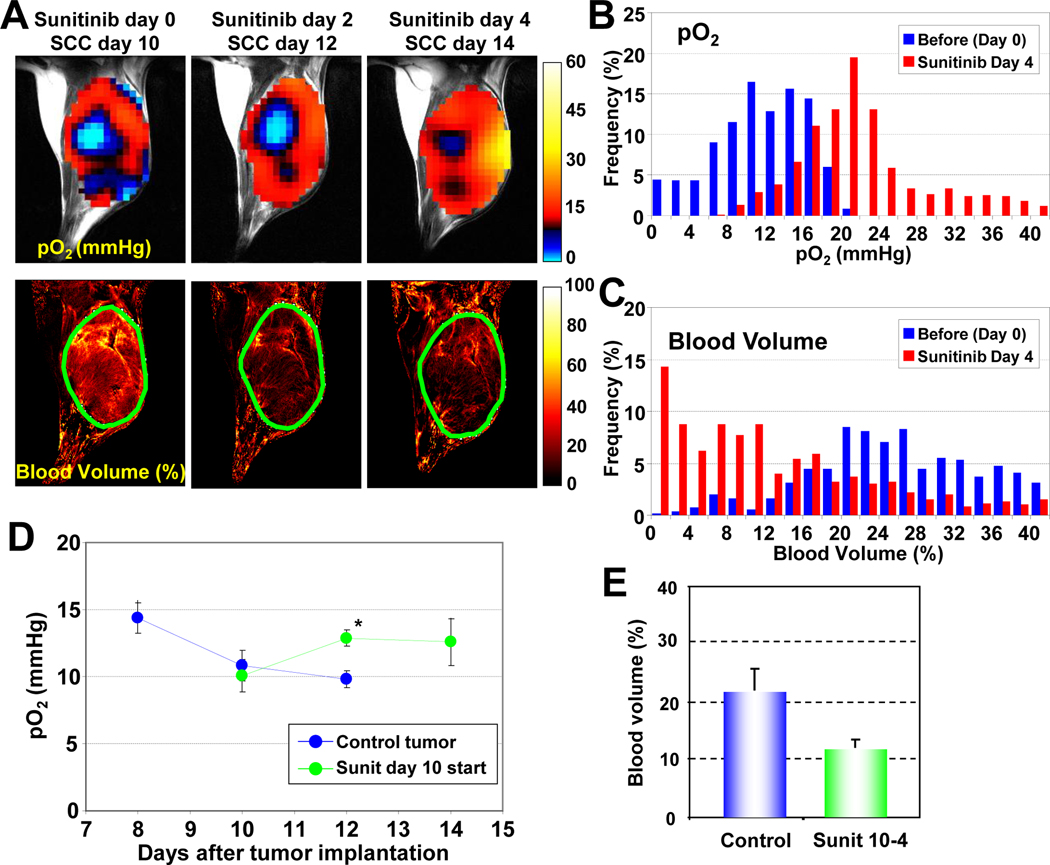
In addition to vascular normalization, sunitinib-induced suppression of tumor growth might contribute to the improved tumor oxygenation. To investigate this, sunitinib treatment was initiated at a later stage (SCC day 10), when the tumors became significantly hypoxic (hypoxic fraction ~35%). Figure 2 shows images of tumor pO2 and microvessel density from SCC tumors treated with sunitinib 10 days after tumor implantation. Day 0 corresponds to images before treatment. The other images were taken on days 2 and 4 after initiating sunitinib treatment. Even in this tumor which had significant hypoxic regions, tumor oxygen levels increased 2 and 4 days after sunitinib treatment compared with oxygen level before treatment (Figure 2A top). It should be noted that no significant change in tumor size occurred during these time points (835 ± 44 mm3 before treatment and 822 ± 89.5 mm3 4 days after treatment), despite a 45% reduction in tumor blood volume (Figure 2A bottom and 2E). In frequency histograms of this tumor, a right shift of tumor pO2 was observed (Figure 2B) with a concomitant left shift of the blood vessel density (Figure 2C). The transient increase in tumor pO2 was quantified (Figure 2D), as was the loss in microvessel density (Figure 2E).
Figure 2.
Tumor pO2 and blood volume imaging before and after anti-angiogenic treatment initiated at the later stage of tumor. (A) Initiation of anti-angiogenic treatment at the later stage of tumor improved tumor oxygenation (top row) and reduced tumor blood volume (bottom row) without a significant change in tumor size. (B–C) Frequency histograms (percentage of voxels with a given pO2 and blood volume) before and 4 days after anti-angiogenic treatment showed a clear right shift in pO2, but a shift in blood volume. (D) Quantitation of pO2 changes in sunitinib treated and control mice. *P <0.05. (E) Tumor blood volume decreased ~45% 4 days after treatment initiated at the later stage of tumor.
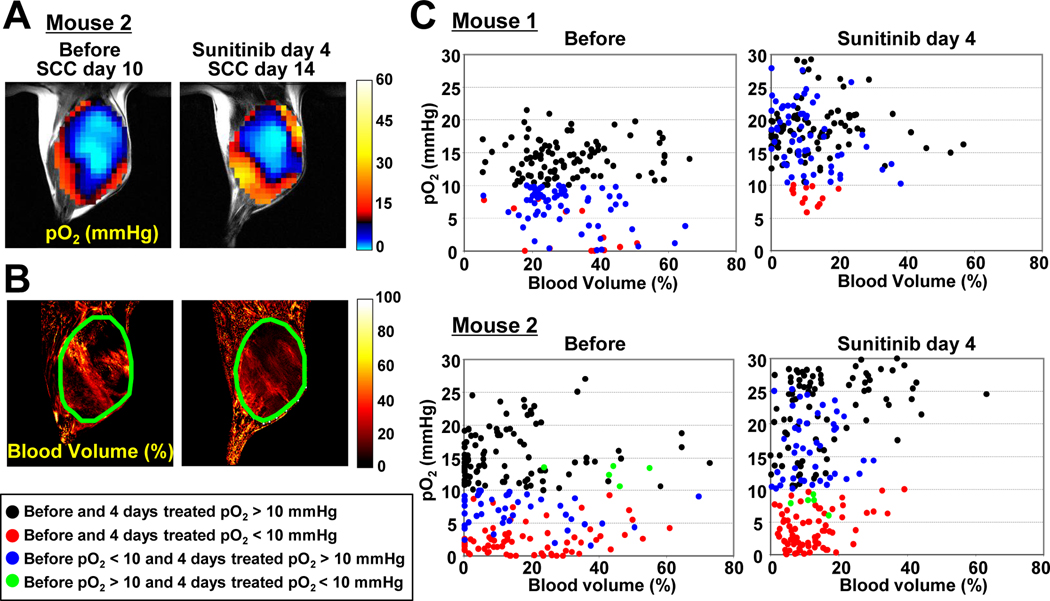
In two instances (Figure 2A and 3A), the tumor size and shape difference between before and 4 days after sunitinib treatment was less than 3%. This permitted monitoring individual voxel-based changes in pO2 (Figure 3A) and blood volume (Figure 3B) before and after sunitinib treatment. In the scatter plot of data from these two experiments (Figure 3C), a left shift of the data in each row from the untreated (left column) to the treated (right column) indicates a decrease in tumor microvessel density and an upward shift of the data from the left column to the right column in each row would indicate an improvement in tumor pO2. The analyzed data were classified into four groups based on pO2 levels before and after sunitinib treatment as follows: 1) pO2 >10 mmHg before and after treatment (black circles) which may represent tumor regions which are normoxic and covered with functional vessels; 2) pO2 levels <10 mmHg before and after sunitinib treatment which may represent hypoxic regions whose vasculature was not responsive to sunitinib treatment (red circles); 3) pO2 <10 mmHg before and >10 mmHg after sunitinib treatment (blue circles) which may represent regions with normalized vasculature after sunitinib treatment; and 4) pO2 >10 mmHg before and <10 mmHg after sunitinib treatment (green circles), regions where sunitinib may have destroyed the vasculature substantially such that the effect of the hypovasculature may have overwhelmed the beneficial effect of vascular normalization. The results from mouse 1 (the same mouse shown in Figure 2) showed that a significant fraction of pixels in the tumor which were hypoxic prior to sunitinib treatment (blue circles) displayed pO2 increase to a level >10 mmHg with a concomitant decrease in blood vessel density. In addition, the average pO2 values of all groups showed an increase, suggesting a global vascular normalization in the tumor (Supplemental Data 2). Similar results were observed in mouse 2 (Figure 3C), but the improvement in tumor pO2 was relatively limited and also some regions of significant hypoxia were established after treatment (green circles).
Figure 3.
Voxel-based trace of changes in (A) tumor pO2 and (B) blood volume of representative 2 mice, where the tumor size and shape were the same before and 4 days after sunitinib treatment initiated 10 days after tumor implantation. (C) Scatter plots of pO2 vs. blood volume in before (left column) and sunitinib treated (right column) mice. The data were classified into four groups: 1) pO2 >10 mmHg before and after 4 days sunitinib treatment (black symbols), 2) pO2 <10 mmHg before and after treatment (red), 3) pO2 <10 mmHg before and pO2 >10 mmHg after treatment (blue), 4) pO2 >10 mmHg before and pO2 <10 mmHg after treatment (green).
Vascular normalization with sunitinib increases oxygen diffusion distance and reduces hypoxic fraction in tumors
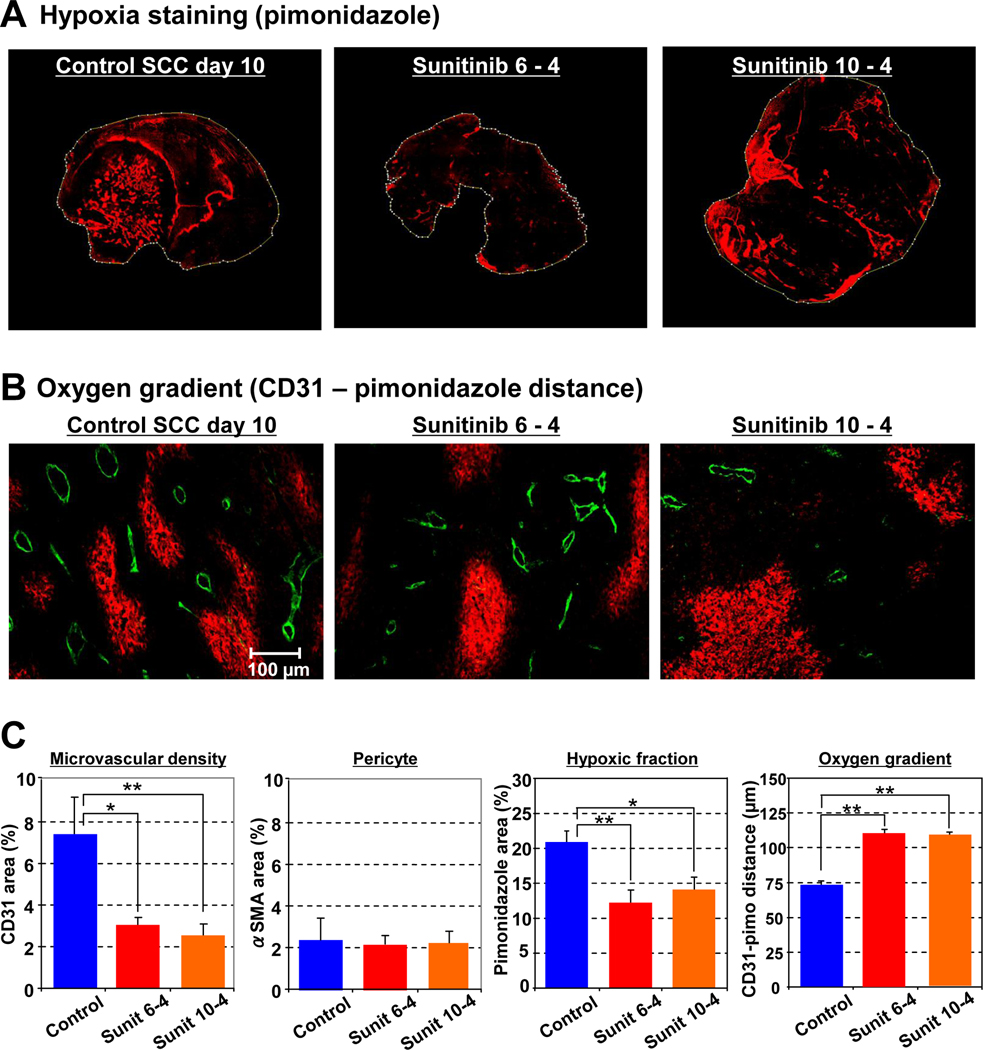
The non-invasive observation of transiently improved tumor oxygenation by EPRI after anti-angiogenic treatment was further validated by histological analysis. Immunohistochemical evaluation of pimonidazole (Figure 4A), a hypoxia marker, shows that the hypoxic fraction of SCC tumors decreased by 9% and 7% after 4 days of sunitinib treatment initiated at days 6 and 10 respectively. Microvascular density (CD31 staining, Figure 4B) decreased 40% 4 days after sunitinib treatment, whereas no significant change was observed in the number of pericytes (αSMA, Figure 4C). The average distance between microvessels (CD31) and the edge of hypoxic regions (pimonidazole) was measured to represent oxygen gradient distance, and was determined to be 75 µm in untreated control tumors, which increased to 110 µm 4 days after sunitinib treatment (Figure 4B and 4C). These histological results are consistent with previous observations and support non-invasive assessment of transient vascular normalization and resultant improvement of tumor oxygenation after anti-angiogenic treatment.
Figure 4.
Vascular normalization with sunitinib increases oxygen diffusion distance and reduces hypoxic fraction in tumors (A) Immunostaining of hypoxia marker pimonidazole of representative tumors. Left: untreated control (SCC day 10), middle: 4 days after sunitinib treatment initiated on SCC day 6, right: 4 days after sunitinib treatment initiated on SCC day 10. (B) Double staining of endothelial cell (CD31, green) and hypoxia (pimonidazole, red) shows elongated oxygen gradients after 4 days sunitinib treatment. (C) Summary of immunohistochemical analysis. *P <0.05, **P <0.01.
Transient increase in tumor oxygenation by anti-angiogenic treatment enhances outcome of radiotherapy
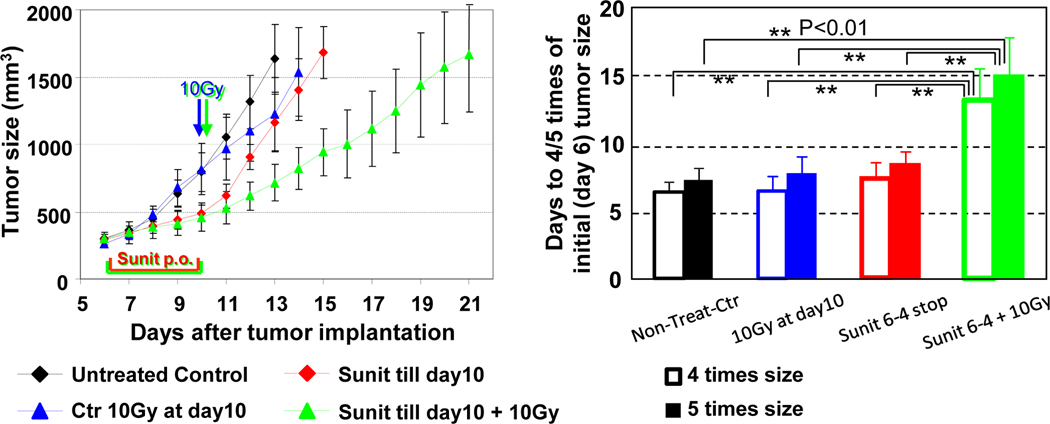
As hypoxic cells show resistance to radiation, a transient increase in tumor oxygenation has a potential to improve treatment effect of radiation. A combination of 10 Gy radiation at the end of 4 days sunitinib treatment synergistically delayed the tumor growth (8 days) compared to monotherapy of radiation (2 days delay) or 4 days sunitinib treatment (2 days delay, Figure 5). Collectively, microenvironmental changes resulting from normalization of tumor blood vessels by anti-angiogenic treatment contributed to the augmented efficacy of radiotherapy during the window of improved tumor oxygenation that can be directly monitored with EPRI.
Figure 5.
Transient increase in tumor oxygenation by anti-angiogenic treatment enhances outcome of radiotherapy. Tumor growth kinetic study was carried out on groups of tumor bearing mice which include untreated control (black symbol), single 10 Gy radiation at SCC day 10 (blue), 4 days sunitinib treatment during 6–10 days after SCC implantation (red), 4 days sunitinib followed by single 10 Gy radiation (green).
Vascular normalization with sunitinib suppresses cycling hypoxia
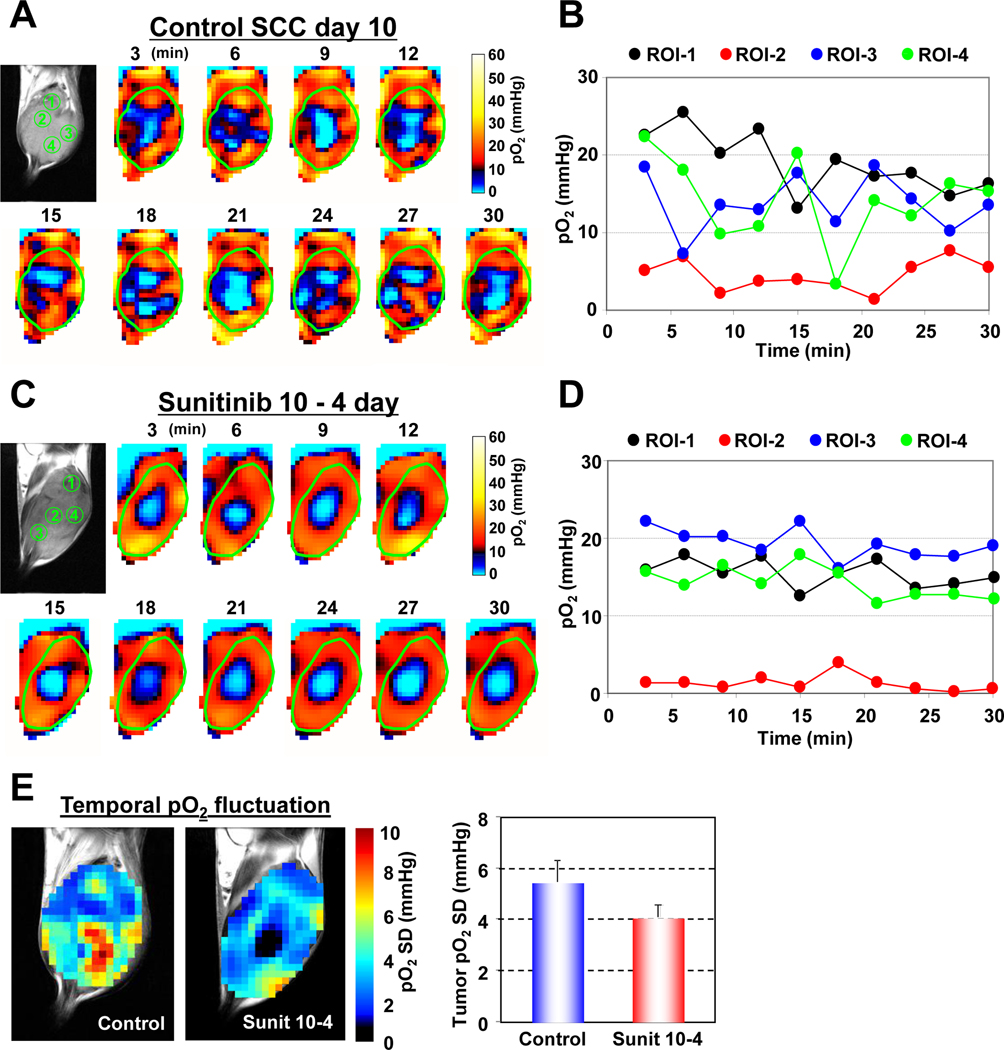
In recent studies (12, 26), the temporal fluctuations of tumor pO2 in the various tumor sub-regions was examined to distinguish chronically hypoxic tumor regions from transiently hypoxic regions, a phenomenon known as “cycling hypoxia”. It was found that there was a significant spatio-temporal heterogeneity in the dynamics of tumor pO2. To examine the effect of anti-angiogenic agents in modifying these spatio-temporal fluctuations in tumor pO2, dynamic oxygen imaging experiments were carried out in treated and untreated mice. Figure 6A shows a series of “snap shot” EPRI images taken every 3 minutes over a period of 30 minutes in untreated animals. For the 4 regions of interest marked ROI-1 – ROI-4, the temporal pO2 changes are displayed in Figure 6B. The results show that there were no significant temporal fluctuations in ROI-2, typical of chronically hypoxic regions whereas ROIs 1, 3, and 4 displayed features characteristic of cycling hypoxia with pO2 fluctuations ~20 mmHg were noticed. When similar experiments were carried out on sunitinib treated animals and the various ROIS examined (Figure 6C), it can be seen that in addition to the chronically hypoxic region, ROI-2 which displays steady levels of pO2 <10 mmHg, ROIs 1, 3, and 4 show an improved and more stable pO2 levels (Figure 6D). Similar results were obtained in four independent mice for both untreated and sunitinib treated groups. Figure 6E shows standard deviations of tumor pO2 (pO2 SD) maps of the treated and untreated mice calculated from the 10 images taken in the 30-minute time window. This parametric image can visualize the locations and extent of temporal pO2 fluctuations, and regions with high pO2 SD (> 6 mmHg) was observed in the large majority of untreated tumors whereas limited area of high pO2 SD in sunitinib-treated tumors. Averaged pO2 SD values in tumor regions decreased by 25% 4 days after sunitinib treatment compared with size-matched untreated control tumors (Figure 6E, right). This observation from EPRI experiments provides new information that the vascular normalization by anti-angiogenic treatment minimizes cycling hypoxia resulting from temporal pO2 instability.
Figure 6.
Vascular normalization with sunitinib improves cycling hypoxia in SCC tumors. (A) Dynamic 3D EPRI images obtained every 3 minutes non-invasively visualized fluctuating pO2 in an untreated control SCC tumor. (B) Four regions of interest ROIs 1–4 were selected and the pO2 fluctuations were plotted. (C) In independent experiment, 4 days of sunitinib treatment reduced extent of temporal fluctuations in tumor pO2. (D) Temporal pO2 fluctuations in ROIs 1–4 were plotted. (E) Standard deviation of pO2 fluctuation in tumor calculated from sequential 10 scans for 30 min measurement time.
Discussion
The transient vascular normalization resulting from anti-angiogenic cancer treatments presents a window of opportunity to augment treatment with radiation and/or chemotherapy to realize additive or synergistic responses in treatment (20–22). Non-invasive imaging biomarkers that can quantitatively and longitudinally monitor physiological changes in tumor microenvironment in response to anti-angiogenic therapies will be of significant value where the classic endpoints in cancer treatment such as tumor shrinkage may not apply (23, 28). Such capabilities will be especially useful when planning combination therapies (1, 22). By utilizing the image contrast provided by molecular oxygen to a paramagnetic tracer such as TAM, EPRI can provide quantitative maps of tissue pO2, a key determinant of radiotherapy. Anatomic guidance with MRI allows the spatial co-registration of tissue/tumor oxygenation in a straight forward manner (25).
The results from the present imaging and histological studies show that, after starting sunitinib treatment, there is a time window when tumor oxygenation in treated mice is significantly higher than in the untreated controls. The improved oxygenation, which is accompanied by a decrease in blood vessel density, suggests that the residual blood vessels had improved function in terms of delivering oxygen and nutrients, in agreement with earlier reports (17, 22, 29). Interestingly, Ansiauz et al. reported that anti-angiogenic drugs SU5416 and vandetanib increased tumor oxygenation by a decrease in oxygen consumption (30–31). Such other mechanism of transient increase in tumor oxygenation may be also involved in the case of sunitinib and further investigations remain required. Even when sunitinib treatment was started at a later stage in the tumor growth where there is already significant hypoxia, a similar profile of improved oxygenation was observed. The large proportion of hypoxic tumor regions that became oxygenated after sunitinib treatment (blue circles in Figure 3C) represent tumor regions which can be expected to be responsive to radiotherapy. In addition, a synergistic delay in tumor growth was observed when radiation was delivered during the improved tumor oxygenation after 4 days of sunitinib administration (Figure 5). These results support the capability of EPRI to longitudinally and non-invasively visualize tumor pO2, allowing us to monitor and adjust the impact of anti-angiogenic drugs on individual tumors and optimize benefit of combined therapy of anti-angiogenesis and other treatments.
Cycling hypoxia is now a well-recognized hallmark of solid tumors (9, 12). The cycle of hypoxia/normoxia induces accumulation of hypoxia-inducible transcription factor-1 (HIF-1) in both tumor cells as well as supporting endothelial cells, and promotes cancer cell phenotypes with enhanced pro-survival pathways, acquire resistance to therapy and with increased malignant potential (13, 32–33). However until now, treatments currently did not consider the existence of cycling hypoxia nor examine the consequence of anti-angiogenic agents on cycling tumor hypoxia. The phenomenon of cycling hypoxia has been originally observed as a consequence of radiobiological experiments, and investigated in detail using histological approaches and subsequent window-chamber experiments (9, 32). Since a priori knowledge of location and frequency of cycling hypoxia may help plan the treatment regimens, non-invasive imaging techniques are being actively explored to monitor this phenomenon with required spatial and temporal resolutions (12). EPRI provided a non-invasive capability to obtain three-dimensional pO2 maps within 3 minutes. Serial oxygen mapping with EPRI in a time window of 30 minutes enabled to spatially distinguish cycling hypoxic regions from chronically hypoxia regions in the tumors (26). In order to quantitatively visualize the extent of cycling hypoxia, the parametric image (standard deviation of pO2 map) was calculated from 10 individual images in 30 minutes time window. The results in this study show, for the first time, that cycling hypoxia in tumors can be suppressed by sunitinib. Thus anti-angiogenic treatment might, in addition to its well known modes of action alone or in combination therapy, prevent pro-survival pathways which can be acquired by cycling hypoxia.
Jain and colleagues reported that the combination of MRI-based parameters with circulating collagen IV can predict survival of glioblastoma patients after anti-VEGF treatment (29). Combination of such blood markers with the pO2 and blood vessel density values may improve the accuracy of these types of predictions. The present study demonstrated that the methodology developed here has the capability to non-invasively and longitudinally monitor spatial and temporal changes in tumor pO2 before and after anti-angiogenesis treatment, and to successfully visualize the improvement in cycling hypoxia during the vascular normalization window, which results in enhanced efficacy of combined radiation therapy. EPRI can utilize the experience from MRI to scale up for human use, making it a promising modality for integration into clinical settings.
Supplementary Material
ACKNOWLEDGEMENTS
This research was supported by the Intramural Research Program, Center for Cancer Research, National Cancer Institute, NIH. Editorial assistance was provided by Melissa Stauffer, PhD, of Scientific Editing Solutions.
Footnotes
All authors have no conflict-of-interest to be revealed.
References
- 1.Folkman J. Tumor angiogenesis: therapeutic implications. N Engl J Med. 1971;285:1182–1186. doi: 10.1056/NEJM197111182852108. [DOI] [PubMed] [Google Scholar]
- 2.Jain RK. A new target for tumor therapy. N Engl J Med. 2009;360:2669–2671. doi: 10.1056/NEJMcibr0902054. [DOI] [PMC free article] [PubMed] [Google Scholar]
- 3.Naumov GN, Akslen LA, Folkman J. Role of angiogenesis in human tumor dormancy: animal models of the angiogenic switch. Cell Cycle. 2006;5:1779–1787. doi: 10.4161/cc.5.16.3018. [DOI] [PubMed] [Google Scholar]
- 4.Carmeliet P, Jain RK. Angiogenesis in cancer and other diseases. Nature. 2000;407:249–257. doi: 10.1038/35025220. [DOI] [PubMed] [Google Scholar]
- 5.Jain RK. Molecular regulation of vessel maturation. Nat Med. 2003;9:685–693. doi: 10.1038/nm0603-685. [DOI] [PubMed] [Google Scholar]
- 6.Matsumoto S, Yasui H, Batra S, Kinoshita Y, Bernardo M, Munasinghe JP, et al. Simultaneous imaging of tumor oxygenation and microvascular permeability using Overhauser enhanced MRI. Proc Natl Acad Sci USA. 2009;106:17898–17903. doi: 10.1073/pnas.0908447106. [DOI] [PMC free article] [PubMed] [Google Scholar]
- 7.Gatenby RA, Gillies RJ. Why do cancers have high aerobic glycolysis? Nat Rev Cancer. 2004;4:891–899. doi: 10.1038/nrc1478. [DOI] [PubMed] [Google Scholar]
- 8.Dewhirst MW, Ong ET, Braun RD, Smith B, Klitzman B, Evans SM, et al. Quantification of longitudinal tissue pO2 gradients in window chamber tumours: impact on tumour hypoxia. Br J Cancer. 1999;79:1717–1722. doi: 10.1038/sj.bjc.6690273. [DOI] [PMC free article] [PubMed] [Google Scholar]
- 9.Dewhirst MW. Relationships between cycling hypoxia, HIF-1, angiogenesis and oxidative stress. Radiat Res. 2009;172:653–665. doi: 10.1667/RR1926.1. [DOI] [PMC free article] [PubMed] [Google Scholar]
- 10.Kimura H, Braun RD, Ong ET, Hsu R, Secomb TW, Papahadjopoulos D, et al. Fluctuations in red cell flux in tumor microvessels can lead to transient hypoxia and reoxygenation in tumor parenchyma. Cancer Res. 1996;56:5522–5528. [PubMed] [Google Scholar]
- 11.Chaplin DJ, Olive PL, Durand RE. Intermittent blood flow in a murine tumor: radiobiological effects. Cancer Res. 1987;47:597–601. [PubMed] [Google Scholar]
- 12.Matsumoto S, Yasui H, Mitchell JB, Krishna MC. Imaging cycling tumor hypoxia. Cancer Res. 2010;70:10019–10023. doi: 10.1158/0008-5472.CAN-10-2821. [DOI] [PMC free article] [PubMed] [Google Scholar]
- 13.Martinive P, Defresne F, Bouzin C, Saliez J, Lair F, Gregoire V, et al. Preconditioning of the tumor vasculature and tumor cells by intermittent hypoxia: implications for anticancer therapies. Cancer Res. 2006;66:11736–11744. doi: 10.1158/0008-5472.CAN-06-2056. [DOI] [PubMed] [Google Scholar]
- 14.Baudelet C, Ansiaux R, Jordan BF, Havaux X, Macq B, Gallez B. Physiological noise in murine solid tumours using T2*-weighted gradient-echo imaging: a marker of tumour acute hypoxia? Phys Med Biol. 2004;49:3389–3411. doi: 10.1088/0031-9155/49/15/006. [DOI] [PubMed] [Google Scholar]
- 15.Bergers G, Hanahan D. Modes of resistance to anti-angiogenic therapy. Nat Rev Cancer. 2008;8:592–603. doi: 10.1038/nrc2442. [DOI] [PMC free article] [PubMed] [Google Scholar]
- 16.Senan S, Smit EF. Design of clinical trials of radiation combined with antiangiogenic therapy. Oncologist. 2007;12:465–477. doi: 10.1634/theoncologist.12-4-465. [DOI] [PubMed] [Google Scholar]
- 17.Ansiaux R, Baudelet C, Jordan BF, Beghein N, Sonveaux P, De Wever J, et al. Thalidomide radiosensitizes tumors through early changes in the tumor microenvironment. Clin Cancer Res. 2005;11:743–750. [PubMed] [Google Scholar]
- 18.Cerniglia GJ, Pore N, Tsai JH, Schultz S, Mick R, Choe R, et al. Epidermal growth factor receptor inhibition modulates the microenvironment by vascular normalization to improve chemotherapy and radiotherapy efficacy. PLoS One. 2009;4:e6539. doi: 10.1371/journal.pone.0006539. [DOI] [PMC free article] [PubMed] [Google Scholar]
- 19.Zhou Q, Guo P, Gallo JM. Impact of angiogenesis inhibition by sunitinib on tumor distribution of temozolomide. Clin Cancer Res. 2008;14:1540–1549. doi: 10.1158/1078-0432.CCR-07-4544. [DOI] [PubMed] [Google Scholar]
- 20.Jain RK. Normalizing tumor vasculature with anti-angiogenic therapy: a new paradigm for combination therapy. Nat Med. 2001;7:987–989. doi: 10.1038/nm0901-987. [DOI] [PubMed] [Google Scholar]
- 21.Cuneo KC, Geng L, Fu A, Orton D, Hallahan DE, Chakravarthy AB. SU11248 (sunitinib) sensitizes pancreatic cancer to the cytotoxic effects of ionizing radiation. Int J Radiat Oncol Biol Phys. 2008;71:873–879. doi: 10.1016/j.ijrobp.2008.02.062. [DOI] [PubMed] [Google Scholar]
- 22.Winkler F, Kozin SV, Tong RT, Chae SS, Booth MF, Garkavtsev I, et al. Kinetics of vascular normalization by VEGFR2 blockade governs brain tumor response to radiation: role of oxygenation, angiopoietin-1, and matrix metalloproteinases. Cancer Cell. 2004;6:553–563. doi: 10.1016/j.ccr.2004.10.011. [DOI] [PubMed] [Google Scholar]
- 23.Miller JC, Pien HH, Sahani D, Sorensen AG, Thrall JH. Imaging angiogenesis: applications and potential for drug development. J Natl Cancer Inst. 2005;97:172–187. doi: 10.1093/jnci/dji023. [DOI] [PubMed] [Google Scholar]
- 24.Elas M, Bell R, Hleihel D, Barth ED, McFaul C, Haney CR, et al. Electron paramagnetic resonance oxygen image hypoxic fraction plus radiation dose strongly correlates with tumor cure in FSa fibrosarcomas. Int J Radiat Oncol Biol Phys. 2008;71:542–549. doi: 10.1016/j.ijrobp.2008.02.022. [DOI] [PMC free article] [PubMed] [Google Scholar]
- 25.Matsumoto S, Hyodo F, Subramanian S, Devasahayam N, Munasinghe J, Hyodo E, et al. Low-field paramagnetic resonance imaging of tumor oxygenation and glycolytic activity in mice. J Clin Invest. 2008;118:1965–1973. doi: 10.1172/JCI34928. [DOI] [PMC free article] [PubMed] [Google Scholar]
- 26.Yasui H, Matsumoto S, Devasahayam N, Munasinghe JP, Choudhuri R, Saito K, et al. Low-field magnetic resonance imaging to visualize chronic and cycling hypoxia in tumorbearing mice. Cancer Res. 2010;70:6427–6436. doi: 10.1158/0008-5472.CAN-10-1350. [DOI] [PMC free article] [PubMed] [Google Scholar]
- 27.Hyodo F, Chandramouli GV, Matsumoto S, Matsumoto K, Mitchell JB, Krishna MC, et al. Estimation of tumor microvessel density by MRI using a blood pool contrast agent. Int J Oncol. 2009;35:797–804. doi: 10.3892/ijo_00000392. [DOI] [PMC free article] [PubMed] [Google Scholar]
- 28.Brindle K. New approaches for imaging tumour responses to treatment. Nat Rev Cancer. 2008;8:94–107. doi: 10.1038/nrc2289. [DOI] [PubMed] [Google Scholar]
- 29.Sorensen AG, Batchelor TT, Zhang WT, Chen PJ, Yeo P, Wang M, et al. A "vascular normalization index" as potential mechanistic biomarker to predict survival after a single dose of cediranib in recurrent glioblastoma patients. Cancer Res. 2009;69:5296–5300. doi: 10.1158/0008-5472.CAN-09-0814. [DOI] [PMC free article] [PubMed] [Google Scholar]
- 30.Ansiaux R, Baudelet C, Jordan BF, Crokart N, Martinive P, DeWever J, et al. Mechanism of reoxygenation after antiangiogenic therapy using SU5416 and its importance for guiding combined antitumor therapy. Cancer Res. 2006;66:9698–9704. doi: 10.1158/0008-5472.CAN-06-1854. [DOI] [PubMed] [Google Scholar]
- 31.Ansiaux R, Dewever J, Gregoire V, Feron O, Jordan BF, Gallez B. Decrease in tumor cell oxygen consumption after treatment with vandetanib (ZACTIMA; ZD6474) and its effect on response to radiotherapy. Radiat Res. 2009;172:584–591. doi: 10.1667/RR1744.1. [DOI] [PubMed] [Google Scholar]
- 32.Dewhirst MW, Cao Y, Moeller B. Cycling hypoxia and free radicals regulate angiogenesis and radiotherapy response. Nat Rev Cancer. 2008;8:425–437. doi: 10.1038/nrc2397. [DOI] [PMC free article] [PubMed] [Google Scholar]
- 33.Moeller BJ, Cao Y, Li CY, Dewhirst MW. Radiation activates HIF-1 to regulate vascular radiosensitivity in tumors: role of reoxygenation, free radicals, and stress granules. Cancer Cell. 2004;5:429–441. doi: 10.1016/s1535-6108(04)00115-1. [DOI] [PubMed] [Google Scholar]
Associated Data
This section collects any data citations, data availability statements, or supplementary materials included in this article.


