Abstract
Often investigators need to calculate power to demonstrate feasibility of proposed genetic studies for grant proposals or simply to aid in their own study planning. Frequently, power can be easily calculated using a closed form formula. However, in some situations such formulae for calculating power have not been derived and derivation on demand may be difficult if not impossible. In these situations investigators typically perform simulations specific to the study. Yet such simulations can be computationally extensive and take weeks to months depending on the circumstances. Here, we provide a simple method to rapidly estimate power when one has power estimates available for corresponding situations that differ from the situation of interest only in sample size and/or alpha (type I error) level desired. We show by application to multiple published results from the genomics field that these methods are generally very accurate and applicable to a broad range of genomic studies.
Keywords and phrases: Power, Asymptotics, Sample size, TDT, Linkage, Association, GxG, Haplotype
1. INTRODUCTION
Consider the following fictional anecdote. Dr. X plans to submit a grant application involving a complex genetic study and proposes to use a specialized recently published statistical method. For a study of the type Dr. X proposes with effect sizes that she finds plausible in her study, the paper introducing the method reports statistical power for sample sizes of 500 and 1,000 at an α-level of 0.001, but Dr. X is planning to use 750 subjects and an α of 0.0001 and wants to know the power she will have. No publicly available software or simple closed form equations exist to calculate power and Dr. X does not have the wherewithal to program and run extensive computer simulations to determine power. What can she do?
We suspect that almost every investigator studying complex genetic traits has faced some variant of this quandary whether it is due to limitations of time, hardware, software, willingness, or ability to run all the simulations one would need to calculate power for all of one’s scenarios of interest. More formally, we can generalize this quandary to the following question. Given known or at least precisely estimated power for a given effect size, design, sample size, and α level, can we quickly and easily compute sufficiently accurate power estimates for the same design and effects size, but for different sample sizes and/or α levels, and if so, how? Our aim in this paper is to address this question and after a careful empirical analysis we believe that the answer is unequivocally, “Yes.”
We provide a very simple formula dubbed EEE that can be applied in any situation of the type described in the question above, is theoretically shown to be justified asymptotically in an enormous variety of situations, and is empirically shown to perform remarkably well in a variety of situations. EEE stands for Elston’s Excellent Estimator and is an equation, to be specified in the method section, which permits simple calculation of power and sample size estimates in many complex situations.
2. METHODS
The EEE Formula. The formula we use was first introduced to us by Robert Elston (Personal communication, January, 1995) and we have taken to calling it “Elston’s Excellent Estimator” (EEE). The basic formula for EEE can be expressed as:
| (1) |
where Φ−1(•) denotes the inverse of the standard normal cumulative distribution function (cdf) evaluated at •, n is the initial sample size used for the available power estimate (often from a prior simulation study), n* is the new sample size an investigator is planning to use for his/her study, α is the two tailed significance level on which the initial power estimate was based, α* is the significance level for the two tailed test in planned study, 1−β denotes power given in the simulation study, and 1−β* denotes power to be estimated for the planned study. Derivations are in the Appendix.
One can begin with any sample size, α level, and power from a given study, then choose a new α level, and solve for the resultant power (1 − β*) given a new sample size (n*), using equation (1). This formula can easily be programmed into Excel, SAS, SPSS, or any other software that has a standard normal distribution and inverse of the distribution function routine embedded in it.
2.1 Asymptotic correctness
For the vast majority of tests, the proof of the asymptotic correctness of this formula is easy to show. Almost all parametric1 statistical tests commonly utilize test statistics that are either exactly or asymptotically distributed as either Z, t, χ2, or F. These four distributions are closely related [21]. For example, , limc→∞ tdf=c = Z, and . From these relations, if one can derive EEE for the case of a normal test statistic (Z), it is easy to show that the EEE formula also is asymptotically correct for any test involving t, F, or χ2. Indeed, this approach underlies the rapid calculations offered in many canned statistical power calculation programs [8].
2.2 Empirical evaluation of performance
Although one could assess the accuracy of EEE via simulations, it would be difficult to conduct simulations over a sufficiently broad range of circumstances to evaluate whether EEE has the flexibility to adapt to almost any testing situation. Instead, following the conceptual lead of Micceri [15], we rely on multiple studies of specialized statistical genetic techniques published in the literature as test cases and ask empirically, if an investigator used EEE to estimate their power or required sample size by beginning with the readily available published literature as a base from which to project, how accurate would they be? An advantage of this approach coupled with the large number of statistical genetic simulation studies published is that it allows statistical methodology to be practiced as much an empirical as a theoretical science.
2.3 Implementation of EEE
EEE can be used in 2 ways to evaluate power. First, we can approximate power for situations in which the sample size for a test is altered but all other study parameters remain the same. Second, we can approximate required sample size for situations in which a different power level is desired and/or a different α level is chosen, but all other study parameters remain the same.
To test concordance of the EEE power estimates with available study power, we used the Concordance correlation coefficient (CCC) [14]. The CCC evaluates the agreement of paired observations by measuring variation from the 45% line through the origin (the concordance line) and is used to validate the reproducibility of paired observations. It is also robust against samples from uniform and Poisson distributions even with small sample sizes. For each EEE estimate for power, we also computed percent power difference (PPD) as 100*(Power estimated by EEE – Power given in available simulation study), and also calculated its absolute value (APPD).
3. RESULTS
We identified papers that would allow the empirical assessment of the proposed approximation procedure for calculating power. We searched PubMed and major journals for papers where the value of power was given by simulations for the same test, design, sampling procedure, and effect size, but at different sample sizes or α-levels, so that we could compare the power given in the paper estimated directly by simulation with the power that we estimated through the EEE approach. No attempt was made to conduct an exhaustive search of all eligible papers. Instead, we tried to obtain a sufficiently large sample of papers to yield clear results and a sufficiently diverse sample to permit an assessment of performance of EEE over a broad range of circumstances. A total of 15 simulation studies were used to estimate power or sample size using the EEE procedure [1–3, 5–7, 9–11, 13, 16–20]. We had one study involving linkage analysis [20], one study involving familial aggregation analysis [16], 5 involving various family-based association (i.e., TDT-type) tests [1–3, 18, 19], one involving a population-based association test [6], 2 involving epistasis or GxG interactions [9, 10], 3 involving haplotype analysis [11, 13, 17], one involving genome-wide association mapping [5], and one involving imprinting [7].
Accuracy of power estimates
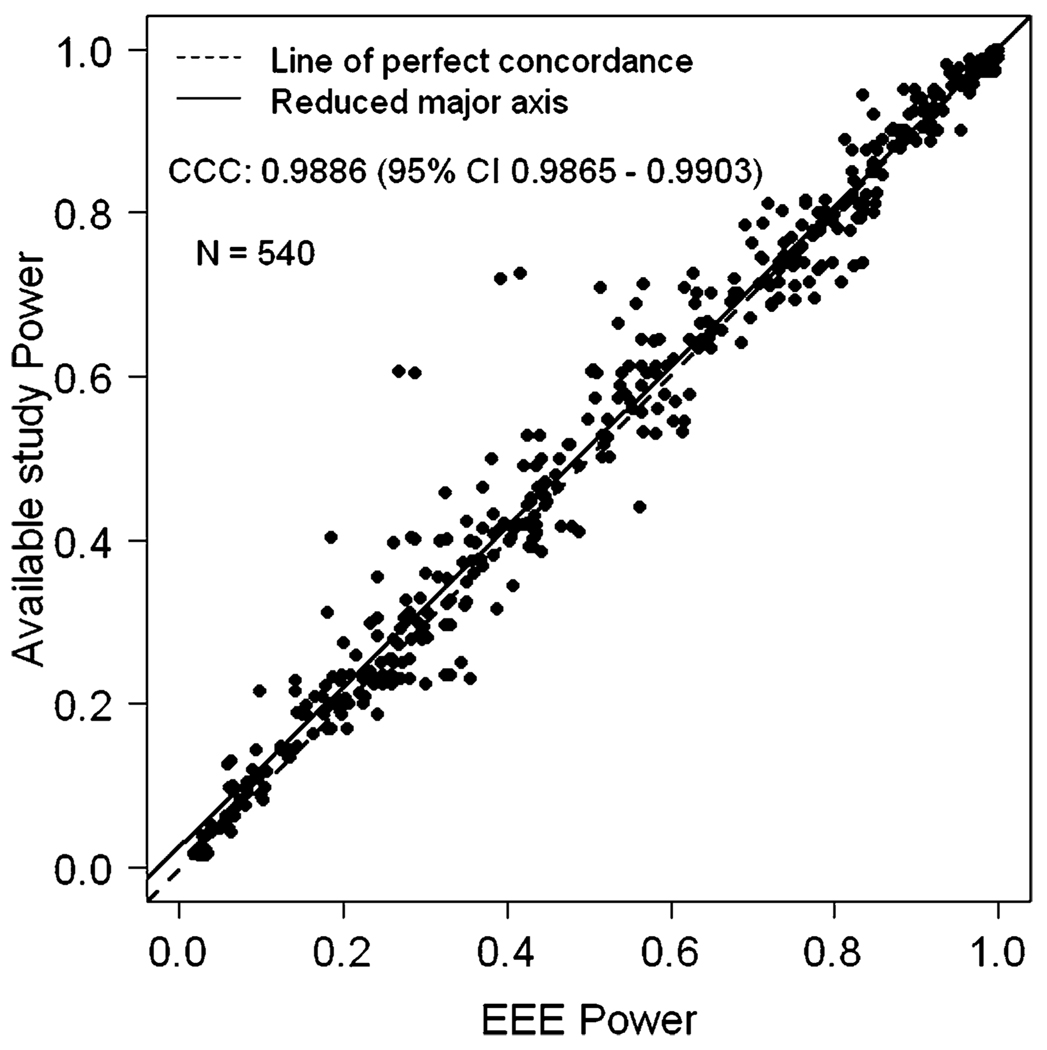
Figure 1 displays the power approximated by the EEE procedure (x-axis) against the available simulated study power (y-axis) when the sample size of the available study is smaller than the sample size of the planned study with constant α level for both studies. A total of 540 data-points from 12 published studies [1, 2, 5–7, 9, 10, 13, 16, 17, 19, 20] are included in the Figure 1. The CCCs between available simulated power and EEE estimated power was 0.9886 (95% CI 0.9865 – 0.9903). The Pearson correlation coefficient was 0.9893 very close to CCC. We observed that there were only 24 (4%) out of 540 total observations discordant with EEE power versus available study power, where a difference of greater than 10% between simulated and EEE estimated power was observed. There were four extreme observations where the difference between EEE and available study power was close to 0.30. In these extreme observations, the ratio of the sample size of the planned study to available study was greater than 4 and given power of the available study was less than 10%. Also, we observed that power calculated by EEE was conservative compared to simulated power in these situations. In general, the majority of the discordance between EEE approximated power and simulation estimated power occurred when the available initial simulated power that was used as input to the EEE formula was less than 10% and sample size for the planned study was more than tripled. In such extreme situations then, investigators should proceed with caution, if at all, with the use of the EEE approximation.
Figure 1.
EEE power versus available simulated study power when the sample size of the available study is smaller than the sample size of the planned study with α level same for both studies.
Table 1 gives descriptive statistics for percent power difference (PPD) and absolute value of the PPD (APPD) corresponding to Figure 1 (PPD and APPD defined in methods). The mean APPD was 2.74% showing tight concordance between simulated study power and EEE approximated power. When one considers that the simulated power levels, by being random variables are themselves prone to some error, this degree of concordance is all the more impressive.
Table 1.
Descriptive statistics for percent power difference (PPD) and absolute percent power difference (APPD) between power available from the simulated study and estimated power by EEE when sample size increases and alpha remains constant for both studies, based on 540 observations
| PPD | APPD | |
|---|---|---|
| Mean | 0.6168 | 2.7430 |
| SD | 4.7261 | 4.0098 |
| Min, Max | −34.0577, 12.4280 | 4.68E-9, 34.0577 |
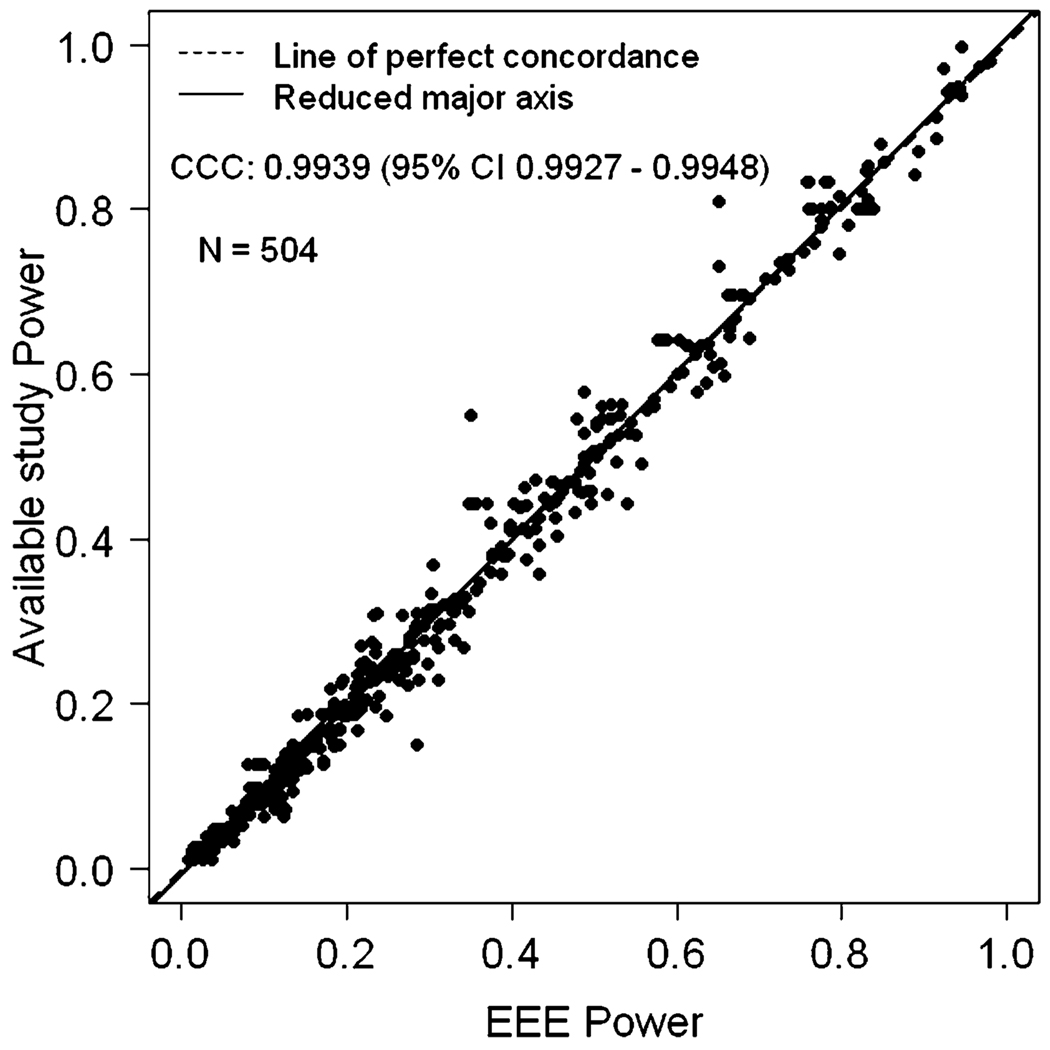
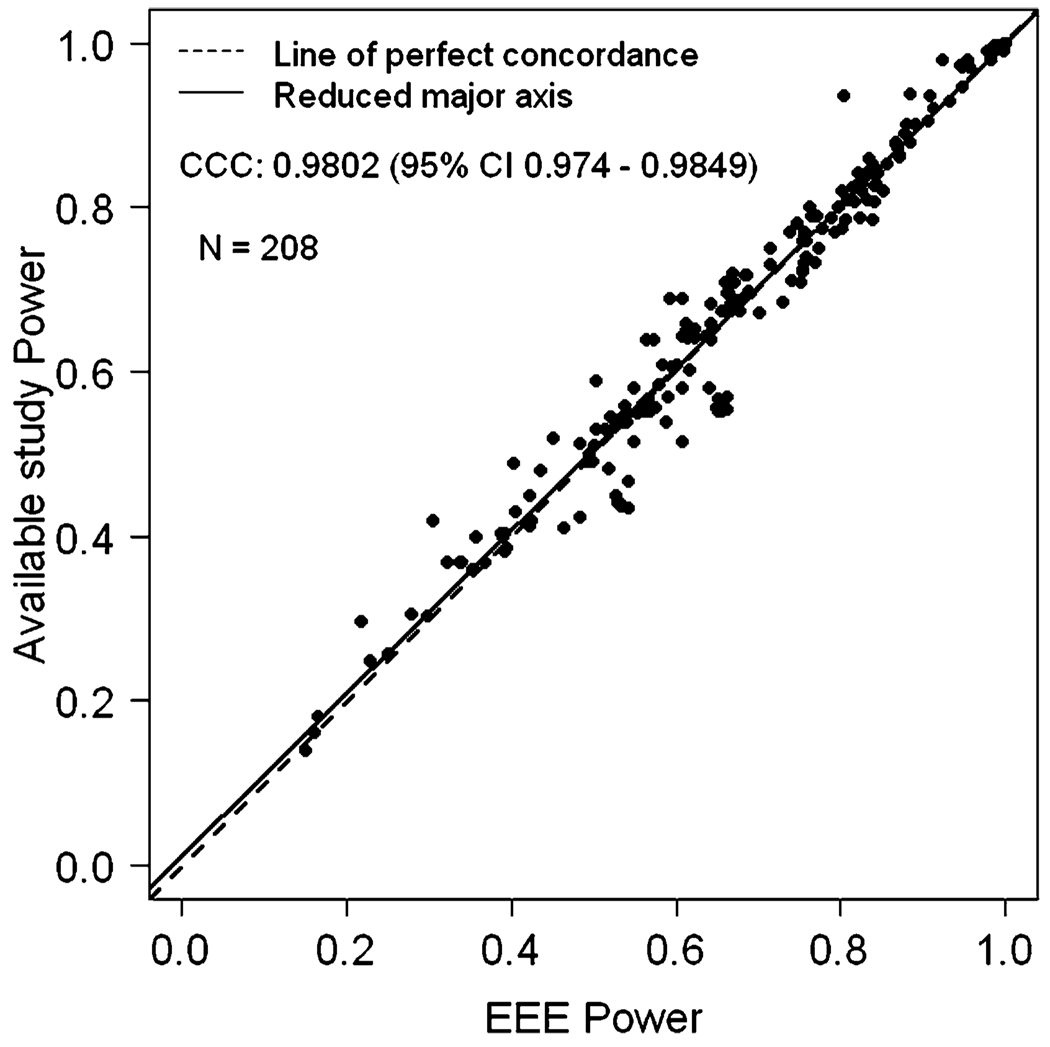
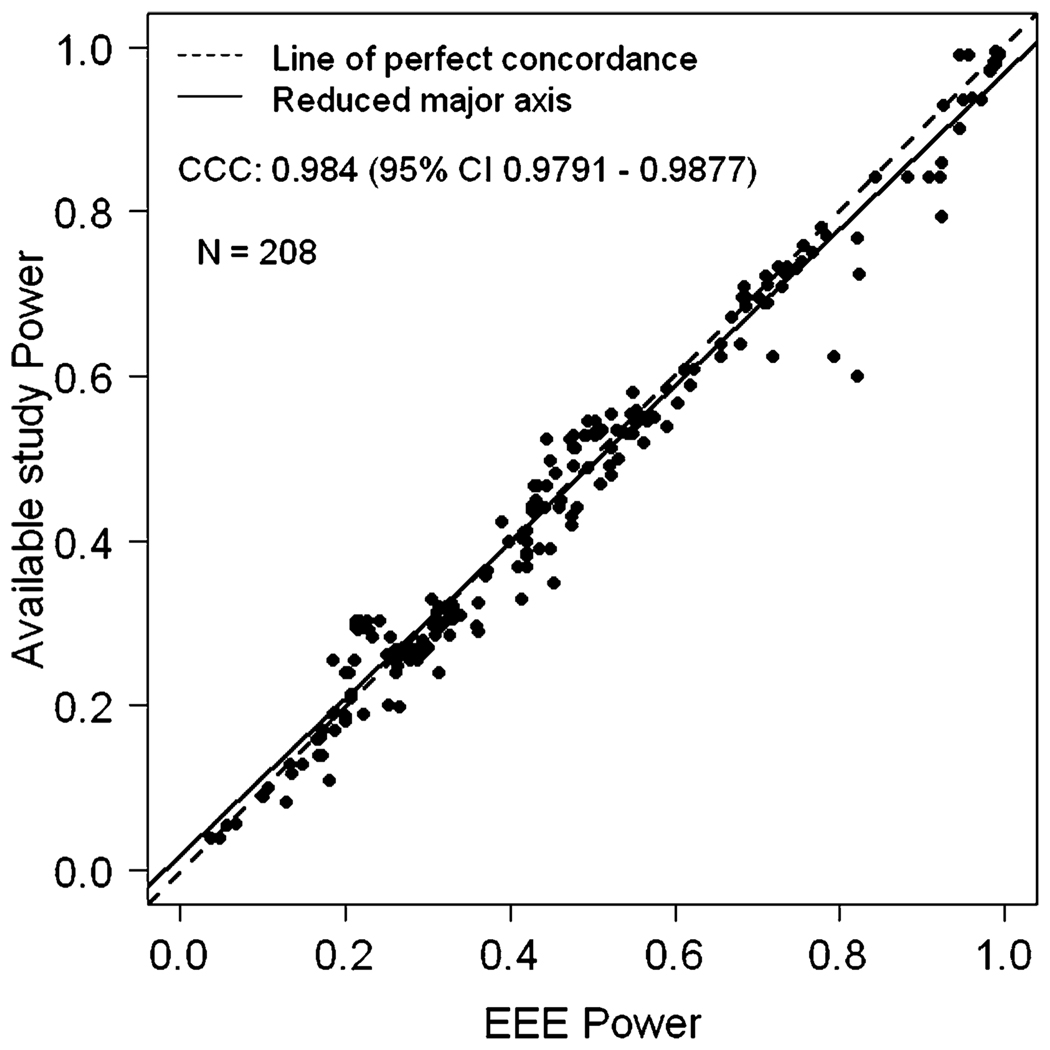
We also estimated EEE power when the sample size of the available study is larger than the sample size of the planned study with α level constant for both studies. In general, EEE performed very well. The exception occurred when the initial simulated power was very close to 1.0 (e.g., 0.99999), and had been rounded off to ‘1’. This makes the inverse of the standard normal distribution function Φ−1(•) to be infinite. Hence the EEE formula cannot be applied when power is reported as 1.0 and is dubious if the inputted simulation power is 0.99 or greater. Note that this is not a limitation of EEE, but a limitation of the data that are provided. Once we remove such data points, it is clear that the EEE approximated values and the simulated values are once again in very close concordance (Figure 2). After removing the observations where simulated power was 1.0, we had a total of 504 observations and the CCC between simulated study power and EEE approximated power was 0.9939 (95% CI 0.9927 – 0.9948) and Pearson correlation coefficient was 0.9941. Table 2 provides the summary statistics of PPD and APPD. The mean APPD was only 1.8976% showing the extreme concordance between EEE power and what would have been obtained by simulation. Also, discordance of greater than 10% between EEE power and simulated study power occurred at only 3 observations. We also evaluated the effect of α level changes in both directions, larger to smaller (e.g., when available study power is given for an α level of 0.05 and an investigator wishes to calculate power at an α level of 0.01) or smaller to larger (e.g., when available study power is given for α level of 0.01 and an investigator wishes to calculate power at an α level of 0.05). Figures 3 and 4 depict comparisons of power between EEE approximated power versus simulated power values for these two scenarios. A total of 208 data-points from 5 published studies [3, 5, 11, 18, 20] are included in Figures 3 and 4. The CCC between simulated study power and EEE power was 0.9802 (95% CI 0.974 – 0.9849) corresponding to Figure 3 and 0.9840 (95% CI 0.9791 – 0.9877) corresponding to Figure 4, respectively. The Pearson correlation coefficients were 0.9803 and 0.9499. The descriptive statistics for PPD and APPD are given in Tables 3 and 4 corresponding to Figures 3 and 4, respectively. There were only 4 observations in Figure 3 and 5 observations in Figure 4 for which the difference between the EEE approximated and simulated power was more than 10%, again showing extreme concordance with the power calculated by EEE and simulated study power. Note that Lin’s CCC and Pearson correlation coefficients are quite similar in all scenarios presented here.
Figure 2.
EEE power versus available simulated study power when the sample size of the available study is larger than the sample size of the planned study with α level same for both studies.
Table 2.
Descriptive statistics for percent power difference (PPD) and absolute percent power difference (APPD) between power available from the simulated study and estimated power by EEE when sample size decreases and alpha remains constant for both studies, based on 504 observations
| PPD | APPD | |
|---|---|---|
| Mean | 0.1588 | 1.8976 |
| SD | 2.8850 | 2.1773 |
| Min, Max | −19.9329, 13.5285 | 0.0026, 19.9329 |
Figure 3.
EEE power versus available simulated study power when α level changes from small to large, but sample size remain constant in both studies.
Figure 4.
EEE power versus available simulated study power when the α level changes from large to small, but sample size remains constant in both studies.
Table 3.
Descriptive statistics for percent power difference (PPD) and absolute percent power difference (APPD) between power available from the simulated study and estimated power by EEE when alpha changes from smaller α-level to larger α-level, based on 208 observations, where sample size remains constant
| PPD | APPD | |
|---|---|---|
| Mean | −0.2183 | 2.6788 |
| SD | 3.8787 | 2.8073 |
| Min, Max | −13.2142, 10.8043 | 0.0013, 13.2142 |
Table 4.
Descriptive statistics for percent power difference (PPD) and absolute percent power difference (APPD) between power available from the simulated study and estimated power by EEE when alpha changes from a larger α-level to a smaller α-level, based on 208 observations, where sample size remains constant
| PPD | APPD | |
|---|---|---|
| Mean | 0.5557 | 2.9829 |
| SD | 4.2218 | 3.0320 |
| Min, Max | −9.0752, 22.0928 | 0.0024, 22.0928 |
As can be seen, the EEE estimates are very near to their simulated counterparts. Clearly, these estimates are quite good and suggest that when using EEE to estimate power from published simulation studies, investigators will obtain accurate estimates and rarely be in error by more than 3 absolute percentage points of power (Tables 1–4). We provide a URL for simple software to estimate power using EEE (http://www.ssg.uab.edu/eee-power/).
4. DISCUSSION
Our findings show that given an initial simulated power estimate for a complex genomic study, power can be approximated by a simple formula, EEE, that can easily be implemented in a matter of minutes in software as simple and widely available as Excel. In addition, computational time involved in simulation studies to calculate power can be prohibitive in certain situations. For example, suppose we have familial data consisting of 800 families with 6,560 individuals and wish to calculate power for association test between SNP and quantitative trait using mixed model and also assume there are 10 different scenarios with respect to effect size. We observed that on a Dell PowerEdge 2650 with the Intel Xeon 2.8 GHz processor and 2 GB of RAM, it took us 2.83 seconds per replicate to simulate and 449 seconds to analyze per replicate. Thus, only generating 2,000 replicates can take about 10.46 days. However, using EEE the computational time in calculating power will be almost negligible. Though some situations exist in which the procedure is not useful, such situations are predictable and in those situations, EEE should typically not be used. For example, when the power of the available study is less than 10% and sample size for the planned study is 4 times larger than the available study power. In such extreme situations then, investigators should proceed with caution, if at all, with the use of the EEE approximation. However, one can still use EEE in these extreme situations, but EEE power will be very conservative. Yet in the vast majority of situations, EEE approximates power extremely accurately and can be used with confidence, provided the initial simulated power values taken as inputs are believed to be trustworthy and are derived from a sufficiently large number of simulation runs. EEE enjoys not only a sound theoretical asymptotic basis, but has now empirically been shown to work quite well across a great variety of genomic research situations.
ACKNOWLEDGMENTS
Supported in part by NIH grants P01AR049084, P30DK056336, R01GM077490, R01DK052431, R21LM008791, R01DK074842, and T32HL79888. We thank Jelai Wang and Mikako Kawai for creating a web interface for EEE software. The opinions expressed herein are those of the authors and not necessarily those of the NIH or any organization with which the authors are affiliated.
APPENDIX
Example of estimating power using Z-test
Suppose we want to test the null hypothesis H0: μ = μ0 against the alternate hypothesis H1: μ ≠ μ0. We can use the test statistic = X̅, then .
We know for the above testing problem,
that is,
and
It’s easy to see, under H0, α = 1 − β. Let us consider a case in which μ0 = 0, then implies ; where Φ−1(•) is an inverse of standard Normal distribution function.
We can also write
where I(μ) = 1 if μ > 0, and 0 if μ < 0. Solving the above equation we get
| (2) |
For a different pair of (α*, β*), we similarly have
| (3) |
By combining the above two equations (2) and (3), we get the estimate of the new sample size in terms of n, α, β, α*, and β*.
| (4) |
Solving equation (4) for the desired power, we get the following.
Footnotes
WEB RESOURCES
URL for the EEE power calculator is given below. http://www.ssg.uab.edu/eee-power/
Contributor Information
Hemant K. Tiwari, Department of Biostatistics, Section on Statistical Genetics, University of Alabama at Birmingham, Birmingham, Alabama, USA, htiwari@uab.edu.
Thomas Birkner, Department of Biostatistics, Section on Statistical Genetics, University of Alabama at Birmingham, Birmingham, Alabama, USA.
Ankur Moondan, Indian Institute of Technology, New Delhi, India.
Shiju Zhang, St. Cloud University, St. Cloud, MN, USA.
Grier P. Page, Research Triangle Institute International, Atlanta, GA, USA
Amit Patki, Department of Biostatistics, Section on Statistical Genetics, University of Alabama at Birmingham, Birmingham, Alabama, USA.
David B. Allison, Department of Biostatistics, Section on Statistical Genetics, University of Alabama at Birmingham, Birmingham, Alabama, USA Clinical Nutrition Research Center, University of Alabama at Birmingham, Birmingham, Alabama, USA.
REFERENCES
- 1.Abecasis GR, Cookson WO, Cardon LR. Pedigree tests of transmission disequilibrium. Eur. J. Hum. Genet. 2000;8:545–551. doi: 10.1038/sj.ejhg.5200494. [DOI] [PubMed] [Google Scholar]
- 2.Abecasis GR, Cardon LR, Cookson WO. A general test of association for quantitative traits in nuclear families. Am. J. Hum. Genet. 2000;66:279–292. doi: 10.1086/302698. [DOI] [PMC free article] [PubMed] [Google Scholar]
- 3.Allison DB, Heo M, Kaplan N, Martin ER. Sibling-based tests of linkage and association for quantitative traits. Am. J. Hum. Genet. 1999;64:1754–1763. doi: 10.1086/302404. [DOI] [PMC free article] [PubMed] [Google Scholar]
- 4.Elston RC. Linkage and association. Genet. Epidemiol. 1998;15:565–576. doi: 10.1002/(SICI)1098-2272(1998)15:6<565::AID-GEPI2>3.0.CO;2-J. [DOI] [PubMed] [Google Scholar]
- 5.Garner C. Upward bias in odds ratio estimates from genome-wide association studies. Genet. Epidemiol. 2007;31:288–295. doi: 10.1002/gepi.20209. [DOI] [PubMed] [Google Scholar]
- 6.Gordon D, Ott J. Assessment and management of single nucleotide polymorphism genotype errors in genetic association analysis. Pac. Symp. Biocomput. 2001;6:18–29. doi: 10.1142/9789814447362_0003. [DOI] [PubMed] [Google Scholar]
- 7.Gorlova OY, Lei L, Zhu D, Weng SF, Shete S, Zhang Y, Li WD, Price RA, Amos CI. Imprinting detection by extending a regression-based QTL analysis method. Hum. Genet. 2007;122:159–174. doi: 10.1007/s00439-007-0387-2. [DOI] [PubMed] [Google Scholar]
- 8.Gorman BS, Primavera LH, Allison DB. PowPal: Software for generalized power analysis. Educ. Psychol. Meas. 1995;55:773–776. [Google Scholar]
- 9.Hancock DB, Martin ER, Li YJ, Scott WK. Methods for interaction analyses using family-based case-control data: Conditional logistic regression versus generalized estimating equations. Genet. Epidemiol. 2007;31:883–893. doi: 10.1002/gepi.20249. [DOI] [PubMed] [Google Scholar]
- 10.Jannink JL. Identifying quantitative trait locus by genetic background interactions in association studies. Genetics. 2007;176:553–561. doi: 10.1534/genetics.106.062992. [DOI] [PMC free article] [PubMed] [Google Scholar]
- 11.Kang H, Qin ZS, Niu T, Liu JS. Incorporating genotyping uncertainty in haplotype inference for single-nucleotide polymorphisms. Am. J. Hum. Genet. 2004;74:495–510. doi: 10.1086/382284. [DOI] [PMC free article] [PubMed] [Google Scholar]
- 12.Lehmann EL. Nonparametrics. New York: Holden-Day; 1975. MR0395032. [Google Scholar]
- 13.Lin DY, Zeng D, Millikan R. Maximum likelihood estimation of haplotype effects and haplotype-environment interactions in association studies. Genet. Epidemiol. 2005;29:299–312. doi: 10.1002/gepi.20098. [DOI] [PubMed] [Google Scholar]
- 14.Lin L. A concordance correlation coefficient to evaluate reproducibility. Biometrics. 1989;45:255–268. [PubMed] [Google Scholar]
- 15.Micceri T. The unicorn, the normal curve, and other improbable creatures. Psychological Bulletin. 1989;105:156–166. [Google Scholar]
- 16.Rabbee N, Betensky RA. Power calculations for familial aggregation studies. Genet. Epidemiol. 2004;26:316–327. doi: 10.1002/gepi.10312. [DOI] [PubMed] [Google Scholar]
- 17.Schaid DJ. Power and sample size for testing associations of haplotypes with complex traits. Ann. Hum. Genet. 2006;70(Pt 1):116–130. doi: 10.1111/j.1529-8817.2005.00215.x. [DOI] [PubMed] [Google Scholar]
- 18.Schneiter K, Laird N, Corcoran C. Exact family-based association tests for biallelic data. Genet. Epidemiol. 2005;29:185–194. doi: 10.1002/gepi.20088. [DOI] [PubMed] [Google Scholar]
- 19.Tiwari HK, Holt J, George V, Beasley TM, Amos CI, Allison DB. New joint covariance- and marginal-based tests for association and linkage for quantitative traits for random and non-random sampling. Genet. Epidemiol. 2005;28:48–57. doi: 10.1002/gepi.20035. [DOI] [PubMed] [Google Scholar]
- 20.Todorov AA, Rao DC. Trade-off between false positives and false negatives in the linkage analysis of complex traits. Genet. Epidemiol. 1997;14:453–464. doi: 10.1002/(SICI)1098-2272(1997)14:5<453::AID-GEPI1>3.0.CO;2-2. [DOI] [PubMed] [Google Scholar]
- 21.Winer BJ, Brown DR, Michels KM. Statistical Principles in Experimental Design. 3rd ed. New York: McGraw-Hill; 1991. [Google Scholar]


