Abstract
Background
Skin lesion color is an important feature for diagnosing malignant melanoma. Color histogram analysis over a training set of images has been used to identify colors characteristic of melanoma, i.e., melanoma colors. A percent melanoma color feature defined as the percentage of the lesion pixels that are melanoma colors has been used as a feature to discriminate melanomas from benign lesions.
Methods
In this research, the color histogram analysis technique is extended to evaluate skin lesion discrimination based on color feature calculations in different regions of the skin lesion. The color features examined include percent melanoma color and a novel color clustering ratio. Experiments are performed using clinical images of 129 malignant melanomas and 129 benign lesions consisting of 40 seborrheic keratoses and 89 nevocellular nevi.
Results
Experimental results show improved discrimination capability for feature calculations focused in the lesion boundary region. Specifically, correct melanoma and benign recognition rates are observed as high as 89 and 83%, respectively, for the percent melanoma color feature computed using only the outermost, uniformly distributed 10% of the lesion’s area.
Conclusions
The experimental results show for the features investigated that the region closest to the skin lesion boundary contains the greatest color discrimination information for lesion screening. Furthermore, the percent melanoma color feature consistently outperformed the color clustering ratio for the different skin lesion regions examined. The clinical application of this result is that clustered colors appear to be no more significant than colors of arbitrary distribution within a lesion.
Keywords: image processing, malignant melanoma, color analysis, skin lesion
Rules most clinicians use for melanoma detection are generally derived from the ABCD criteria: asymmetry, border irregularity, color variegation and diameter of the skin lesion (1). There are many computer-based techniques incorporating features that are variations of the ABCD rules that have been applied to detecting malignant melanoma in clinical images (2–20). A computer-based color analysis technique is explored in this research. Certain colors are generally associated with melanocytic lesions, including shades of tan, brown or black and occasional patches of red, white or blue. Numerous color descriptors have been applied to melanoma detection, including variation of hues (2), red, green and blue (RGB) color channel statistical parameters (16–18), color variegation detection using analytical color techniques (11), spherical color coordinates and (L, a*, b*) color coordinate features (5), percentage of the skin lesion containing absolute shades of reddish, bluish, grayish and blackish areas and the number of those color shades present within the skin lesion in dermatoscopy images (8). Melanoma detection has also been performed based on probability analysis for three classes of colors (benign, melanoma and other colors) found from relative color histograms (19).
In prior research, a data-driven relative color histogram analysis technique was investigated for determining colors characteristic of melanomas, i.e., ‘melanoma colors’ (19). For that study, relative color was used to compensate for skin lesion images that were digitized using a Nikon Coolscan® from 35 mm slides collected from three different sources. Relative color subtracts the average surrounding skin color from the lesion color. The relative color technique attempts to correct for different film types, other acquired photograph variations and lighting and different skin coloration (pigmentation) for different patients. Color histogram analysis was performed using relative color to determine melanoma colors. Quantifying these melanoma colors, a percentage melanoma color feature was computed for individual skin lesions as the total number of pixels within the skin lesion that were labeled as melanoma colors divided by the lesion area. This feature could discriminate 84.6% of a test set of malignant melanomas and 83.0% of benign lesions including seborrheic keratoses and nevocellular nevi (no dysplastic nevi or melanomas in situ were in the set of lesions).
In this research, the relative color histogram analysis technique is extended to explore color feature analysis in different regions of the skin lesion to identify the region(s) that may enhance skin lesion discrimination. The color features examined include the percent melanoma color and a novel color clustering ratio. The color clustering ratio is a natural extension of the percent melanoma color feature to quantify the grouping of skin lesion pixels with colors characteristic of melanoma and to associate the physiological interpretation of that grouping with skin lesion discrimination. The color clustering ratio is the ratio of the total melanoma-colored eight-connected neighbors of melanoma-colored pixels within the skin lesion to the total number of eight-connected neighbors for all melanoma-colored pixels within the lesion. The remaining sections of this paper include: (1) the techniques used to calculate the percent melanoma color and color clustering ratio features, (2) experiments performed for melanoma and benign lesion discrimination based on feature calculations from different regions of the skin lesion, (3) experimental results and discussion and (4) conclusions from the study.
Methods
The steps for skin lesion image color analysis are: (1) obtain a training set of melanoma and benign skin lesion images, (2) determine the lesion boundary for each image, (3) determine a representative or average surrounding skin color value for normalizing the skin lesion color, (4) perform color histogram analysis for each image, generating a cumulative histogram over the training images, (5) identify colors characteristic of melanomas and benign lesions from the cumulative histogram, (6) identify the portion of the skin lesion to be used for computing color features, (7) compute the percentage melanoma color and color clustering ratio features over the specified lesion region for each skin lesion within the training images and (8) determine thresholds or cutoffs for discriminating melanomas and benign skin lesions for the percentage melanoma color and color clustering ratio features based on the training set of images. The following sections present the algorithm above in greater detail.
Clinical image data and procedure to determine skin lesion boundaries
Diagnostic sensitivity and specificity of malignant melanoma detection have shown improvement using image analysis of clinical images (21–24). This research uses clinical images consisting of red, green, blue (RGB) color skin lesion images digitized from 35 mm slides. The data set used for this research includes 129 melanoma and 129 benign clinical images. The images from this data set were used for skin lesion discrimination in other studies (5,19,20). These images are part of the data set acquired from New York University, Department of Dermatology, Dr William V. Stoecker (Rolla, MO, USA) and Dr Bruce Kornfeld (Ft. Leonard Wood, MO, USA).
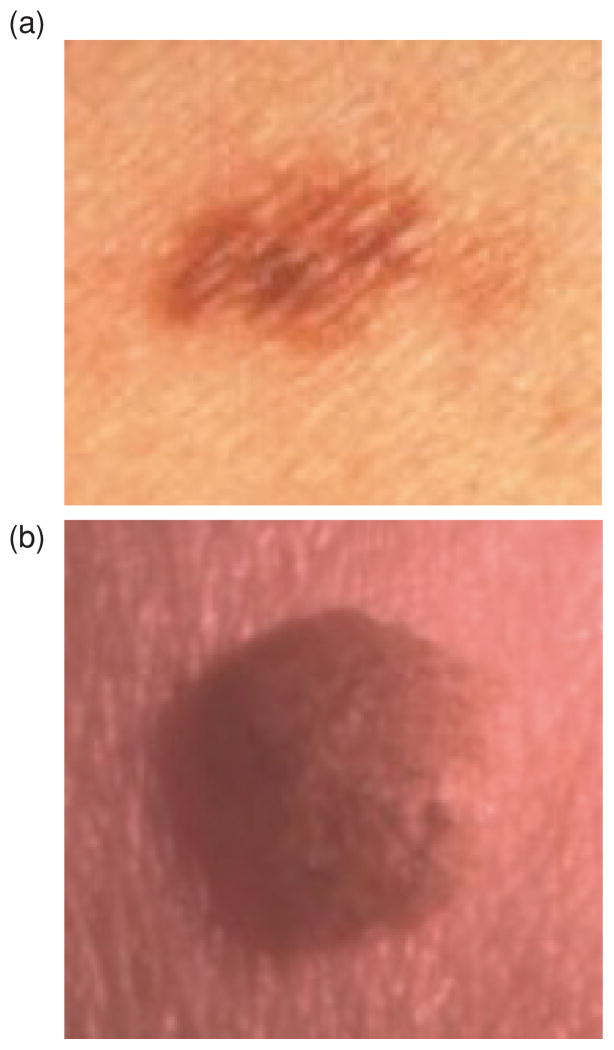
The benign lesions consist of 40 seborrheic keratoses and 89 nevocellular nevi. The melanomas included in the data set are invasive, moderately advanced lesions. No melanomas in situ are included in the data set. These melanomas typically exhibit ‘melanoma color’ to a greater degree than early lesions such as melanoma in situ. Figure 1 shows image examples of a malignant melanoma (in an early invasive lesion) (a) and a benign lesion (seborrheic keratosis) (b) from the image database used in this research.
Fig. 1.
Clinical image examples of benign and melanoma skin lesions, (a) Melanoma image (early invasive), (b) Benign image (seborrheic keratosis).
Skin lesion borders were determined using manually chosen points along the border that were joined with a least mean squares distance second order spline curve. A dermatologist working with a group of students found all borders, making every attempt to find accurate borders, in spite of the absence of a known gold standard for border accuracy.
Relative color and surrounding skin color
The relative color of a skin lesion pixel is the difference between the actual pixel value and the average color value of representative surrounding skin. For an M row by N column RGB image, I, the actual value of each pixel is given by I(x, y) = (r(x y), g(x y), b(x,y)), where 1 ≤ x ≤ N and 1 ≤ y ≤ M. The algorithm to determine the surrounding skin color has been applied in other research (19). Surrounding skin color is represented as the average RGB value of pixels outside the lesion but within a circular region with center point at the lesion centroid. The circular region size is dependent on the skin lesion size (19). Within the surrounding skin region, non-skin colored pixels such as from clothing, hair, teeth, direct camera flash reflections, shadows, etc., must be removed in order to achieve a reliable sample of the surrounding skin. Based on prior research for skin lesion border segmentation, normal skin color appears to fall within a small region of the RGB color space with R>G and R>B (15). The skin pixel finder used in this research was derived from an existing dermatology image database under the guidance of a dermatologist (25).
Let O denote the skin lesion region within the color clinical image, defined as O = {(x, y) | (x, y) ∈ I and is inside the closed skin lesion boundary}. Then, the relative color for all skin lesion pixels is given as Orel(x,y) = (rrel(x,y), grel (x, y), brel(x,y)) = (r(x,y)−rskin, g(x,y)−gskin, b(x,y)−bskin), where −255. ≤ rrel(x,y), grel(x,y), brel(x,y)≤255. rskin, gskin and bskin are the average RGB values computed from the surrounding skin. Thus, the relative color space is of size 511 × 511 × 511, where each (rrel, grel, brel) refers to a bin in the relative color histogram. Requantizing the relative RGB histogram bins is performed in order to represent discrete ranges of colors that are characteristic of melanoma and benign lesions. As applied in prior research (19,20), the resolution of the relative color histogram is reduced by combining 4×4×4 blocks of bins into a single bin, making the resulting histogram of size 128 × 128 × 128. The range of requantized relative color bins for each color is −63 to 64. Each relative color bin contains 64 relative colors (4×4×4) except for the bin (−63, −63, −63), which contains 27 relative colors (3 × 3 × 3). This irregularity in bin size causes no problem because those relative colors are infrequently observed in skin lesions.
Melanoma color mapping
The percent melanoma color and color clustering ratio features require the mapping of colors within the relative color histogram as melanoma and benign colors. The bin labeling algorithm is presented in detail in (19). For the algorithm, training images are used to populate the relative color histogram one image at a time. For each training image, a minimum percentage of the skin lesion area (0.125%) must be contained within a histogram bin for that bin to be considered populated by that image.
After bin population for each melanoma and benign training image is completed, melanoma and benign relative color bin probability densities are determined based on the number of melanoma and benign images that populate each histogram bin. Each bin is labeled as melanoma, benign, uncertain and unpopulated based on comparing the corresponding melanoma and benign probabilities at each bin. Uncertain bins are equally populated with melanoma and benign images. Unpopulated bins denote bins that lack enough pixels to be populated by a single melanoma or benign image. An iterative region growing technique for relabeling uncertain and unpopulated histogram bins is performed based on the 26 connected neighbors to provide the final histogram bin labeling (19). The resulting relative color histogram bin labels are applied to percent melanoma color and color clustering ratio feature calculations for the different regions of the skin lesion examined, as described in lesion region analysis.
Lesion region analysis
After bin labeling from the training set of images, percent melanoma color and color clustering ratio features are computed over different regions of the skin lesion for skin lesion discrimination. The skin lesion regions are referenced as: (1) the boundary area percentage and (2) the offset boundary area percentage. The boundary area percentage is defined as the uniform skin lesion region from the boundary to the interior that contains a specified percentage of the lesion area. The boundary area region is found by iteratively growing from the lesion boundary toward the lesion center. Starting with the lesion boundary, all eight-connected neighbors of each boundary pixel located in the lesion interior are identified. A cumulative count of all uniquely identified interior pixels is maintained. The resulting cumulative count is compared to the desired area percentage. If the area percentage is met or exceeded, region growing is stopped. Otherwise, the uniquely identified interior pixels become the new inner lesion border. From the new inner border, the unique eight-connected interior border pixels are found and are added to the cumulative count of boundary area pixels. The process continues until the area percentage criterion has been satisfied. Figure 2 shows an example with the boundary area percentage (dark) of 25% of the lesion area. This area is used for feature calculations, and the remaining 75% of the lesion interior is excluded from feature calculations.
Fig. 2.
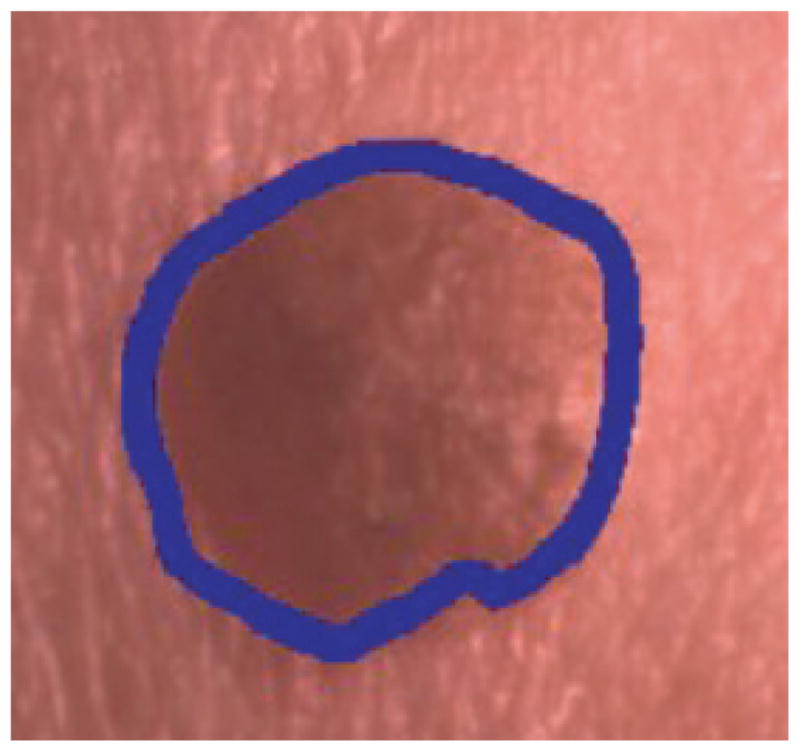
Boundary area percentage example using 25% of the lesion area for analysis (black region). (This is the same lesion as in Fig. 1(b)).
The offset boundary area percentage is defined as the uniform outermost skin lesion region containing the specified lesion area. The boundary area percentage determination then starts from the inner boundary of the specified offset boundary area region. When the boundary is offset, the lesion area percentages are computed using the inner border of the offset boundary area as the starting boundary. Figure 3 presents an example of an offset boundary area containing 50% of the lesion area (gray area) and the adjacent 25% of the lesion area is the lesion area (dark area) used for feature calculations.
Fig. 3.
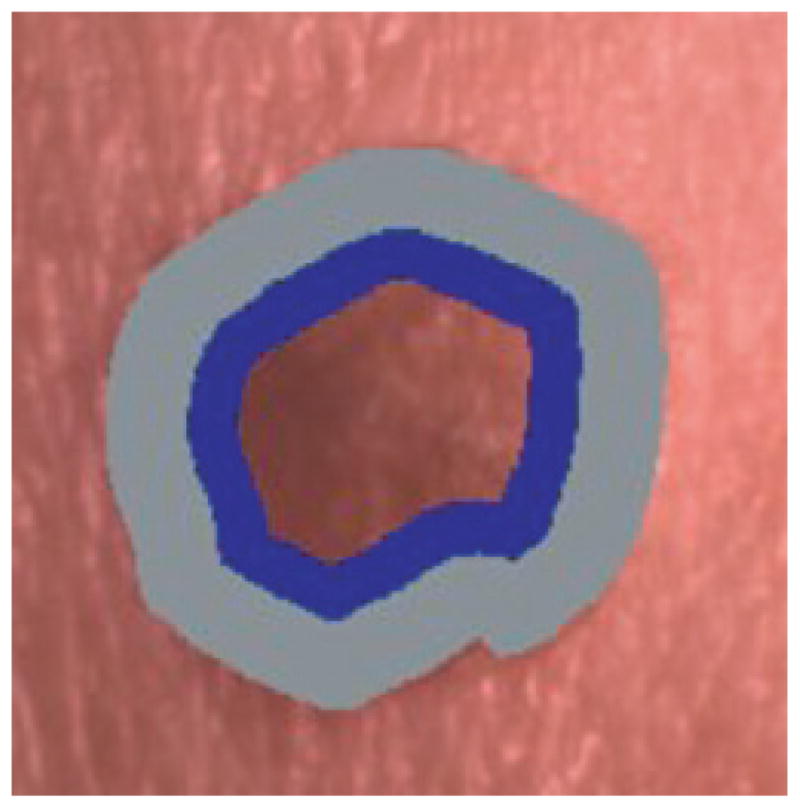
Offset boundary area example using 50% of the lesion area as offset (gray region) and 25% of the lesion area for analysis (black region). (This is the same lesion as in Fig. 1(b)).
Percentage melanoma color feature
The percent melanoma color and color clustering ratio features are computed after the relative color histogram bins have been labeled and the lesion region for feature analysis has been identified. For the percent melanoma color feature, a count denoted as H is maintained for the number of pixels within the lesion region of interest with relative color values that map as melanoma colors. Let At denote the area in pixels of the lesion region of interest. The percent melanoma color within a lesion region of interest of area At is given as
Color clustering ratio feature
The percent melanoma color feature does not take into account spatial distribution of colors. As one way of including spatial information, a color clustering ratio feature is computed over the lesion region of interest. The percent melanoma color provides a measure of what percentage of the lesion region pixels are melanoma-colored for discriminating melanoma from benign lesions. The color clustering ratio feature gives an indicator of the grouping of melanoma-colored pixels within the lesion region. The color clustering ratio feature is computed as follows. Let M denote the set of relative color values that map into relative color histogram bins labeled as melanoma colors from the training set of images. Let L denote the set of pixel locations within the skin lesion region of interest with relative color O that map into melanoma colors, formally
Let N(x,y) denote the number of eight-connected neighbors and NM(x,y) denote the number of melanoma-colored eight-connected neighbors that are contained in the lesion region of interest for pixel (x,y) ∈ L. The eight-connected neighbors for (x,y) ∈ L that lie outside of the lesion region of interest are excluded from calculating N(x,y) and NM(x,y). Then,
represents the total number of melanoma color neighbors for all pixels within the skin lesion with relative color values that map as melanoma colors. The cumulative total number of eight-connected neighbors for all (x,y) ∈ L is denoted as
T includes all neighbors of melanoma color pixels within the skin lesion regardless of whether the neighbor is mapped to a melanoma color. The color clustering ratio for a skin lesion is given as
Lesion classification
Table 1 below shows the diagnostic interpretations of skin lesions for evaluating the automated skin lesion discrimination results that will be applied in this research. A true positive (tp) means diagnosing a melanoma as a melanoma. A false positive (fp) means diagnosing a benign lesion as melanoma. A true negative (tn) means diagnosing a benign lesion as benign. A false negative (fn) means diagnosing a melanoma as benign. A false negative has worse consequences for the patient. In contrast, a false positive results in an unnecessary biopsy.
TABLE 1.
Skin lesion diagnosis categorization based on the type of skin lesion
| Actual skin lesion type | Skin lesion diagnosis
|
|
|---|---|---|
| Melanoma | Benign | |
| Melanoma | True positive (tp) | False negative (fn) |
| Benign | False positive (fp) | True negative (tn) |
Using a training set of images with equal numbers of benign skin lesions and melanomas, the relative color histogram bins are populated and labeled. For the experiments performed, relative color histogram bin labeling is based on the entire skin lesion, i.e., 0% offset boundary. Once the histogram bins are labeled, the percent melanoma color and color clustering ratio features within each training image lesion are computed.
The percent of melanoma-colored pixels (P) and color clustering feature (C) are computed for all training images. Skin lesion classification is based on automatically determining a threshold (D) for the percent melanoma color feature, and a threshold (K) for the color clustering ratio feature. For each Di for i = 1–100 in increments of 0.01, the true positive rate (correct melanoma lesion discrimination rate) and the true negative rate (correct benign discrimination rate) are determined from the training images. D is chosen such that the true positive and true negative rates are equal. There is the possibility that the true positive (tp) and true negative (tn) rates do not become exactly equal over the threshold iteration process due to the differences in the training tp and tn rates and the discrete training set. In this case, D is found using the following procedure. If while iterating, threshold Di results in tp < tn, and the next threshold Di + 1 (in the threshold iteration process) yields tp > tn, then Di is selected as the threshold. The other possibility is that while iterating, threshold Di generates tp > tn, and the next threshold Di + 1 (in the threshold iteration process) yields tp < tn, then Di + 1 is chosen as the threshold. The final melanoma and benign lesion discrimination results are determined for the training and the test data using the final threshold D.
For a given test image, if the percent melanoma color P < D that image is labeled a benign lesion and if P ≥ D the image is classified as a melanoma. Automated determination of K for the color clustering ratio feature is performed using a similar process to the percent melanoma color feature. D and K differ on the range of values examined. For each K from 0 to 1 in increments of 0.001, the true positive and true negative rates are computed. The same rules are applied to find K based on the true positive and true negative rates from the training data as are used to determine the threshold D. The procedure for finding the thresholds D and K is performed in order to provide for a fully automated approach for threshold determination.
Experiments performed
Skin lesion discrimination experiments are performed over different regions of the lesion using the percent melanoma color and color clustering ratio features. As previously stated, the clinical image data set consists of 129 melanoma images and 129 benign images. From this data set, 70% of the images are used in the training set (90 benign lesions and 90 melanomas), with the remaining 30% of the images comprising the test set (39 benign lesions and 39 melanomas). Eighteen randomly chosen training and test sets are chosen for discrimination experiments. For each training set of images, the entire skin lesion is used to generate the relative color histogram, labeling bins as melanoma, benign, uncertain and unpopulated. The relative color histogram bin labels obtained for that training set are used to compute the percent melanoma color and color clustering ratio features for the different lesion regions described as follows. The experiments performed to analyze the melanoma and benign skin lesion discrimination capability over different regions of the lesion’s interior include:
Compute the percent melanoma color and color clustering features for boundary area percentages, including 100, 75, 50, 25 and 10% of the lesion interior. Starting at the lesion boundary, or inner border of the offset area below, the interior of the lesion is traversed uniformly to contain the area percentage specified. Thus, for 50% boundary area percentage, 50% of the lesion area is included for feature calculations, for the case with no offset from the lesion boundary.
Compute the percent melanoma color and color clustering features for the offset boundary area percentages of 0,10, 25,50 and 75% of the lesion area. The color features are computed over the remaining inner portion of the skin lesion. For example, an offset percentage of 10% is uniformly traversed starting with the lesion boundary, and the remaining interior 90% of the lesion area is used for feature calculations.
Compute the percent melanoma color and color clustering ratio features for the offset boundary area percentage case with offset percentage of 10% for lesion interior area percentages of 10, 25, 50, 75 and 90%. The offset percentage of 10% is chosen empirically to compare discrimination of the lesion interior regions with the lesion boundary regions.
Note that the same 18 randomly chosen training/test sets will be used for all experiments performed to enable direct comparison of the results obtained. The entire skin lesion is used for the training set to determine melanoma colors for two reasons: (1) it allows a direct comparison of the feature calculations performed using different portions of the skin lesions in the test set and (2) it was observed that better diagnostic accuracy was achieved in the test sets when the training was performed over the entire lesion area.
Experimental results and discussion
Relative color histogram labeling example
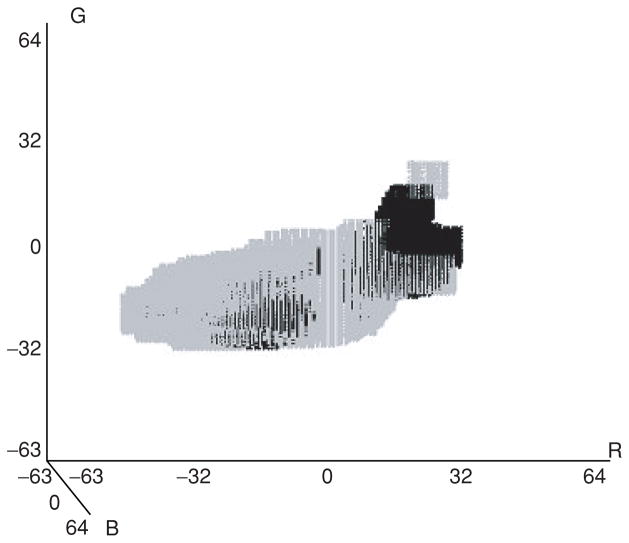
For color feature calculations, pixels within the region of interest of skin lesions are mapped as melanoma colors, benign colors, uncertain or unpopulated from the relative color histogram bin labels generated from a training set of images. The entire skin lesion is used to populate the relative color histogram bins for each training image. Figure 4 shows a three-dimensional representation of the relative color bin melanoma and benign labels using the technique presented in section Methods for one of the 18 randomly generated training sets of images. The gray boxes correspond to the melanoma-labeled bins, and the black boxes represent the benign-labeled bins. The melanoma- and benign-labeled bins have non-overlapping regions in the relative color histogram when viewing the three-dimensional plot on a system that allows the viewing angle to be changed via a trackball. There are also overlapping regions in the relative color histogram, where it is difficult to clearly distinguish melanoma colors from benign colors. Note that the indices for each relative color are from −63 to 64. It is interesting to note from Fig. 4 that the actual number of bins labeled as melanoma is larger than the number labeled as benign, 48518 and 25779, respectively. As seen from Fig. 4, the melanoma-labeled bins encompass a broader range of the relative color space than the benign labeled bins.
Fig. 4.
Example of three-dimensional relative color histogram bin labeling for a training set of images. The light gray regions are melanoma-labeled bins. The black regions are benign-labeled bins.
Boundary area percentage experimental results
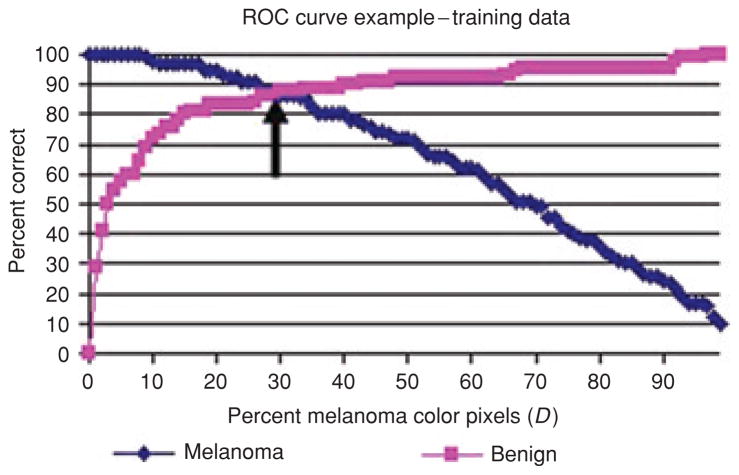
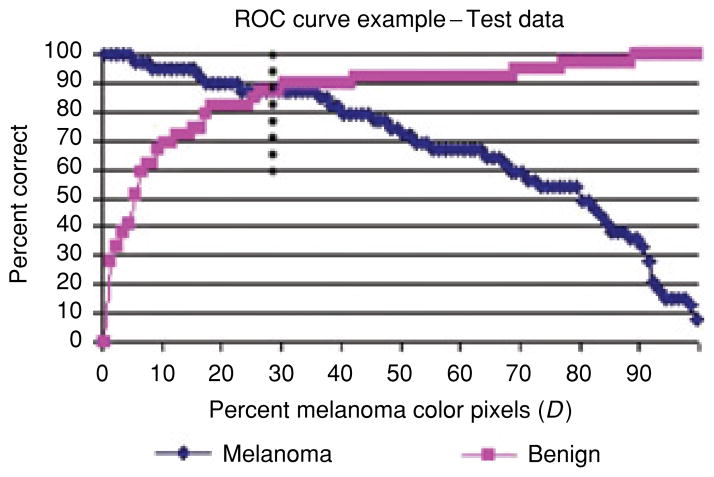
For the boundary area percentage experiments performed, lesion discrimination was examined for percent melanoma color and color clustering ratio features. Figure 5 presents the percent melanoma color feature training true positive and true negative rates over all thresholds D for one of the 18 training/test sets for the 10% boundary area percentage. The arrow points to the intersection of true positive and true negative training rates, providing the chosen threshold D used for melanoma/benign lesion discrimination in the corresponding test set. Figure 6 shows the corresponding test true positive and true negative rates for the percent melanoma color feature over all thresholds D. The dotted line in Fig. 6 represents the threshold D determined from the training data as shown in Fig. 5 and shows its intersection with the test melanoma and benign correct discrimination rates. This example shows many possible melanoma/benign discrimination rate combinations based on selecting different percent melanoma color threshold values for D. In order to provide a fully automated approach to determining D, the value D was set based on equating the true positive and true negative rates from the training data. This provides a consistent approach to obtain discrimination results over multiple training/test sets and provides near-optimization of diagnostic accuracy.
Fig. 5.
Percent melanoma color feature training true positive and true negative rates over all thresholds D for one training/test set for the 10% boundary area percentage case. The arrow points to the threshold D where the true positive and true negative rates are equal.
Fig. 6.
Corresponding percent melanoma color feature test true positive and true negative rates over all thresholds D. The dotted line points to the threshold D (determined from the training data in Fig. 5) for determining true positive and true negative test rates.
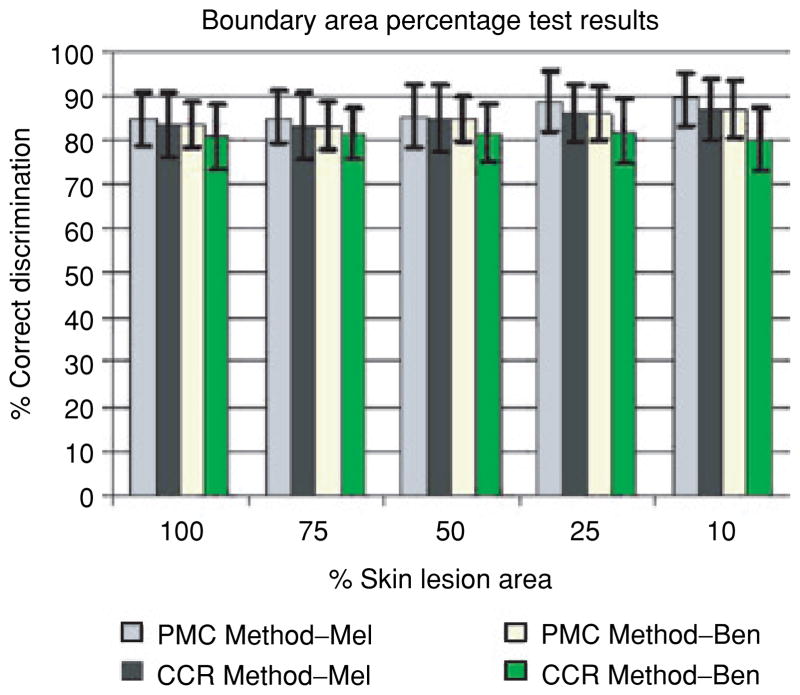
Figure 7 presents the average percent melanoma color and color clustering ratio correct melanoma and benign lesion test recognition rates over 18 random test sets for the boundary area percentage cases of 10,25,50,75 and 100%. The horizontal axis shows the boundary area percentage, labeled as the percentage of the skin lesion starting from the lesion boundary used for feature calculations. The vertical axis gives the percentage correct discrimination. The results for the percent melanoma color and color clustering ratio methods are shown for each boundary area percentage with plus and minus one standard deviation shown for the average correct percentage discrimination. The key for interpreting the recognition results presented for each boundary area percentage case is: PMC Method–Mel refers to the recognition rates of the percent melanoma color method applied to the melanoma test sets, CCR Method–Mel denotes the classification rates of the color clustering ratio method applied to the melanoma test sets, PMC Method–Ben refers to the recognition rates of the percent melanoma color method applied to the benign lesion test sets and CCR Method–Ben denotes the classification rates of the color clustering ratio methods applied to the benign lesion test sets. Note that the average and standard deviation training rates are not shown because the thresholds D and K are chosen based on the approximate equality between the true positive and true negative rates.
Fig. 7.
Average and standard deviation melanoma test results over 18 test sets for the boundary area percentage cases of 100, 75,50,25 and 10%. PMC and CCR refer to the percent melanoma color and color clustering ratio features, respectively.
The experimental results in Fig. 7 lead to several observations. First, the percent melanoma color feature achieves higher true positive and true negative test rates than the corresponding rates for the color clustering ratio feature for all boundary area percentage cases tested. The percent melanoma color feature also tends to have lower standard deviations for the test results over the 18 random training/test sets than the corresponding test results for the color clustering ratio feature. Thus, it appears that the percent melanoma color feature is a more consistent discriminator than the color clustering ratio feature for the boundary area percentage case.
Second, the 10% boundary area percentage case for the percent melanoma color feature produces the highest true positive rate (89%) of the cases examined. Inspecting Fig. 7 shows that the true positive rate increases as the central portion of the skin lesion used for color feature analysis diminishes, except for the 75 and 100% (entire lesion) boundary area percentage cases for the color clustering ratio. In fact, the true positive rates for the 10 and 25% boundary area percentage cases exceed the entire lesion case (100%) by at least than 3% with greater true negative rates as well. Overall, the true negative rates are quite similar for the percent melanoma color feature for all cases explored. For the color clustering ratio feature, the 10,25 and 50% boundary area percentage cases have true positive test rates that exceed the entire lesion true positive test rate with greater true negative test rates for all cases except for the 10% case. These results indicate that the color discrimination information for the percent melanoma color and color clustering ratio features appears to be in the lesion region closest to the boundary. In order to evaluate if the boundary region is providing the most significant discrimination information, skin lesion discrimination using the offset interior boundary area percentage is examined.
Offset boundary area percentage experimental results
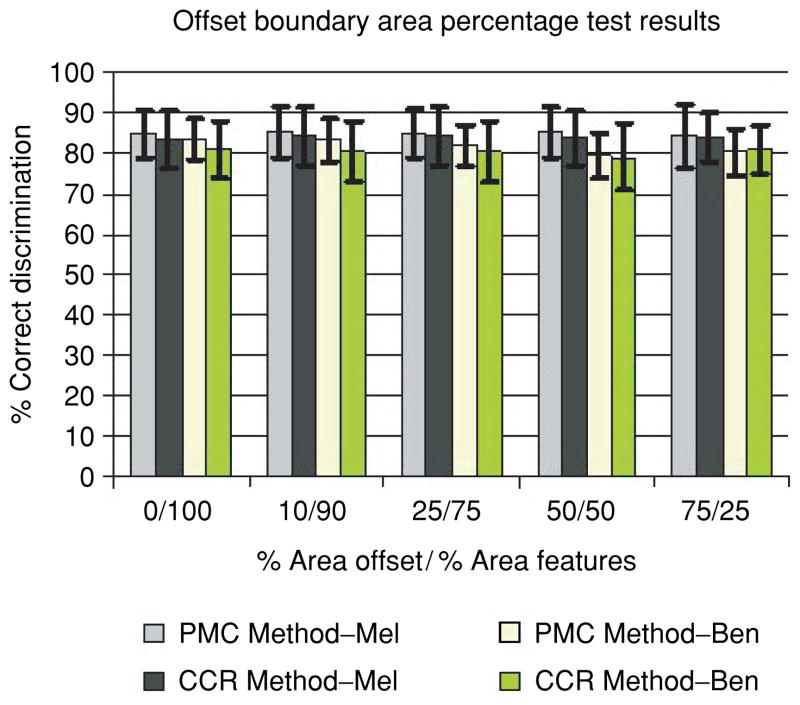
Because manually determined lesion borders may not be exact, there was a concern that some surrounding normal skin might be included in the feature calculations. In the second set of experiments, an increasing portion of the lesion boundary region was excluded for feature calculations, referenced as the offset boundary area percentage. For the offset boundary region, a uniform specified percentage of the lesion area is offset from the lesion boundary. Then, the remaining interior portion of the skin lesion is examined for feature analysis. Figure 8 presents the average and standard deviation test results for the percent melanoma color and color clustering ratio features for the offset interior boundary area percentage cases of 0% (entire lesion), 10,25, 50 and 75%. The horizontal axis shows the offset boundary area percentage of the lesion (% area offset) and the percentage of the lesion area that is used for feature calculations starting from the inner border of the offset region (% area features). The notations for the percent melanoma color and color clustering ratio melanoma and benign average and standard deviation results are the same as for Fig. 7.
Fig. 8.
Offset boundary area percentage average and standard deviation test results over 18 randomly chosen training/test sets for the percent melanoma color and color clustering ratio features. The horizontal axis shows the percentage of the lesion area offset from the lesion boundary (% area offset) and the percentage of lesion area used for feature calculations starting from the inner boundary of the offset region (% area features).
From Fig. 8 several observations are made. First, the true positive and true negative test rates are similar over the different offset regions examined for the percent melanoma color and color clustering ratio features, respectively. There does not appear to be any significant improvement in true positive or true negative rate as the offset region is increased for the respective features. Second, the percent melanoma color feature yields marginally better test results over the color clustering ratio feature for the offset interior boundary cases examined. This coincides with the results seen in Fig. 7 for the boundary area percentage cases, where the percent melanoma color feature produces better test results.
Third, the boundary area percentage test true positive and true negative results (Fig. 7) for the percent melanoma color feature are higher than the test results for every offset boundary area percentage case examined except for the 0/100 case (Fig. 8), which is the same as the 100% skin lesion area case (Fig. 7). In particular, the 10 and 25% boundary area percentage cases yield the highest overall true positive rates, with higher true negative rates than any offset interior boundary area percentage case. For the features examined, the results for the boundary area percentage and offset boundary percentage experiments appear to show that the most significant color discrimination information is located in the boundary region of the skin lesion. The experiments to this point have examined skin lesion discrimination based on color information at the boundary region, excluding the central portion of the lesion, and at the central portion of the lesion, excluding the boundary region of the lesion.
The final set of experiments explores lesion discrimination for lesion interior regions that leave out different percentages of the central most-region. Specifically, these experiments compare lesion discrimination capability for offset interior boundary area percentages that exclude different percentages of the lesion interior central region from feature calculations. Based on the experimental results for the boundary area percentage cases presented in Fig. 7, the 10 and 25% area boundaries yield the best melanoma discrimination capability for the percent melanoma color and color clustering ratio features. The goal with these experiments is to determine if there is an interior portion of the skin lesion with color discrimination information that is similar to the boundary region. Accordingly, an offset boundary area percentage of 10% is used as the basis for the lesion interior region color feature discrimination comparisons.
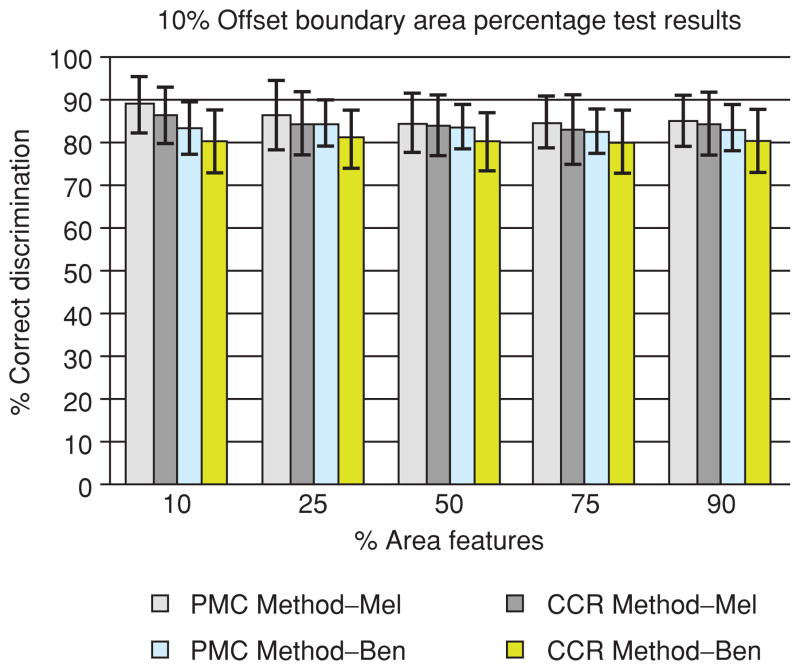
For the offset boundary area percentage set of experiments, a uniform specified percentage of the lesion area is offset from the lesion boundary. Then, a uniform specified percentage of the lesion area is examined for feature analysis. Specifically, lesion area percentages of 10, 25, 50, 75 and 90% (remaining lesion interior) were examined for the offset boundary of 10% of the lesion area. Figure 9 presents the average and standard deviation training and test results for the percent melanoma color and color clustering ratio features for the different interior lesion regions using 10% offset from the boundary. The horizontal axis shows the percentage of the skin lesion used for feature calculations starting from the inner boundary of the 10% offset. The notations for the percent melanoma color and color clustering ratio melanoma and benign average and standard deviation results are the same as for Fig. 7.
Fig. 9.
10% offset boundary area percentage average and standard deviation test results for 90, 75, 50, 25 and 10% lesion area cases starting from the inner boundary of the offset region over 18 test sets. The horizontal axis shows the percentage of the lesion area used for feature calculations (% area features).
From Fig. 9, it is observed that the melanoma discrimination rates for the percent melanoma color and color clustering ratio features are higher for the 10 and 25% interior lesion area regions. The melanoma discrimination rate for the percent melanoma color feature for the 10% interior lesion region of 88% (Fig. 9) is similar to the melanoma rate obtained for the 10 and 25% boundary area cases of 89 and 88% (Fig. 7), respectively. The corresponding benign discrimination rate for the 10% interior lesion region of 83% is lower than the benign discrimination rates obtained for the 10 and 25% boundary area cases of 86 and 86%, respectively. A parallel trend is observed for the color clustering ratio feature with melanoma discrimination rates of 86% for the 10% interior lesion region (Fig. 9) and 86 and 86% for the 10 and 25% boundary area cases (Fig. 7), respectively. The interior lesion region test results shown in Fig. 9 are similar but slightly lower than the corresponding 10, 25, 50 and 75% boundary area percentage test results shown in Fig. 7 for the percent melanoma color and color clustering ratio features, respectively.
The overall melanoma and benign lesion discrimination results from the experiments performed in this research support the contention that the boundary region contains the greatest color discrimination information for lesion screening. From the ABCD criteria of dermatology, the boundary region of skin lesions provides key information for evaluating border irregularity and color variegation in melanocytic lesions. An additional result found from the boundary area percentage and offset boundary area percentage experiments is that the percent melanoma color feature consistently outperformed the color clustering ratio feature. This result indicates that the presence of melanoma colors within the skin lesion provides more significant discrimination information than the grouping of melanoma colors. The clinical application of this result is that clustered colors appear to be no more significant than colors of arbitrary distribution within a lesion.
Conclusion
In this research, percent melanoma color and color clustering ratio features are examined for discriminating melanoma and benign skin lesions in clinical images. Experiments have been performed to assess the region of the skin lesion that provides the best color discrimination information. For the experiments performed, the percent melanoma color and color clustering ratio features produce comparable melanoma discrimination results for the different regions of the skin lesion examined. However, the percent melanoma color feature produces the highest melanoma discrimination results, 89 and 88% for the 10 and 25% boundary area percentage regions, respectively, of the skin lesion. These results appear to indicate that the optimal percent melanoma color feature information is located in the boundary region of the skin lesion. Similarly, the color clustering ratio feature also provides the highest melanoma discrimination rates in the 10 and 25% boundary percentage regions of the skin lesion over the different lesion regions explored. Overall, the experimental results show that the lesion region closest to the boundary provides better color discrimination information than the rest of the lesion.
Acknowledgments
This research was supported by NIH-SBIR grant CA 60294-03.
References
- 1.Friedman RJ, Rigel DS, Kopf AW. Early detection of malignant melanoma: the role of physician examination and self-examination of the skin. Ca-A Cancer J Clinicians. 1985;35:130–151. doi: 10.3322/canjclin.35.3.130. [DOI] [PubMed] [Google Scholar]
- 2.Landau M, Matz H, Tur E, Dvir M, Brenner S. Computerized system to enhance the clinical diagnosis of pigmented cutaneous malignancies. Int J Dermatol. 1999;38:443–446. doi: 10.1046/j.1365-4362.1999.00629.x. [DOI] [PubMed] [Google Scholar]
- 3.Schindewolf T, Stolz W, Albert R, Abmayr R, Abmayr W, Harms H. Classification of melanocytic lesions with color and texture analysis using digital image processing. Anal Quant Cytol Histol. 1993;15:101–111. [PubMed] [Google Scholar]
- 4.Andreassi L, Perotti R, Burroni M, Dell’Eva G, Biagioli M. Computerized image analysis of pigmented lesions. Chronica Dermatol. 1995;1:11–24. [Google Scholar]
- 5.Ercal F, Chawla A, Stoecker WV, Lee HC, Moss RH. Neural network diagnosis of malignant melanoma from color images. IEEE Trans Biomed Eng. 1994;41:837–845. doi: 10.1109/10.312091. [DOI] [PubMed] [Google Scholar]
- 6.Stoecker WV, Li WW, Moss RH. Automatic detection of asymmetry in skin tumors. Comput Med Imag Graph. 1992;16:191–197. doi: 10.1016/0895-6111(92)90073-i. [DOI] [PubMed] [Google Scholar]
- 7.Golston JE, Stoecker WV, Moss RH, Dhillon IPS. Automatic detection of irregular borders in melanoma and other skin tumors. Comput Med Imag Graph. 1992;16:199–203. doi: 10.1016/0895-6111(92)90074-j. [DOI] [PubMed] [Google Scholar]
- 8.Ganster H, Pinz A, Rohrer R, Wilding E, Binder M, Kittler H. Automated melanoma recognition. IEEE Trans Med Imag. 2001;20:233–238. doi: 10.1109/42.918473. [DOI] [PubMed] [Google Scholar]
- 9.Dhawan AP. An expert system for the early detection of melanoma using knowledge-based image analysis. Anal Quant Cytol Histol. 1989;10:405–416. [PubMed] [Google Scholar]
- 10.Sober AJ, Burstein JM. Computerized digital image analysis: an aid for melanoma diagnosis-preliminary investigations and brief review. J Dermatol. 1994;21:885–890. doi: 10.1111/j.1346-8138.1994.tb03307.x. [DOI] [PubMed] [Google Scholar]
- 11.Umbaugh SE, Moss RH, Stoecker WV. Automatic color segmentation of images with application to detection of variegated coloring in skin tumors. IEEE Eng Med Biol. 1989;8:43–52. doi: 10.1109/51.45955. [DOI] [PubMed] [Google Scholar]
- 12.Claridge E, Hall PN, Keefe M, et al. Shape analysis for classification of malignant melanoma. J Biomed Engng. 1992;14:229–234. doi: 10.1016/0141-5425(92)90057-r. [DOI] [PubMed] [Google Scholar]
- 13.Moss RH, Stoecker WV, Lin S-J, et al. Skin cancer recognition by computer vision. Comput Med Imag Graph. 1989;13:31–36. doi: 10.1016/0895-6111(89)90076-1. [DOI] [PubMed] [Google Scholar]
- 14.Lee T, Ng V, McLean D, Coldman A, Gallagher R, Sale J. Proceedings of the IEEE Pacific Rim Conference on Communications, Computers, and Signal Processing. Piscataway, NJ: IEEE; 1995. A multi-stage segmentation method for images of skin lesions; pp. 602–605. [Google Scholar]
- 15.Hance GA, Umbaugh SE, Moss RH, Stoecker WV. Unsupervised color image segmentation with application to skin tumor borders. IEEE Eng Med Biol. 1996;15:104–111. [Google Scholar]
- 16.Green A, Martin N, Pfitzner J, O’Rourke M, Knight N. Computer image analysis in the diagnosis of melanoma. J Am Acad Dermatol. 1994;31:958–964. doi: 10.1016/s0190-9622(94)70264-0. [DOI] [PubMed] [Google Scholar]
- 17.Seidenari S, Burroni M, Dell’Eva G, Pepe P, Belletti B. Computerized evaluation of pigmented skin lesion images recorded by a videomicroscope: comparison between polarizing mode observation and oil/slide mode observation. Skin Res Technol. 1995;1:187–191. doi: 10.1111/j.1600-0846.1995.tb00042.x. [DOI] [PubMed] [Google Scholar]
- 18.Aitken JF, Pfitzner J, Battistutta D, O’Rourke PK, Green AC, Martin NG. Reliability of computer image analysis of pigmented skin lesions of Australian adolescents. Cancer. 1996;78:252–257. doi: 10.1002/(SICI)1097-0142(19960715)78:2<252::AID-CNCR10>3.0.CO;2-V. [DOI] [PubMed] [Google Scholar]
- 19.Faziloglu Y, Stanley RJ, Moss RH, Stoecker WV, McLean R. Color histogram analysis for melanoma discrimination in clinical images. IEEE Trans Medical Imag. doi: 10.1034/j.1600-0846.2003.00030.x. in press. [DOI] [PMC free article] [PubMed] [Google Scholar]
- 20.Stanley RJ, Moss RH, Stoecker WV, Aggarwal C. A fuzzy-based histogram analysis technique for skin lesion discrimination in dermatology clinical images. Comput Med Imag Graph. doi: 10.1016/s0895-6111(03)00030-2. in press. [DOI] [PMC free article] [PubMed] [Google Scholar]
- 21.Grin C, Kopf AW, Welkovich B, Bar R, Levenstein M. Diagnostic accuracy in malignant melanoma. Arch Dermatol. 1990;126:763–766. [PubMed] [Google Scholar]
- 22.Lindelof B, Hedblad MA. Accuracy in the clinical diagnosis and pattern of malignant melanoma at a dermatological clinic. J Dermatol. 1994;21:461–464. doi: 10.1111/j.1346-8138.1994.tb01775.x. [DOI] [PubMed] [Google Scholar]
- 23.Kopf A, Mintzis M, Bar R. Diagnostic accuracy in malignant melanoma. Arch Dermatol. 1975;111:1291–1292. [PubMed] [Google Scholar]
- 24.Cassileth BR, Clark WH, Jr, Lusk EJ, Frederick BE, Thompson CJ, Walsh WP. How well do physicians recognize melanoma and other problem lesions? J Am Acad Dermatol. 1986;14:555–560. doi: 10.1016/s0190-9622(86)70068-6. [DOI] [PubMed] [Google Scholar]
- 25.Stoecker WV, editor. Computer applications in dermatology. New York: Appleton Lange Inc; 1993. [Google Scholar]


