Abstract
Purpose
High mobility group AT-hook 1 (HMGA1) is a non-histone nuclear binding protein that is developmentally regulated. HMGA1 is significantly overexpressed in and associated with high grade and advance stage of prostate cancer (PC). The oncogenic role of HMGA1 is at least mediated through chromosomal instability and structural aberrations. However, regulation of HMGA1 expression is not well understood. Identification of microRNA mediated HMGA1 regulation will provide a promising therapeutic target in treating PC.
Experimental Designs
In this study, we examined the functional relation between miR-296 and HMGA1 expression in several prostate cancer cell lines and a large prostate cancer cohort. We further examined the oncogenic property of HMGA1 regulated by miR-296.
Results
Here we report that miR-296, a microRNA predicted to target HMGA1, specifically represses HMGA1 expression by promoting degradation and inhibiting HMGA1translation . Repression of HMGA1 by miR-296 is direct and sequence-specific. Importantly, ectopic miR-296 expression significantly reduced prostate cancer cell proliferation and invasion, in part through the down-regulation of HMGA1. Examining prostate cancer patient samples, we found an inverse correlation between HMGA1 and miR-296 expression: high levels of HMGA1 were associated with low miR-296 expression and strongly linked to more advanced tumor grade and stage.
Conclusions
Our results indicate miR-296 regulates HMGA1 expression and is associated with PC growth and invasion.
Keywords: HMGA1, prostate cancer, microRNA
INTRODUCTION
High motility group At-hook genes, HMGA1 and HMGA2 are present at high levels in embryonic cells(1). Most differentiated normal mammalian cells express extremely low levels of HMGA1 mRNA and protein. HMGA1 is located on the short arm of human chromosome 6 (6p21), a region involved in chromosomal abnormalities associated with human neoplasms (2). Whereas expression of HMGA1 is largely undetectable in non-malignant prostate specimens (3), previous studies have shown that an increase in the level of HMGA1 expression is associated with high grade tumors and late stage prostate cancer (4). In a transgenic mouse model for PC, analysis of successive stages of prostate cancer, revealed that HMGA1 protein expression was confined to the later stages of neoplastic progression and was not detected at early stages of disease or in control prostate tissues from non-transgenic mice (5). The oncogenic property of HMGA1 is mediated, at least in part, through inhibition of p53 function (6). Furthermore, in PC cell lines, high levels of HMGA1 expression is associated with enhanced proliferation and metastatic potential in vitro (7). In fact, overexpression of HMGA1 in PC cell lines resulted in chromosomal instability and structural aberrations (8). The findings suggest that HMGA1 is involved in the development of unbalanced chromosomal rearrangements associated with prostate cancer (8).
MicroRNAs (miRNAs) are a class of small, non-coding RNAs that regulate the expression of certain genes, including tumor suppressors and oncogenes (9), at post-transcriptional and translational levels. Both increases and decreases in the expression of select miRNA has been documented in PC (9-12). Deregulation of miRNA expression is often associated with changes in the regulation of genes involved in cell proliferation and androgen independence (hormone naive versus hormone refractory) (12-13). MiRNA signatures accurately separated the carcinomas from the BPH samples and further classified the carcinomas according to their androgen-dependence. Thus miRNAs are potentially novel diagnostic and prognostic tools for prostate cancer (11). Interestingly, recent studies have shown that the expression of the HMGA family member, HMGA2, is regulated by the let-7 microRNA (14-17). However, the mechanism whereby HMGA1 expression is regulated is not well understood and the potential role of microRNAs in HMGA1 regulation has not been explored.
HMGA1 is a predicted target gene for both let-7 and miR-296 based on computer analyses. We conducted this study to characterize whether let-7 and miR-296 can specifically repress HMGA1 expression and regulate PC growth and invasion. We found that miR-296, but not let-7, significantly repressed HMGA1 expression at post-transcriptional and translational levels and reduced PC proliferation and invasion in vitro. Moreover, we found an inverse correlation between miR-296 and HMGA1 levels in advanced PC, associating changes in miR-296 expression with tumor progression via increased HMGA1 expression.
MATERIALS AND METHODS
Patient and tissue samples
A total of 196 cases prepared in two customized high density tissue microarrays (TMA) were included in this study (Table 1). TMA100 contained 100 PC cases (from the Cooperative PC Tissue Resource at New York University) and TMA96 contained 96 cases (from Northwestern University). The study was approved by our institutional review boards.
Table 1.
HMGA1 and miR-296 Expression in 212 PCs
| Tissue | No. cases | Benign | HGPIN | G3 | G4-5 | HMGA1 | miR-296 |
|---|---|---|---|---|---|---|---|
| TMA100 | 116 | 16 | 50 | 50 | yes | N/A | |
| TMA96 | 96 | 32 | 32 | 32 | yes | yes |
Cell lines
Six prostate cell lines were used for the study, including 4 prostate cancer cell lines: LNCaP, LNCaP-AI (variant of LNCaP) (18), and PC3 and DU145 cells, as well as 2 benign immortalized prostate epithelial cell lines: RC165 and RC170 (19).
MiR296 in situ hybridization
The hybridization system and probes, miRCURY LNA probes, miR-296, let-7c, and U6, were purchased from Exiqon (Vedbaek, Denmark) and utilized following the detailed procedure for in situ hybridization provided by the manufacturer’s protocol (20). The relative expressions of the selected miRNAs were scaled 0 as negative, 1 as weak, 2 as moderate and 3 as strong expression. The scores of the selected miRNA expression from each tissue was normalized by relative intensity of U6 expression (miRNA score/U6 score).
MiR-296 and let-7c mimics and inhibitors
MiR-296 and let-7c mimics and inhibitors were purchased from Dharmacon Inc. (Lafayette, CO). All experiments were controlled using a non-functional, double-stranded random 22 nt RNA (Block-iT, Invitrogen, Carlsbad, CA).
HMGA1 3′ UTR wild type and mutant constructs
The HMGA1 3′ untranslated region (UTR) cDNA (ID # 4308914) was purchased from Invitrogen (Carlsbad, CA). The PCR products of HMGA1 3′UTR with 4 and 3 miR-296 complementary sites (CS) were cloned into Luciferase Reporter Vector psiCHECK2 (Promega, Madison, WI) using the XhoI and NotI sites (Supplementary Table 1). The fidelity of the cDNA sequence was verified by sequencing analysis. The mutant HMGA1 3′UTR constructs were prepared and cloned into psiCHECK2 by RT-PCR with the degenerative mutant primers (summarized in Supplementary Table 1).
qRT-PCR and real-time RT-PCR
Detection of mature miRNAs was performed using real-time RT-PCR primers for mature miR-296 and qRT-PCR Detection Kits (Ambion, Austin, TX). Primers for HMGA1 were designed (forward 5′-ACTGGAGTCTCCTGTGGTGTGT-3′, reverse 5′ -AGTGCTATTTCCCCTCCCTTC-3′). cDNA products were quantified by qRT-PCR and normalized by the internal control products of U6 and β-actin.
Western blot analysis
The antibody against HMGA1 was kindly provided by Dr. Scott Lowe(21). Total proteins were prepared from fresh frozen tissue or cultured cell samples, separated through a 12% SDS–PAGE gel and then transferred to a PVDF membrane. Development of the immunoblot with anti-sera against HMGA1 and negative control HMGA1 blocking peptide (from Santa Cruz Biotechnology, Inc., CA) was tested and a single, specific HMGA1 band at 25kd was detected, as previously described.
MiRNA transfection
Prior to transfection, cells were placed in standard media without antibiotics for 24 hrs. As per manufacturer’s protocol, transfection was performed using the Lipofectamine system with microRNA concentrations of 40-120 nM in either 6 well plates. Cells receiving only the tagged random sequence double-stranded 22mer (Block-iT) were used as non-specific references at all data points. Following transfection, cells were harvested and analyzed at the indicated times.
Luciferase assays
PC3 cells and DU145 cell cultures were transfected with either: 400ng of the luciferase reporter psiCHECK2 control (Promega, Madison, WI), or 400 ng psiCHECK2 plus HMGA1 3′UTR constructs. Co-transfection of miR296 and let-7 mimics and inhibitors at various doses (0, 40, 80, and 120 nM) was also performed. Luciferase activity was measurred by the dual luciferase assays (Promega, Madison, WI).
Cellular Proliferation Assays
PC3 and DU145 cell lines stably transduced with pBabe or pBabe-HMGA1 (with and without miR-296 CS) were passed in 24-well plates in triplicate. Cells were subsequently transfected with control RNA (Block-iT), miR-296 and let-7c mimics and inhibitors at a dose of 80 nM. Cellular proliferation was measured at 24, 48, 72, and 96 hrs using the colorimetric WST-1 assay (Cell proliferation Reagent, Roche). HMGA1 siRNA (Dharmacon) was used at 100 nM.
Matrigel Invasion Assays
A cell suspension (5 × 10⁴) in 0.5 ml of RPMI 1640 medium with 0.1% bovine serum albumin was placed on the insert of the 24-well chambers 24 hrs after transfection with control, Block-iT, miR-296, and let-7c mimics and inhibitors, respectively, as described with BD Matrigel invasion chamber (22). After 24 hrs, the non-invading cells on the upper surface of the membrane were removed. Invasive cells on the lower surface of the membrane were stained with Diff Quick stain and counted under a light microscope.
Immunohistochemistry (IHC)
TMA blocks were sectioned at 4 microns. Immunohistochemical staining for HMGA1 was performed on a Ventana Nexus automated system (Tucson, Arizona). Immunoreactivity for HMGA1 was scored based on immunointensity (scaled 0, 1-3). For TMA100, immunoreactivity for HMGA1 in tumor tissue cores was scaled by scoring the net changes of HMGA1 (tumor minus average of normal immunointensity). For TMA96, immunoreactivity for HMGA1 was scaled by immunointensity from each case. The cases from TMA100 had well documented pathological and clinical condition of the disease and it was used for the analysis of HMGA1 in association with clinical and biomedical factors. TMA96 was collected to represent PIN and Gleason scores and it was used for the analysis of HMGA1 in association with miR-296 expression.
Statistical analysis
Mean and standard errors were calculated for quantitative values. Statistical significance was analyzed by a paired t-test and X2, and p-value <0.05 was considered significant. Regression analysis was used to compare the correlation of miR-296 and HMGA1 expression.
RESULTS AND DISCUSSION
Repression of HMGA1 by miR-296
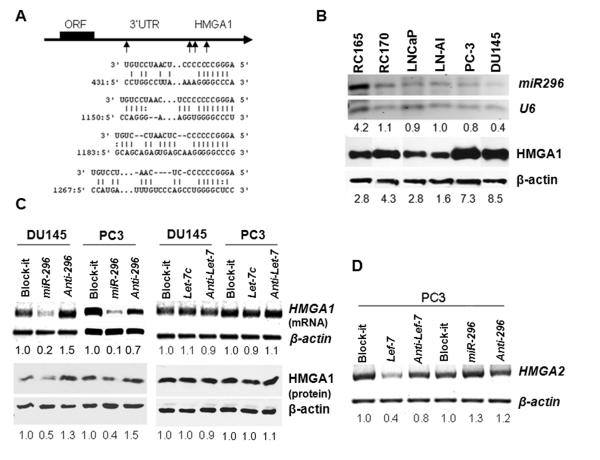
Post-translational modification of HMGA1 protein (acetylation and phosphorylation) in PC cell lines has been shown to be one important mechanism for functional regulation of HMGA1 (23). However, other mechanisms responsible for regulation of HMGA1 expression in PC remain understudied. MiRNA-mediated gene repression is a newly identified molecular mechanism that regulates gene expression. HMGA1 mRNA contains a 1.4 kb 3′ untranslational region (3′UTR). Computer analysis predicted that miRNAs let-7 and miR-296 can target HMGA1 (let-7 contains two and miR-296 contains four complementary sites (CSs), Figure 1A). These two miRNAs were found to be frequently dysregulated in PC (10-11, 24).
Figure 1. Repression of HMGA1 expression by miR-296 in PC.
A. Depiction illustrating four complementary sites of miR-296 in 3′UTR of HMGA1 gene. B. miR-296 (RT-PCR, top panel) and HMGA1 (WB, bottom panel) expression in six prostate cell lines (marked in top). C. Photonegative images showed miR-296 (left panel), but not let-7c (right panel), repression of HMGA1 expression at post-transcriptional (upper panel) and translational (lower panel) levels in PC3 and DU145 cell lines. D. Specificity for repression of HMGA2 by let-7c (left), but not miR-296 (right) in PC3 cell line, was detected by RT-PCR. The relative levels of HMGA1 and HMGA2 (mRNAs and protein products), and miRNA in comparison to loading controls of β-actin and U6 were quantified by density photometry (scores were indicated below each band).
We examined the expression of HMGA1 by Western blot analysis in 4 prostate cancer cell lines, androgen-dependent LNCaP, androgen-independent LNCaP-AI (expressing high levels of AR)(22), PC3 (negative for AR) and DU145 (negative for AR) cells, as well as 2 benign immortalized cell lines RC165 and RC170 (19). All of the cell lines express HMGA1 protein to varying levels. In particular, PC3 and DU145 had higher levels of HMGA1 expression than other cell lines (Figure 1B). These findings were consistent with previous report by Takaha et al. (8). The endogenous expression of miR-296 was also examined (Figure 1B), and all cell lines, excluding RC165, have relative low levels of endogenous miR296 expression.
To test whether let-7 and miR-296 can specifically regulate HMGA1 expression in PC cells, we transfected exogenous let-7c and miR-296 mimics and inhibitors into PC3 and DU145 cells. The experiments were divided into three groups: negative control (Block-iT, a non-functional, small, double stranded RNA), test 1 (let-7c and miR-296 mimics), and test 2 (let-7c and miR-296 inhibitors). Cells treated with miR-296 mimic demonstrated a 5-fold reduction in HMGA1 mRNA and 2-fold reduction of HMGA1 protein (Figure 1C). When cells were treated with miR-296 inhibitor, both HMGA1 mRNA and protein either returned to original baseline expression or showed even higher levels than untreated cells. In the same experiment, no visible repression of HMGA1 by let-7c was observed (Figure 1C). The specificity of HMGA1 repression by miR-296, but not by let-7c, was confirmed in PC3.
The specificity of sequence dependent miRNA repression for HMGAs was further examined using a PC3 cell line we previously developed that stably overexpressed HMGA2 in the context of endogenous HMGA1 (25). The cell line was transfected with either let-7c or miR-296 mimics, respectively. The transcript levels of HMGA2 were determined by RT-PCR. A reduction of HMGA2 in mRNA level was present in let-7c but not in miR-296 (Figure 1D). Therefore, findings suggest that miR-296, but not let-7c, controls HMGA1 expression, though they do not represent miRNA regulation at protein levels.
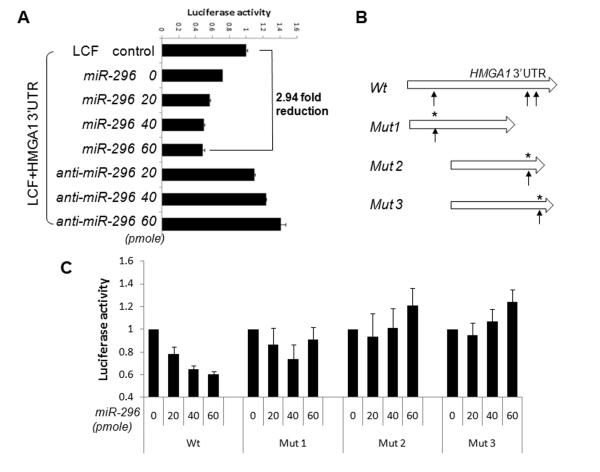
To characterize whether miR-296 repression of HMGA1 was through 3′UTR regulation, one control (Luciferase construct without HMGA1 3′UTR) and two test constructs (HMGA1 3′UTR containing 4 and 3 miR-296 CSs immediately downstream of Luciferase) were co-transfected with miR-296, respectively. MiR-296 showed a significant reduction of Luciferase activity, with either longer (four miR-296 CSs) or shorter (three miR-296 CSs) HMGA1 3′UTR (Figure 2A). The reduction of Luciferase activity by miR-296 could be rescued by co-transfection of miR-296 inhibitor (Figure 2A). To further test whether miR-296 repression of HMGA1 expression was sequence specific, we prepared three constructs with single nucleotide mutations in the ‘seed’ sequence of miR-296 CSs (Figure 2B, Supplementary Table 1). In comparison to wild type HMGA1 3′UTR, introduction of the site specific mutation in ‘seed’ sequence of miR-296 resulted in loss of luciferase interference (Figure 2C). The findings indicated that repression of HMGA1 by miR-296 was sequence-specific. As overexpression of HMGA1 is a major molecular change in PC, as well as other tumors, miR-296 may prove to play an important role in cancer through its regulation of HMGA1 expression.
Figure 2. Luciferase activity analysis for miR-296 mediated HMGA1 repression.
A. Luciferase activity (x-axis) was shown in PC3 cells transfected with LCF vector only (channel 1), LCF plus HMGA1 3′UTR construct (with 3 CSs) and cotransfected with miR-296 mimic (channel 2-5) and inhibitor (channel 6-8). Y axis represented the concentration of microRNAs in pmol. Reduction of Luciferase activity in channel 2 could be contributed by endogenous miR-296 and other microRNAs that had CSs in HMGA1 3′UTR. B. Sketch diagram illustrated the wild type and 3 mutant constructs of HMGA1 3′UTR for luciferase assay. C. The relative expression levels of luciferase (y axis) in 4 constructs (from left to right: wild type, mutants 1-3) treated with different doses of miR-296 mimic. Small t-bars were standard error.
Repression of HMGA1 expression by miR-296 inhibits in vitro cell growth and invasion
HMGA1 is overexpressed in many solid epithelial and mesenchymal neoplasms (26-27). Overexpression of HMGA1 in PC cell lines has been found to be associated with highly aggressive growth and a relatively high degree of metastatic potential (7). To characterize whether repression of HMGA1 by miR-296 influences PC cell growth and invasion, we conducted cell proliferation and migration analyses.
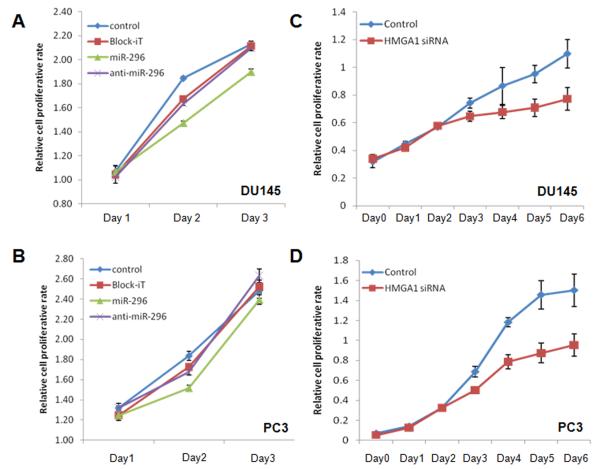
We selected PC3 and DU145 cell lines for the study. Cells treated with miR-296 had significantly decreased cell proliferation rates (p<0.05) in comparison to baseline or Block-iT controls at day 2. However, when cells were treated with miR-296 inhibitor, cell proliferation rates returned to levels similar to Block-iT control, or even slightly higher than baseline in PC3 cells (Figure 3A, 3B). The results from this experiment indicate that miR-296 functions as an anti-proliferation factor, through repression of HMGA1 and other predicted target genes in PC cells.
Figure 3. Anti-proliferative effects of miR-296 in PC3 and DU145 cell lines.
A-B. Cell proliferation rates (y-axis) of DU145 and PC3 cell lines were measured in control (cells receiving no treatment, line with diamonds), Block-iT (non-functional miRNA, line with cubic), miR-296 (line with triangles) and anti-miR296 (line with crosses) on days 1-3. Small t-bars were standard errors. Significant reduction of the cell proliferation rate was noted in miR-296 treated conditions. C-D. Cell proliferation rates in DU145 and PC3 cell line treated with no function siRNA and HMGA1 siRNA.
Given that miR-296 may have many potential targets in PC cells, the antiproliferative effect of miR-296 may not to be limited to repression of HMGA1. Therefore, we argued that the downregulation of HMGA1 by siRNAs should recapitulate miR-296 effects on cell proliferation. Indeed, the growth rate of the DU145 cell line were measured and significant reduction of cell proliferation by HMGA1 siRNA was noted by day 3 and the difference was further widened over the next 3 days between control and siRNA treatment (Figure 3C). The mitogenic effect of HMGA1 was further validated in the PC3 cell line (Figure 3D). This finding indicated that HMGA1 is one important mitogenic factor in the regulation of PC cell growth in vitro.
HMGA1 showed moderate expression in immortalized benign prostate epithelial cell lines RC165 and RC170 (Figure 1B). To examine whether HMGA1 expression has a role in controlling proliferation in these cell types, we introduced HMGA1 siRNA and miR-296 inhibitor and performed proliferation analysis. We found that repression of HMGA1 in RC165 and RC170 could significantly reduce cell proliferation (Supplementary Figure 1) as we saw in PC cell lines (Figure 3).
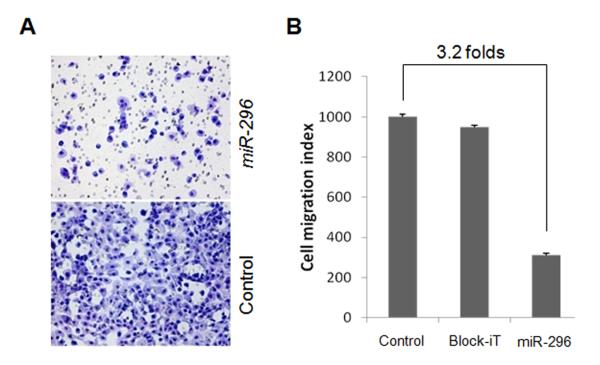
To evaluate whether miR-296 downregulation/repression of HMGA1 plays a role in aggressive cancer behavior, we examined the invasion capability of PC cells in the presence or absence of exogenous miR-296. In cells transfected with miR-296, the number of cells that successfully invaded through an extra-cellular membrane was quantified after 48 hrs. In the cell plates treated with miR-296, there were more than 3.2-fold reductions of tumor cells traversing the Matrigel membrane in comparison to the negative controls (Figure 4). This indicates that miR-296 -mediated repression of HMGA1 has a significant impact on tumor cell invasion (p<0.05).
Figure 4. Matrigel analysis of PC cell invasion.
A. Photomicrographs illustrated examples of cell density in control (block-iT, top) and miR-296 mimic (bottom). B. Histobars illustrated the average cell counts through the Biocoat Matrigel invasion chamber in vitro (y-axis) in different treatments (x-axis, listed below). Small t-bars were standard errors.
In addition to miR-296, HMGA1 may also be regulated by other mechanisms. Of note, HMGA1 is highly expressed in PC3 and DU145 (AR negative) compared to LNCaP (AR positive) cells (Fig. 1B), and there may be an inverse relationship between AR and HMGA1. It is of great interest to determine whether AR regulates the expression of HMGA1 in future.
Inverse relation of HMGA1 and miR-296 expression in human PC
Previous studies have shown that HMGA1 is overexpressed in PC (4-5, 7-8, 28). To determine whether overexpression of HMGA1 is a common molecular alteration related to PC, we examined HMGA1 expression in a total of 196 cases by immunohistochemistry in TMAs from two independent sources (TMA100 and TMA96, Table 1). The relative expression level of HMGA1 was scored by two pathologists (JM and JJW). We used benign prostate with or without high grade prostatic intraepithelial neoplasia (HGPIN) tissue as internal controls.
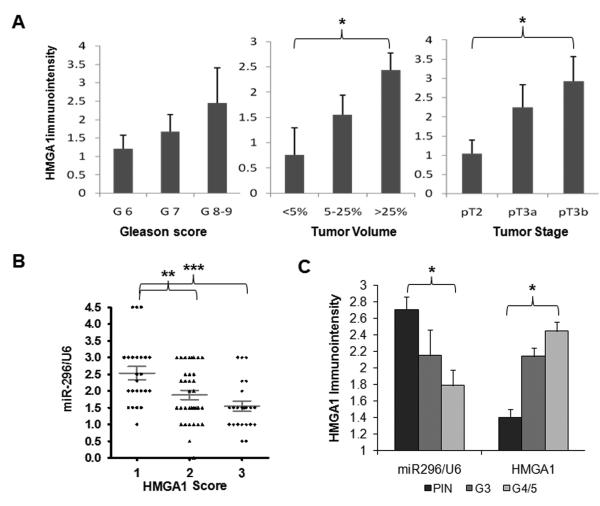
In TMA100, we noted that benign prostate acinar epithelial cells had low levels of immunoreactivity for HMGA1. We normalized relative HMGA1 expression by obtaining the net change of HMGA1 in PC (tumor epithelium-normal epithelium) (see Materials and Methods). A total of 71% (71 of 100) of PC had a net gain of immunoreactivity for HMGA1. Next, we compared the immunoreactivity of HMGA1 with patients’ age, race, preoperative PSA, tumor volume, grade, and stage. The average levels of HMGA1 immunoreactivity had a trend of positive correlation with tumor Gleason score, tumor volume, and stage (Figure 5A). Specifically, HMGA1 expression was able to segregate between low volume (<5%) and large volume (>25%) disease and with stage pT2 and pT3b, respectively (p<0.05) (Figure 5A).
Figure 5. Correlation analysis of HMGA1 and miR-296 expression in PC population.
A. Histograms illustrating the average immunoreactivity for HMGA1 (y axis) in association with tumor grade (left), tumor volume (middle), and tumor stage (right) in TMA100. B. Dot plot analysis of the relative expression of miR-296/U6 in different levels of immunoreactivity (scales 1-3) for HMGA1. Each dot represented one case. Mean values and standard errors were shown. C. Histobars represent the relative expression of HMGA1 (right) and miR-296/U6 (left) in high grade intraepithelial neoplasia (PIN), low (G3) and high (G4-5) grade PC. Small t-bars are standard errors. *: p<0.05; **: p<0.01; ***: p<0.001
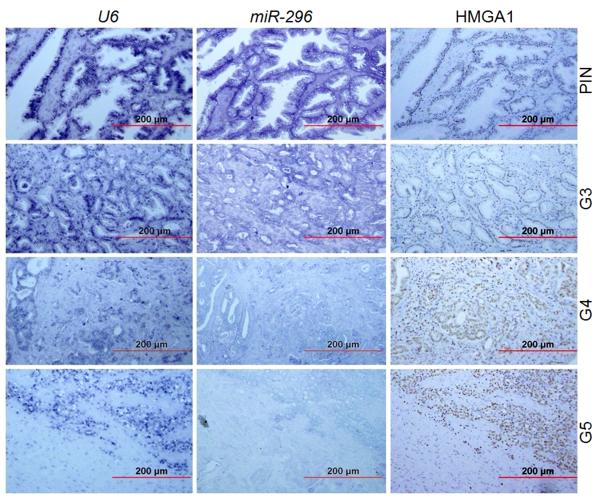
To compare whether HMGA1 expression was correlated to miR-296 expression, we examined HMGA1 and miR-296 expression in TMA96, in which, equal numbers of cases from HG-PIN, low grade PC (Gleason grade 3), and high grade PC (Gleason grade 4 and 5) were included. In serial sections of TMA96, the levels of HMGA1 and miR-296 were determined by immunohistochemistry and microRNA in situ hybridization (Figure 6). The preservation of RNA in each tissue core was normalized by the expression level of U6 (Figure 6). Levels of HMGA1 in TMA96 were scored as indicated above for TMA100.
Figure 6. Expression of HMGA1 and miR296 in PC.
Photomicrographs illustrated the serial sections to compare HMGA1 (immunoreactivity) and miR-296 (in situ hybridization) expression in high grade prostate intraepithelial neoplasia (PIN), prostate adenocarcinoma of low grade (Gleason score 3) and of high grade (Gleason score 4 and 5) PC tissue. U6 was RNA control for miR-296. Red bars were the actual size of magnification.
To characterize the inverse correlation of HMGA1 and miR-296 expression, we compared the relative expression levels of these two molecules in serial section of same tissue cores. As illustrated in Figure 5B, a moderate inverse correlation (R=−0.39) of HMGA1 and miR-296 was observed. The level of miR-296 expression was significantly higher in tumors with lower immunoreactivity for HMGA1 than in tumors with higher HMGA1 (p<0.01, Figure 5B).
In TMA96, the average immunoreactivity for HMGA1 was 1.4±0.10 in HGPIN, 2.14±0.11 in Gleason grade 3, and 2.45±0.11 in Gleason grade 4-5 (p<0.05, Figure 5C). In contrast, the scores of miR-296 intensity were 2.71±0.16 in HGPIN, 2.15±0.31 in Gleason grade 3, and 1.79±0.19 in Gleason grade 4-5 (p<0.05, Figure 5C). We further analyzed the distribution of different expression levels of HMGA1 and miR-296 based on the numbers of cases (in percentage) scored as negative, weak (1+), moderate (2+), and strong (3+). About 52% of cases with Gleason grade 4-5 had high (3+) levels of HMGA1 immunoreactivity, whereas 63% of cases with HGPIN had low levels of HMGA1 immunoreactivity (score 1+ or less). By contrast, nearly 47% cases with HG-PIN had high levels of miR-296 expression (score 3+), while the majority (79%) of cases with Gleason grade 4-5 showed low level of miR-296 expression (score 1+ or less). These findings indicate that higher levels of HMGA1 and lower levels of miR-296 are characteristic of high grade PC.
In summary, this study identifies miR-296 as a specific regulator of the oncogene HMGA1 in PC cell lines. The pair HMGA1: miR-296 can serve as a new molecular marker to study both HMGA1 regulation in tumorigenesis and the potential developmental function of miR-296 as a regulator for HGMA1 expression. Since miR-296 may regulate a large number of target genes, it is of great interest to further study its role in modulating tumor growth in relation to other target genes.
Supplementary Material
S Figure 1. Repression of HMGA1 expression reduces cell proliferation rate in prostate epithelial cell lines RC165 and RC170. A and C: Transient transfection of HMGA1 siRNA in RC165 (A) and RC170 (C) significantly reduces the cell proliferation at day 6. B and D: Transient transfection of miR-296 inhibitor in RC165 (B) and RC170 (D) significantly reduces the cell proliferation at days 4 and 6.
Supplementary Table 1 Primer sequences
TRANSLATIONAL SIGNIFICANCE.
HMGA1, high motility group At-hook gene 1, protein is an oncofetal protein that is significantly overexpressed in and associated with high grade and advance stage of prostate cancer. In vitro studies reveal that HMGA1 overexpression enhances PC proliferation and metastatic potential. In particular, the oncogenic role of HMGA1 is at least mediated through chromosomal instability and structural aberrations. Identification of microRNA mediated HMGA1 regulation will provide a promising therapeutic target in treating PC.
ACKNOWLEDGEMENT
We would like to thank Dr. Michael J. Garabedian for critical review of the manuscript, Jiri Zavadil and Xuanyi Zou for technical assistance. We would also like to thank Dr. Scott Lowe for providing HMGA1 antibody.
Grants: This work is supported by VA Merit Review, DOD (PC080010) grants, NYUSOM Urologic Center of Excellence and CTSI (1UL1RR029893) funds to PL, DOD and NMH Dixon translation grants to JJW and NYU CTSI TL1 fellowship (1UL1RR029893) to GD.
REFERENCE
- 1.Chiappetta G, Avantaggiato V, Visconti R, Fedele M, Battista S, Trapasso F, et al. High level expression of the HMGI (Y) gene during embryonic development. Oncogene. 1996;13:2439–46. [PubMed] [Google Scholar]
- 2.Johnson KR, Lehn DA, Elton TS, Barr PJ, Reeves R. Complete murine cDNA sequence, genomic structure, and tissue expression of the high mobility group protein HMG-I(Y) J Biol Chem. 1988;263:18338–42. [PubMed] [Google Scholar]
- 3.Tamimi Y, van der Poel HG, Denyn MM, Umbas R, Karthaus HF, Debruyne FM, et al. Increased expression of high mobility group protein I(Y) in high grade prostatic cancer determined by in situ hybridization. Cancer Res. 1993;53:5512–6. [PubMed] [Google Scholar]
- 4.Tamimi Y, van der Poel HG, Karthaus HF, Debruyne FM, Schalken JA. A retrospective study of high mobility group protein I(Y) as progression marker for prostate cancer determined by in situ hybridization. Br J Cancer. 1996;74:573–8. doi: 10.1038/bjc.1996.403. [DOI] [PMC free article] [PubMed] [Google Scholar]
- 5.Ayoubi TA, Jansen E, Meulemans SM, Van de Ven WJ. Regulation of HMGIC expression: an architectural transcription factor involved in growth control and development. Oncogene. 1999;18:5076–87. doi: 10.1038/sj.onc.1202881. [DOI] [PubMed] [Google Scholar]
- 6.Pierantoni GM, Rinaldo C, Mottolese M, Di Benedetto A, Esposito F, Soddu S, et al. High-mobility group A1 inhibits p53 by cytoplasmic relocalization of its proapoptotic activator HIPK2. J Clin Invest. 2007;117:693–702. doi: 10.1172/JCI29852. [DOI] [PMC free article] [PubMed] [Google Scholar] [Retracted]
- 7.Diana F, Di Bernardo J, Sgarra R, Tessari MA, Rustighi A, Fusco A, et al. Differential HMGA expression and post-translational modifications in prostatic tumor cells. Int J Oncol. 2005;26:515–20. [PubMed] [Google Scholar]
- 8.Takaha N, Hawkins AL, Griffin CA, Isaacs WB, Coffey DS. High mobility group protein I(Y): a candidate architectural protein for chromosomal rearrangements in prostate cancer cells. Cancer research. 2002;62:647–51. [PubMed] [Google Scholar]
- 9.Volinia S, Calin GA, Liu CG, Ambs S, Cimmino A, Petrocca F, et al. A microRNA expression signature of human solid tumors defines cancer gene targets. Proceedings of the National Academy of Sciences of the United States of America. 2006;103:2257–61. doi: 10.1073/pnas.0510565103. [DOI] [PMC free article] [PubMed] [Google Scholar]
- 10.Ozen M, Creighton CJ, Ozdemir M, Ittmann M. Widespread deregulation of microRNA expression in human prostate cancer. Oncogene. 2008;27:1788–93. doi: 10.1038/sj.onc.1210809. [DOI] [PubMed] [Google Scholar]
- 11.Porkka KP, Pfeiffer MJ, Waltering KK, Vessella RL, Tammela TL, Visakorpi T. MicroRNA expression profiling in prostate cancer. Cancer research. 2007;67:6130–5. doi: 10.1158/0008-5472.CAN-07-0533. [DOI] [PubMed] [Google Scholar]
- 12.Lin SL, Chiang A, Chang D, Ying SY. Loss of mir-146a function in hormone-refractory prostate cancer. RNA. 2008;14:417–24. doi: 10.1261/rna.874808. [DOI] [PMC free article] [PubMed] [Google Scholar]
- 13.Shi XB, Xue L, Yang J, Ma AH, Zhao J, Xu M, et al. An androgen-regulated miRNA suppresses Bak1 expression and induces androgen-independent growth of prostate cancer cells. Proc Natl Acad Sci U S A. 2007;104:19983–8. doi: 10.1073/pnas.0706641104. [DOI] [PMC free article] [PubMed] [Google Scholar]
- 14.Park SM, Shell S, Radjabi AR, Schickel R, Feig C, Boyerinas B, et al. Let-7 prevents early cancer progression by suppressing expression of the embryonic gene HMGA2. Cell Cycle. 2007;6:2585–90. doi: 10.4161/cc.6.21.4845. [DOI] [PubMed] [Google Scholar]
- 15.Lee YS, Dutta A. The tumor suppressor microRNA let-7 represses the HMGA2 oncogene. Genes Dev. 2007;21:1025–30. doi: 10.1101/gad.1540407. [DOI] [PMC free article] [PubMed] [Google Scholar]
- 16.Mayr C, Hemann MT, Bartel DP. Disrupting the pairing between let-7 and Hmga2 enhances oncogenic transformation. Science. 2007;315:1576–9. doi: 10.1126/science.1137999. [DOI] [PMC free article] [PubMed] [Google Scholar]
- 17.Wang T, Zhang X, Obijuru L, Laser J, Aris V, Lee P, et al. A micro-RNA signature associated with race, tumor size, and target gene activity in human uterine leiomyomas. Genes Chromosomes Cancer. 2007;46:336–47. doi: 10.1002/gcc.20415. [DOI] [PubMed] [Google Scholar]
- 18.Wang LG, Ossowski L, Ferrari AC. Androgen receptor level controlled by a suppressor complex lost in an androgen-independent prostate cancer cell line. Oncogene. 2004;23:5175–84. doi: 10.1038/sj.onc.1207654. [DOI] [PubMed] [Google Scholar]
- 19.Gu Y, Li H, Miki J, Kim KH, Furusato B, Sesterhenn IA, et al. Phenotypic characterization of telomerase-immortalized primary non-malignant and malignant tumor-derived human prostate epithelial cell lines. Exp Cell Res. 2006;312:831–43. doi: 10.1016/j.yexcr.2005.11.029. [DOI] [PubMed] [Google Scholar]
- 20.Kloosterman WP, Wienholds E, Ketting RF, Plasterk RH. Substrate requirements for let-7 function in the developing zebrafish embryo. Nucleic Acids Res. 2004;32:6284–91. doi: 10.1093/nar/gkh968. [DOI] [PMC free article] [PubMed] [Google Scholar]
- 21.Narita M, Krizhanovsky V, Nunez S, Chicas A, Hearn SA, Myers MP, et al. A novel role for high-mobility group a proteins in cellular senescence and heterochromatin formation. Cell. 2006;126:503–14. doi: 10.1016/j.cell.2006.05.052. [DOI] [PubMed] [Google Scholar]
- 22.Li Y, Wang L, Zhang M, Melamed J, Liu X, Reiter R, et al. LEF1 in androgen-independent prostate cancer: regulation of androgen receptor expression, prostate cancer growth, and invasion. Cancer Res. 2009;69:3332–8. doi: 10.1158/0008-5472.CAN-08-3380. [DOI] [PMC free article] [PubMed] [Google Scholar]
- 23.Jiang X, Wang Y. Acetylation and phosphorylation of high-mobility group A1 proteins in PC-3 human tumor cells. Biochemistry. 2006;45:7194–201. doi: 10.1021/bi060504v. [DOI] [PubMed] [Google Scholar]
- 24.Calin GA, Croce CM. MicroRNAs and chromosomal abnormalities in cancer cells. Oncogene. 2006;25:6202–10. doi: 10.1038/sj.onc.1209910. [DOI] [PubMed] [Google Scholar]
- 25.Peng Y, Laser J, Shi G, Mittal K, Melamed J, Lee P, et al. Antiproliferative effects by Let-7 repression of high-mobility group A2 in uterine leiomyoma. Mol Cancer Res. 2008;6:663–73. doi: 10.1158/1541-7786.MCR-07-0370. [DOI] [PubMed] [Google Scholar]
- 26.Hauke S, Leopold S, Schlueter C, Flohr AM, Escobar H Murua, Rogalla P, et al. Extensive expression studies revealed a complex alternative splicing pattern of the HMGA2 gene. Biochim Biophys Acta. 2005;1729:24–31. doi: 10.1016/j.bbaexp.2005.03.006. [DOI] [PubMed] [Google Scholar]
- 27.Zhang Q, Zhang K, Zou Y, Perna A, Wang Y. A quantitative study on the in vitro and in vivo acetylation of high mobility group A1 proteins. J Am Soc Mass Spectrom. 2007;18:1569–78. doi: 10.1016/j.jasms.2007.05.020. [DOI] [PMC free article] [PubMed] [Google Scholar]
- 28.Takamizawa J, Konishi H, Yanagisawa K, Tomida S, Osada H, Endoh H, et al. Reduced expression of the let-7 microRNAs in human lung cancers in association with shortened postoperative survival. Cancer Res. 2004;64:3753–6. doi: 10.1158/0008-5472.CAN-04-0637. [DOI] [PubMed] [Google Scholar]
Associated Data
This section collects any data citations, data availability statements, or supplementary materials included in this article.
Supplementary Materials
S Figure 1. Repression of HMGA1 expression reduces cell proliferation rate in prostate epithelial cell lines RC165 and RC170. A and C: Transient transfection of HMGA1 siRNA in RC165 (A) and RC170 (C) significantly reduces the cell proliferation at day 6. B and D: Transient transfection of miR-296 inhibitor in RC165 (B) and RC170 (D) significantly reduces the cell proliferation at days 4 and 6.
Supplementary Table 1 Primer sequences


