Abstract
We have previously shown that chronic exposure to ambient fine particulate matter (less than 2.5 μm in aerodynamic diameter, PM2.5) pollution in conjunction with high-fat diet induces insulin resistance through alterations in inflammatory pathways. In this study, we evaluated the effects of PM2.5 exposure over a substantive duration of a rodent’s lifespan and focused on the impact of long-term exposure on adipose structure and function. C57BL/6 mice were exposed to PM2.5 or filtered air (FA) (6 h/day, 5 days/week) for duration of 10 months in Columbus, OH. At the end of the exposure, PM2.5-exposed mice demonstrated insulin resistance (IR) and a decrease in glucose tolerance compared with the FA-exposed group. Although there were no significant differences in circulating cytokines between PM2.5- and FA-exposed groups, circulating adiponectin and leptin were significantly decreased in PM2.5-exposed group. PM2.5 exposure also led to inflammatory response and oxidative stress as evidenced by increase of Nrf2-regulated antioxidant genes. Additionally, PM2.5 exposure decreased mitochondrial count in visceral adipose and mitochondrial size in interscapular adipose depots, which were associated with reduction of uncoupling protein 1 (UCP1) expression and downregulation of brown adipocyte-specific gene profiles. These findings suggest that long-term ambient PM2.5 exposure induces impaired glucose tolerance, IR, inflammation, and mitochondrial alteration, and thus, it is a risk factor for the development of type 2 diabetes.
Keywords: air pollution, inflammation, glucose tolerance, mitochondria
Accumulating evidence implicates fine particulate matter (PM2.5) air pollution as a risk factor that leads to adverse human health effects in developed and developing countries (Kan et al., 2009; Pope et al., 1995; Samet et al., 2000; Schwartz, 1999). Recent data from large population cohorts have provided compelling associations between PM2.5 exposure and increased cardiovascular morbidity and mortality (Miller et al., 2007; Pope et al., 2004). Studying insulin resistance (IR) and type 2 diabetes mellitus development and its relation to air pollution may help clarify the causative relations between environmental factors and the development of cardiovascular risk (Franks et al., 2010; Mattsson et al., 2008). Inflammation and oxidative stress pathways in disease development may provoke maladaptive responses that, in turn, adversely affect organ function and appear to play critical roles in this process as demonstrated by numerous investigations (Dandona et al., 2004; Hotamisligil, 2006; Houstis et al., 2006; Shoelson et al., 2006). The effects of PM2.5 exposure on cardiovascular and pulmonary systems have been extensively studied with both short- and long-term exposures implicated in major adverse cardiovascular events (Brook et al., 2010; Mills et al., 2009). Although numerous studies have focused on the acute and short-term PM2.5 exposure, the effect of long-term PM2.5 exposure on mitochondrial alteration and IR has little been investigated, and underlying factors remain to be understood.
Adipose tissue exerts important endocrine and metabolic functions and plays a key role in the control of energy balance and lipid homeostasis (Park et al., 2008). In mammals, adipocytes have been classified into two distinct types: white adipose tissue (WAT), the primary site of energy storage, and brown adipose tissue (BAT), specialized for energy expenditure (Spiegelman and Flier, 2001). The physiological role of BAT is to metabolize fatty acids and generate heat (Spiegelman and Flier, 2001). Due to these functional differences, the imbalance between WAT and BAT affects systemic energy balance and thus may contribute to the development of IR and adiposity. Recent studies suggest that BAT content and function may be an independent predictor of insulin sensitivity and potentially protecting against obesity (Cypess et al., 2009). Although a number of studies suggest that air pollution may lead to inflammation, IR, and adiposity (Frampton, 2006; O'Neill et al., 2007; Sun et al., 2005, 2009; van Eeden et al., 2001), few studies have documented the effect of long-term PM2.5 air pollution on the alterations of adipose tissue depots.
Therefore, we hypothesized that long-term exposure to PM2.5 air pollution would induce low grade, but prolonged, inflammatory response in adipose tissues, exert effects on function of BAT, and result in IR and mitochondrial dysfunction and thereby exacerbate the development of type 2 diabetes, obesity, and metabolic disorders. We employed an extended time of PM2.5 exposure (10 months) to mimic PM2.5 pollution exposure over a substantive duration of an individual’s lifespan.
MATERIALS AND METHODS
Animals.
Four-week-old male C57BL/6 mice were purchased from Jackson Laboratories (Bar Harbor, ME) and were fed ad libitum standard rodent chow; filtered tap water was freely available. The protocols and the use of animals were approved by and in accordance with The Ohio State University (OSU) Animal Care and Use Committee.
PM2.5 exposure.
Mice were randomly assigned a group and were exposed to either ambient concentrated PM2.5 or filtered air (FA) for 6 h/day, 5 days/week from April 2009 to January 2010 in Columbus, Ohio in a trailer-mounted exposure system, “Ohio Air Pollution Exposure System for Interrogation of Systemic Effects (OASIS) 1” (Laing et al., 2010; Xu et al., 2010; Ying et al., 2009). The total duration of exposures was 1302 h.
Measurements of blood glucose and insulin.
Before and after the exposure to FA or PM2.5, an ip glucose tolerance test was performed. Briefly, the mice were fasted overnight and dextrose (2 mg/g body weight) was injected ip. Blood glucose measurements were conducted with an Elite Glucometer (Bayer) at baseline and 30, 60, 90, and 120 min after the dextrose injection. Insulin levels were determined using an Ultra Sensitive Mouse Insulin ELISA Kit (Crystal Chem Inc., Downers Grove, IL). Homeostasis model assessment (HOMA) indices were calculated based on 1 mg of insulin as equivalent to 24 IU, using the formula HOMA = [fasting insulin concentration (ng/ml) × 24 × fasting glucose concentration (mg/dl)]/405 (Xu et al., 2010).
Circulating inflammatory biomarkers, adiponectin, and leptin measurement.
At the end of the study, blood samples were collected and spun, and serum was stored at −80°C for the analysis of cytokines, adiponectin, and leptin. Cytokine levels were determined by Cytometric Bead Array (BD Biosciences, San Jose, CA). Serum was incubated with beads specific for tumor necrosis factor (TNF), interferon γ (IFN-γ), monocyte chemoattractant protein 1 (MCP-1), interleukin 6 (IL-6), IL-10, and IL-12p70 according to the manufacturer’s instructions. The total amount of cytokines was then determined using a BD LSR II instrument and analyzed by the BD CBA software (BD Biosciences). Adiponectin and leptin levels were determined by using an adiponectin and leptin quantification kit (R&D Systems, Minneapolis, MN) following the manufacturer's instructions.
Immunohistochemical staining.
Immunohistochemical staining was performed as previously described (Xu et al., 2010). Briefly, deparaffinized sections (5 μm) were subjected to heat-induced antigen retrieval. The slides were dipped in 0.3% H2O2 for 10 min to quench the endogenous peroxidase. The sections were then incubated in 1% BSA/PBS for 10 min, followed by overnight incubation with primary antibodies at 4°C. Afterward, the slides were incubated at room temperature for 2 h with appropriate horseradish peroxidase (HRP)-conjugated secondary antibodies. The stain was developed using Fast 3,3′-diaminobenzidine tablet sets (D4293; Sigma, St Louis, MO). The sections were counterstained with hematoxylin and examined by light microscopy. The primary antibodies were rat anti-mouse F4/80 (AbD Serotec, Raleigh, NC), rat anti-mouse UCP1 (Abcam), and rabbit anti-iNOS (Santa Cruz Biotechnology, Santa Cruz, CA). All measurements were conducted in a double-blinded manner by two independent investigators.
Quantification of superoxide production by dihydroethidium staining.
The oxidative fluorescent probe dihydroethidium (DHE) was used to evaluate in situ O2− production on histological sections. DHE is a cell permeable dye that is oxidized by O2− to ethidium bromide, which subsequently intercalates with DNA and is trapped within cell nuclei. Cryosections (10 μm) were incubated with DHE (10 μM, Molecular Probes, Invitrogen) in a light-protected humidified chamber at room temperature for 30 min. Sections were then rinsed with phosphate buffered saline and analyzed with a fluorescent Nikon Eclipse FN1 microscope (Nikon, Tokyo, Japan). Acquisition settings of the camera were identical for all images. Automatic computer-based analysis was performed using MetaMorph software. Data are expressed as % fluorescence area.
Transmission electron microscopic imaging.
To investigate the mitochondrial changes in situ between FA- and PM2.5-exposed groups, we examined the ultrastructure of epididymal and interscapular adipose depots by transmission electron microscopic (TEM) as described previously (Xu et al., 2011). There were five animals in each group for mitochondrial assessment. For the morphometric analysis, mitochondrial size and number were analyzed in 5 to 8 micrographs per group by NIH ImageJ software.
Real-time PCR.
Epididymal and interscapular adipose tissues from the mice were excised, and RNA was isolated using Trizol reagent according to the manufacturer’s instructions. Total RNA was then converted into cDNA using a High Capacity cDNA Reverse Transcription Kit (Applied Biosystems, Foster City, CA). The quantification of gene expression was determined by real-time PCR. All reactions were performed under the same condition: 50°C for 2 min, 95°C for 10 min, 40 cycles of 95°C for 15 s, and 60°C for 1 min. The primers for mouse uncoupling protein 1 (Ucp1), PRD1-BF1-RIZ1 homologous domain containing 16 (Prdm16), peroxisome proliferator-activated receptor-γ coactivator 1-α (Pgc-1α), CCAAT enhancing binding protein β (C/ebpβ), cell death-inducing DNA fragmentation factor–like effector A (Cidea), type 2 iodothyronine deiondinase (Dio2), peroxisome proliferator-activated receptor gamma 2 (Pparg2), elongation of very long-chain fatty acid 3 (Elovl3), NF-E2-related factor 2 (Nrf2), NAD(P)H quinone oxidoreductase 1 (Nqo1), glutamate-cysteine ligase modifier subunit (Gclm), and β-actin are showed in Table 1. Beta-actin was used as the control gene, and all data are presented as relative mRNA levels.
TABLE 1.
Primers Used for Real-time PCR
| Primer | Forward oligonucleotides | Reverse oligonucleotides |
| Ucp1 | 5′-ACTGCCACACCTCCAGTCATT-3′ | 5′-CTTTGCCTCACTCAGGATTGG-3′ |
| Prdm16 | 5′-CAGCACGGTGAAGCCATTC-3′ | 5′-GCGTGCATCCGCTTGTG-3′ |
| Pgc-1α | 5′-CCCTGCCATTGTTAAGACC-3′ | 5′-TGCTGCTGTTCCTGTTTTC-3′ |
| C/ebpβ | 5′-ACGACTTCCTCTCCGACCTCT-3′ | 5′-CGAGGCTCACGTAACCGTAGT-3′ |
| Cidea | 5′-ATCACAACTGGCCTGGTTACG-3′ | 5′-TACTACCCGGTGTCCATTTCT-3′ |
| Dio2 | 5′-AAGGCTGCCGAATGTCAACGAATG-3′ | 5′-TGCTGGTTCAGACTCACCTTGGAA-3′ |
| Pparg2 | 5′-GCATGGTGCCTTCGCTGA-3′ | 5′-TGGCATCTCTGTGTCAACCATG-3′ |
| Elovl3 | 5′-GATGGTTCTGGGCACCATCTT-3′ | 5′-CGTTGTTGTGTGGCATCCTT-3′ |
| Nrf2 | 5′-TCACACGAGATGAGCTTAGGGCAA-3′ | 5′-TACAGTTCTGGGCGGCGACTTTAT-3′ |
| NQO1 | 5′-ATGGCATCCAGTCCTCCATCAAGA-3′ | 5′-ACAAGTTAGTCCCTCGGCCATTGT-3′ |
| Gclm | 5′-CCACCAGATTTGACTGCCTTTGCT-3′ | 5′-AATCCTGGGCTTCAATGTCAGGGA-3′ |
| β-actin | 5′-TGTGATGGTGGGAATGGGTCAGAA-3′ | 5′-TGTGGTGCCAGATCTTCTCCATGT-3′ |
Western blotting.
Liver, soleus muscle, epididymal, and interscapular fat depots were homogenized in lysis buffer (Thermo Scientific, Rockford, IL) with protease inhibitor cocktail (Roche Diagnostics, Indianapolis, IN). The same amounts of protein (60 μg for epididymal fat depots and 20 μg for the others) were separated with SDS-PAGE in 10% polyacrylamide gel and then transferred to PVDF membranes (Bio-Rad, Hercules, CA). The membranes were immunoblotted with primary antibodies against UCP1 (1:1000, Abcam), phospho-Akt (Ser473, 1:1000, Cell Signaling, Danvers, MA), or Akt (1:1000, Cell Signaling), followed by treatment with HRP-conjugated anti-rabbit IgG (Santa Cruz Biotechnology) at a 1:5000 dilution. The membranes were detected with enhanced chemiluminescence (Super Signal West Pico; Thermo Scientific), followed by exposure to X-ray film. The protein bands on the X-ray film were scanned, and band density was calculated by Quantity One software (Bio-Rad).
Statistical analysis.
Data are expressed as mean ± SE unless otherwise indicated. The results of the experiments were analyzed by unpaired t tests. All the analyses were performed using Graphpad Prism v5.0 (GraphPad Software, San Diego, CA). In all cases, a p value of <0.05 was considered as statistically significant.
RESULTS
Exposure Characterization
The mean daily PM2.5 concentration at the study site in Columbus, OH, was 12.7 (SD = 8.4) μg/m3. The mean concentration of PM2.5 in the exposure chamber during the 30 h/week of exposure was 94.4 μg/m3 (∼7-fold concentration from ambient PM2.5 level).
Body and Organ Weight Measurements
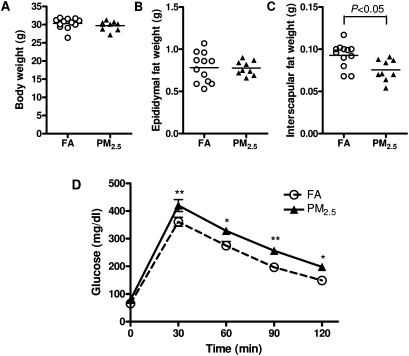
Figure 1 illustrates the body and organ weights after 10-month exposure to PM2.5 or FA. There were no significant differences in body weight (Fig. 1A). Interestingly, although the weight of visceral (epididymal) WAT in PM2.5-exposed group was comparable to that in FA group (Fig. 1B), PM2.5 exposure significantly decreased the interscapular BAT when compared with the FA-exposed group (Fig. 1C). Over time, we did not observe any statistically significant changes in body weight by long-term PM2.5 exposure (Supplementary figure 1).
FIG. 1.
Effect of PM2.5 exposure on body weight (BW), organ weight, and glucose homeostasis. (A–C) Effect of PM2.5 exposure on body weight (A), epididymal fat (B), and interscapular fat depots (C). (D) Intraperitoneal glucose tolerance test. N = 11 in FA group; N = 9 in PM2.5 group. *p < 0.05 versus FA group, **p < 0.01 versus FA group.
PM2.5 Exposure Induced Glucose Intolerance and IR
To test whether long-term PM2.5 exposure affects glucose metabolism, we performed an ip glucose tolerance test. As shown in Figure 1D, mice exposed to PM2.5 showed significant elevations in glucose levels at each time point, indicating that long-term PM2.5 exposure induced impaired glucose tolerance. The levels of fasting blood glucose and insulin were shown in Table 2. In addition, the HOMA-IR index, which is an indicator of insulin sensitivity (Katsuki et al., 2001), was significantly higher in the PM2.5-exposed mice than those in the FA-exposed mice (Table 2), suggesting that long-time PM2.5 exposure induced IR.
TABLE 2.
Fasting Blood Glucose, Insulin, and HOMA-IR Index
| FA | PM2.5 | p Value | |
| Glucose, mg/dl | 65.13 ± 1.74 | 79.25 ± 5.39 | 0.026 |
| Insulin (ng/ml) | 0.68 ± 0.09 | 0.86 ± 0.10 | 0.215 |
| HOMA-IR | 2.29 ± 0.31 | 3.96 ± 0.51 | 0.015 |
Note. Values are mean ± SE. N = 8. HOMA-IR, homeostasis model assessment of IR.
Effect of PM2.5 Exposure on Circulating Cytokines and Adipokines
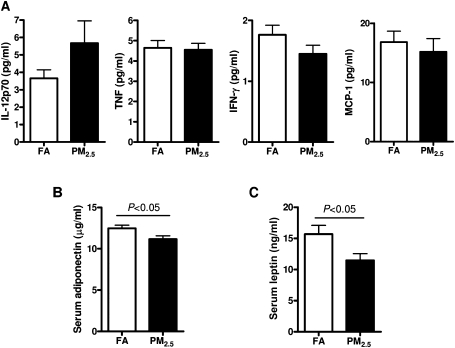
We measured inflammatory biomarkers in the blood to see if long-term PM2.5 exposure could induce systemic inflammation. As shown in Figure 2A, we did not find any significant differences in IL-12p70, TNF, IFN-γ, or MCP-1 between the 2 groups, whereas the levels of IL-6 and IL-10 were too low and nondetectable. As shown in Figures 2B and 2C, the levels of serum adiponectin and leptin were remarkably decreased by PM2.5 exposure when compared with the FA control group (p < 0.05), suggesting that PM2.5 exposure causes IR in adipose tissue (Sultan et al., 2009).
FIG. 2.
The concentrations of circulating cytokines (IL-12p70, TNF, IFN-γ, and MCP-1) (A), adiponectin (B), leptin (C) in response to PM2.5 exposure. N = 11 in FA group; N = 9 in PM2.5 group.
PM2.5 Exposure Increased Inflammation in Lung and Visceral Adipose Depot
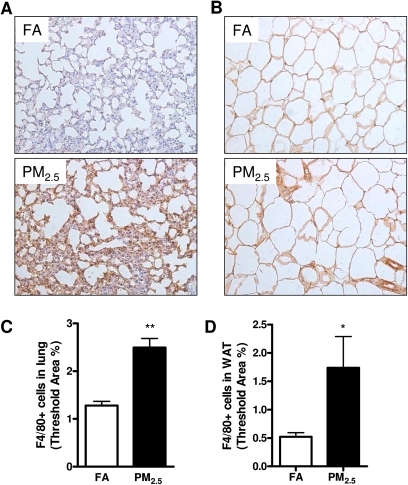
We wanted to know whether long-term PM2.5 exposure led to inflammation in the organs and tissues. As shown in Figures 3A and 3C, PM2.5 exposure resulted in an increase in F4/80+ macrophage recruitment in the lung. In addition, adipose tissue macrophages are thought to represent key cellular mediators of adipose tissue inflammatory response and IR development. We therefore investigated the inflammatory response to PM2.5 exposure by immunohistochemistry in epididymal adipose tissue, which is regarded to play an important role in the development of IR, obesity, and type 2 diabetes mellitus (Dandona et al., 2004; Shoelson et al., 2006; Xu et al., 2003). PM2.5 exposure induced an increase in F4/80+ macrophage infiltrating into the WAT when compared with the FA group (Figs. 3B and 3D).
FIG. 3.
Effect of PM2.5 exposure on inflammatory response in the lung and WAT (epididymal) by immunohistochemistry. (A–D) Representative images (A–B) and statistical analysis (C–D) of immunohistochemistry for F4/80+ macrophages in the lung (A, C) and WAT (B, D). Original magnification, ×200. N = 11 in FA group; N = 9 in PM2.5 group. *p < 0.05 versus FA group, **p < 0.001 versus FA group.
TEM Analysis of In Situ Mitochondria
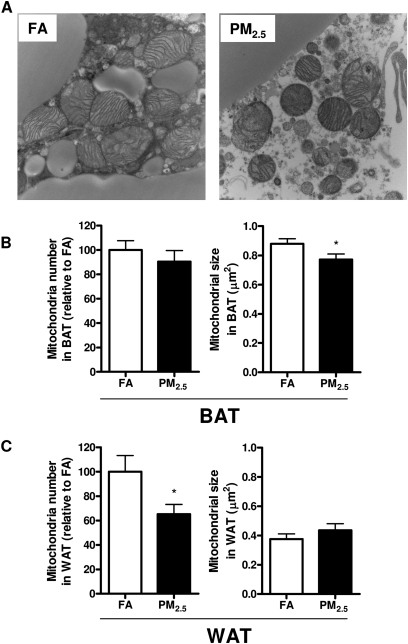
We next tested the hypothesis that long-term PM2.5 exposure accounted for mitochondrial alteration. Two quantitative parameters were used to assess mitochondria: mitochondrial number and size. Figure 4 shows representative TEM images of mitochondria in the interscapular (Fig. 4A) adipose depots in response to PM2.5 exposure. Interestingly, PM2.5 exposure did not lead to dramatic decline in mitochondrial number in interscapular brown adipose depots but did result in a significant decrease in average mitochondrial size compared with the FA group (Fig. 4B). On the other side, PM2.5 exposure significantly reduced mitochondrial number in visceral adipose tissue, although there was no significant difference in mitochondrial size (Fig. 4C).
FIG. 4.
Effect of PM2.5 exposure on mitochondria in adipose tissues. (A–C) Representative TEM images in BAT (A) and quantification of mitochondrial number and size in BAT (B) and WAT (C). N = 5. *p < 0.05 versus FA group. Original magnification, ×18,500. WAT (epididymal); BAT (interscapular).
Brown Adipocyte-Specific Gene Profiles and UCP1 Expression in WAT and BAT
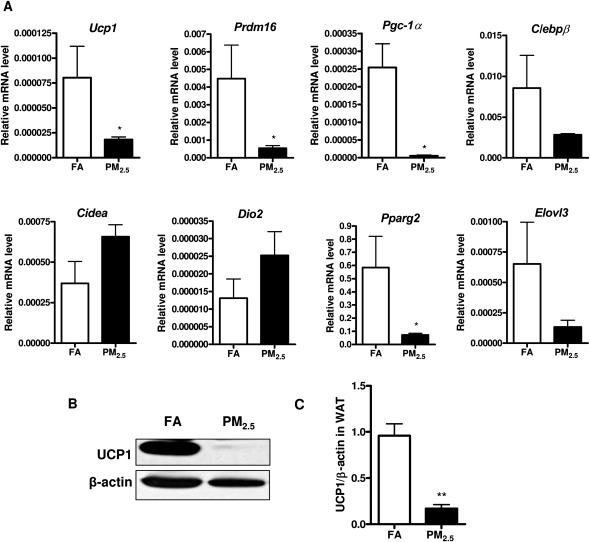
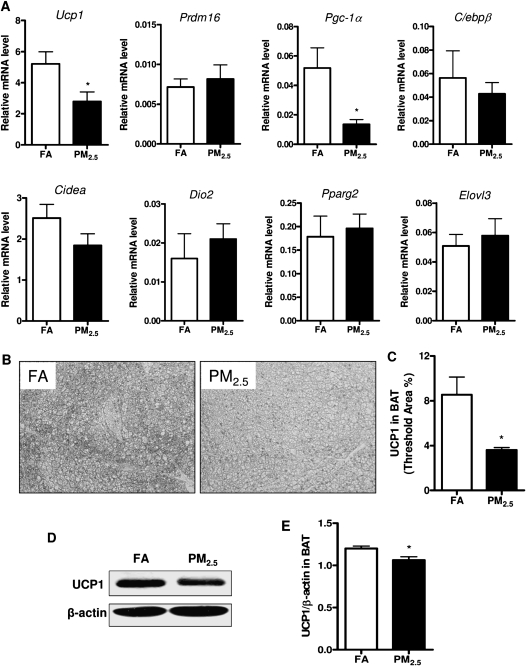
To determine brown adipocyte-specific gene profiles in response to long-term PM2.5 exposure, we examined these gene expressions in WAT and BAT by real-time PCR analysis. As shown in Figure 5A, the mRNA levels of the brown adipocyte-specific gene Ucp1, Prdm16, Pgc-1α, and Pparg2 were significantly decreased in the WAT in response to long-term PM2.5 exposure, although we did not observe any significant difference in C/ebpβ, Cidea, Dio2, or Elovl3 between these 2 groups. Consistent with Ucp1 gene expression, the observation was further confirmed by Western blotting for UCP1 at protein level in the WAT, as shown in Figures 5B and 5C. Additionally, we wanted to know whether long-term PM2.5 exposure caused any changes of the brown adipocyte-specific gene profiles in BAT. As shown in Figure 6A, the mRNA levels of Ucp1 and Pgc-1α were significantly reduced in response to PM2.5 exposure, although there were no significant changes in the other brown adipocyte-specific gene expressions. In line with the observations with regard to the alteration of Ucp1 mRNA level, UCP1 expression at the protein level was significantly decreased by long-term PM2.5 exposure in BAT, as demonstrated by immunohistochemistry (Figs. 6B and 6C) as well as Western blotting (Figs. 6D and 6E).
FIG. 5.
Effect of PM2.5 exposure on brown adipocyte-specific gene profiles and UCP1 expression in visceral WAT. (A) Brown adipocyte-specific gene expressions in WAT. (B and C) Representative bands (B) and statistical analysis (C) of Western blotting for UCP1 expression in WAT in response to PM2.5 exposure. N = 11 in FA group; N = 9 in PM2.5 group. *p < 0.05 versus FA group, **p < 0.001 versus FA group. Uncoupling protein 1 (Ucp1), PRD1-BF1-RIZ1 homologous domain containing 16 (Prdm16), peroxisome proliferator-activated receptor-γ coactivator 1-α (Pgc-1α), CCAAT enhancing binding protein β (C/ebpβ), cell death-inducing DNA fragmentation factor–like effector A (Cidea), type 2 iodothyronine deiondinase (Dio2), peroxisome proliferator-activated receptor gamma 2 (Pparg2), elongation of very long-chain fatty acid 3 (Elovl3).
FIG. 6.
Effect of PM2.5 exposure on brown adipocyte-specific gene profiles and UCP1 expression in interscapular BAT. (A) Brown adipocyte-specific gene expressions in BAT. (B and C) Representative images (B) and statistical analysis (C) of immunohistochemistry for UCP1 expression in BAT in response to PM2.5 exposure. (D and E) Representative bands (D) and statistical analysis (E) of Western blotting for UCP1 expression in BAT in response to PM2.5 exposure. N = 11 in FA group; N = 9 in PM2.5 group. *p < 0.05 versus FA group. Uncoupling protein 1 (Ucp1), PRD1-BF1-RIZ1 homologous domain containing 16 (Prdm16), peroxisome proliferator-activated receptor-γ coactivator 1-α (Pgc-1α), CCAAT enhancing binding protein β (C/ebpβ), cell death-inducing DNA fragmentation factor–like effector A (Cidea), type 2 iodothyronine deiondinase (Dio2), peroxisome proliferator-activated receptor gamma 2 (Pparg2), elongation of very long-chain fatty acid 3 (Elovl3).
PM2.5 Exposure Induced IR in Adipose Tissues, Liver, and Skeletal Muscle
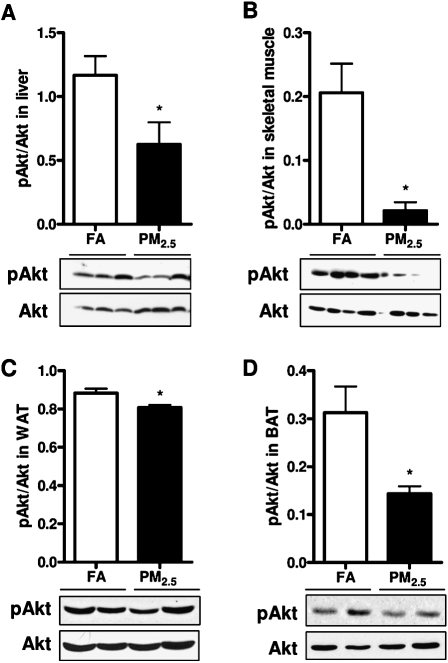
Due to aforementioned observation that long-term PM2.5 exposure led to systemic IR, we then further tested local IR in adipose tissue depots, liver, and skeletal muscle. As shown in Figure 7, we found that long-term PM2.5 exposure decreased phosphorylation of Akt in the liver (Fig. 7A), skeletal muscle (Fig. 7B), WAT (Fig. 7C), and BAT (Fig. 7D) as compared with the FA-exposed control. There were no significant differences in the expression of total Akt between the groups in these tissues (data not shown).
FIG. 7.
IR in the liver, skeletal muscle, and adipose tissues in response to PM2.5 exposure. (A–D) Western blotting for phosphorylated (pAkt) and total Akt in the liver (A), soleus skeletal muscle (B), visceral WAT (C), and interscapular BAT (D). N = 11 in FA group; N = 9 in PM2.5 group. *p < 0.05 versus FA group.
PM2.5 Exposure Induced Superoxide Production, Oxidative Stress, and Activated Nrf2 Signaling
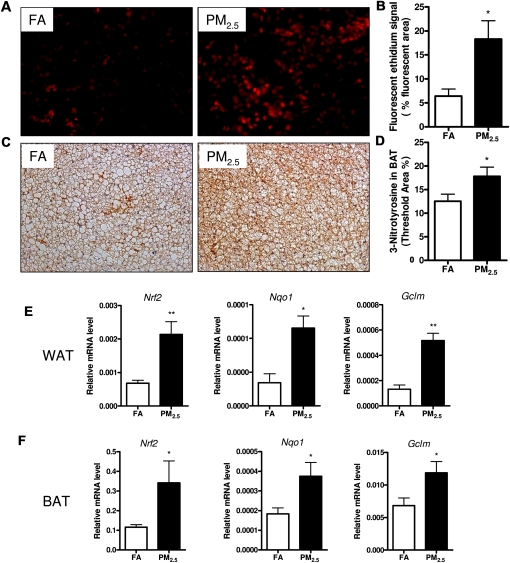
As shown in Figure 8, long-term PM2.5 exposure significantly induced superoxide production as determined by DHE staining (Figs. 8A and 8B) and resulted in higher expression of 3-nitrotyrosine in BAT depots, a marker of oxidative stress, by immunohistochemistry (Figs. 8C and 8D). Nevertheless, we did not observe any significant changes in iNOS expression in BAT depots by long-term PM2.5 exposure (Supplementary figure. 2). We explored whether long-term PM2.5 exposure led to phase II antioxidant responses that are mediated via Nrf2. After long-term PM2.5 exposure, PM2.5-exposed mice exhibited a significant increase in WAT (Fig. 8E) and BAT (Fig. 8F) depots in the expression of Nrf2 as well as induction of Nqo1 and Gclm, which are secondarily regulated by this transcription factor.
FIG. 8.
Effect of PM2.5 exposure on superoxide production and oxidative stress in interscapular BAT and Nrf2 signaling in WAT and BAT. (A and B) Representative images (A) and quantification (B) for superoxide production, as determined by dihydroethidium (DHE) staining. (C and D) Representative images (C) and quantification (D) of immunohistochemistry for 3-nitrotyrosine as a marker of oxidative stress. Original magnification, ×200. (E and F) Real-time PCR data for Nrf2 signaling in WAT (E) and BAT (F). N = 11 in FA group; N = 9 in PM2.5 group. *p < 0.05 versus FA group, **p < 0.001 versus FA group. NF-E2-related factor 2 (Nrf2), NAD(P)H quinone oxidoreductase 1 (Nqo1), glutamate-cysteine ligase modifier subunit (Gclm).
DISCUSSION
In this study, we evaluated the role of exposure to long-term PM2.5 air pollution on inflammatory response, IR, oxidative stress, and mitochondrial alteration, as well as changes in brown adipocyte-specific gene profiles in both WAT and BAT in mice. To our knowledge, this is the first to study the changes in mitochondria, UCP1 expression, and brown adipocyte-specific gene profiles in response to long-term PM2.5 exposure. There are some important findings in this study. First, long-term PM2.5 exposure induces systemic and local IR, impaired glucose tolerance, and inflammatory responses in the lung and visceral adipose depots. Secondly, long-term PM2.5 exposure results in oxidative stress as evidenced by elevated levels of 3-nitrotyrosine and a significant increase of Nrf2-regulated antioxidant genes in the PM2.5-exposed mice. In addition, long-term PM2.5 exposure decreases mitochondrial number in WAT, reduces mitochondrial size in BAT, and lowers UCP1 expression and several brown adipocyte-specific gene expressions in adipose depots, and thereby leading to mitochondrial dysfunction in adipose tissue.
Because human beings are constantly exposed to ambient PM2.5, long-term PM2.5 exposure in laboratory studies has been pursued in the past decade and is regarded as a sound approach to mimic real-world human exposures. Our previous studies have investigated different exposure time periods associated with different diseases, which were from a relatively short-term period of 10 weeks to relatively long-term exposures of up to 6 months (Sun et al., 2005, 2008, 2009; Xu et al., 2010). Different from the studies by intratracheal or nasal exposure in vivo and others by cell culture in vitro (Kongerud et al., 2006; Mutlu et al., 2007; Pozzi et al., 2003), the mice in the current study were exposed to the PM2.5 particles over a duration of 10 months, which is roughly equivalent to a human exposure period of ∼40 years (Flurkey et al., 2007), which might be sufficient to cause IR and increases in the prevalence of type 2 diabetes and susceptibility to cardiovascular diseases.
A number of studies have shown that exposure to PM2.5 is associated with a systemic proinflammatory response in humans and animals (Calderon-Garciduenas et al., 2008; Mutlu et al., 2007; Thompson et al., 2010; Xu et al., 2010). Inflammation and oxidative stress pathways play critical roles in this process of IR, adiposity, and the development of cardiovascular risk in response to PM2.5 air pollution, as demonstrated by numerous investigations (Dandona et al., 2004; Hotamisligil, 2006; Houstis et al., 2006; Shoelson et al., 2006; Xu et al., 2010). A number of studies have highlighted the innate immune mechanisms as the critical role that is responsible for the pathophysiological abnormalities (Dandona et al., 2004; Zhou et al., 2009). In addition, accumulating studies have revealed that exposure to concentrated ambient particulate matter air pollution is related to acute and chronic effects on cardiac function, increased amounts of more invasive aortic plaque, inflammation, and IR as well as adiposity (Chen and Hwang, 2005; Hwang et al., 2005; Sun et al., 2005, 2008, 2009; Ying et al., 2009). In line with these findings, our results demonstrate that although long-term exposure to PM2.5 did not induce systemic inflammation, it did result in inflammatory responses in the lung and visceral adipose tissue and systemic IR as well as local IR, as indicated by diminished insulin-mediated phosphorylation of Akt at Ser473 in the liver, skeletal muscle, and adipose tissues. Additionally, our findings suggest that long-term PM2.5 exposure induces oxidative stress, which is consistent with some other investigations (Araujo et al., 2008).
BAT serves a very important function in protection from diet-induced obesity, diabetes, and IR (Hamann et al., 1996). Therefore, promoting functional BAT and/or brown-like adipocytes within WAT depots is associated with improved metabolic phenotypes and could be a potential target for the treatment of obesity via the modulation of metabolic rate. UCP1, which is specifically expressed in BAT mitochondria, is largely responsible for the uncoupling of respiration from ATP synthesis resulting in dissipation of energy as heat and thereby playing a pivotal role in thermogenesis and protecting against reactive oxygen species (Ricquier, 2005). Accordingly, BAT is of importance in the maintenance of body temperature and energy balance. Recently, “brite” (brown-in-white) adipocytes have been discovered in WAT and display several classical brown adipocyte characteristics (Nedergaard and Cannon, 2010; Petrovic et al., 2010). Besides UCP1, proteins such as Dio2, Cidea, and Elovl3 have been shown to be highly enriched in BAT (Silva and Larsen, 1983). PGC-1α, a coactivator of multiple transcription factors such as NRF-1/2 and PPAR (Evans and Scarpulla, 1990; Ferre, 2004), is also highly expressed in BAT but relatively low in WAT (Lin et al., 2005). It is likely that brite adipose has unique physiological/thermogenic function associated with the regulation of body adiposity (Enerback, 2010). To evaluate further the hypothesis that mitochondria could be affected by long-term PM2.5 exposure, we measured the expression of UCP1 and several key genes related to mitochondrial function and regulatory networks that govern expression of genes during BAT differentiation and mitochondrial biogenesis by real-time PCR in the BAT and WAT based on the previous studies (Lagouge et al., 2006; Petrovic et al., 2010). In this study, we demonstrate that long-term exposure to PM2.5 decreased UCP1 expression and several brown adipocyte-specific gene expressions in both WAT and BAT. Furthermore, long-term PM2.5 exposure reduced mitochondrial number in WAT and mitochondrial size in BAT. These findings suggest that long-term PM2.5 exposure induces alterations of adipose tissue and leads to mitochondrial dysfunction. The underlying mechanisms responsible for this adverse effect in response to ambient PM2.5 air pollution need to be further investigated.
In summary, our data suggest that long-term PM2.5 exposure induces inflammatory responses in the lung and visceral adipose, IR, and mitochondrial alteration. These findings suggest an important public health impact on human populations.
FUNDING
National Institutes of Health (ES016588, ES017412, ES018900 to Q.S., ES015146 to S.R., ES00260 to M.L. and L.-C.C. at NYU School of Medicine); Diabetes Action Research and Education Foundation (to Q.S.).
Supplementary Material
Acknowledgments
The authors would like to thank the Campus Microscopy and Imaging Facility at The Ohio State University for the TEM experiment.
References
- Araujo JA, Barajas B, Kleinman M, Wang X, Bennett BJ, Gong KW, Navab M, Harkema J, Sioutas C, Lusis AJ, et al. Ambient particulate pollutants in the ultrafine range promote early atherosclerosis and systemic oxidative stress. Circ. Res. 2008;102:589–596. doi: 10.1161/CIRCRESAHA.107.164970. [DOI] [PMC free article] [PubMed] [Google Scholar]
- Brook RD, Rajagopalan S, Pope CA, III, Brook JR, Bhatnagar A, Diez-Roux AV, Holguin F, Hong Y, Luepker RV, Mittleman MA, et al. Particulate matter air pollution and cardiovascular disease: an update to the scientific statement from the American Heart Association. Circulation. 2010;121:2331–2378. doi: 10.1161/CIR.0b013e3181dbece1. [DOI] [PubMed] [Google Scholar]
- Calderon-Garciduenas L, Villarreal-Calderon R, Valencia-Salazar G, Henriquez-Roldan C, Gutierrez-Castrellon P, Torres-Jardon R, Osnaya-Brizuela N, Romero L, Torres-Jardon R, Solt A, et al. Systemic inflammation, endothelial dysfunction, and activation in clinically healthy children exposed to air pollutants. Inhal. Toxicol. 2008;20:499–506. doi: 10.1080/08958370701864797. [DOI] [PubMed] [Google Scholar]
- Chen LC, Hwang JS. Effects of subchronic exposures to concentrated ambient particles (CAPs) in mice. IV. Characterization of acute and chronic effects of ambient air fine particulate matter exposures on heart-rate variability. Inhal. Toxicol. 2005;17:209–216. doi: 10.1080/08958370590912789. [DOI] [PubMed] [Google Scholar]
- Cypess AM, Lehman S, Williams G, Tal I, Rodman D, Goldfine AB, Kuo FC, Palmer EL, Tseng YH, Doria A, et al. Identification and importance of brown adipose tissue in adult humans. N. Engl. J. Med. 2009;360:1509–1517. doi: 10.1056/NEJMoa0810780. [DOI] [PMC free article] [PubMed] [Google Scholar]
- Dandona P, Aljada A, Bandyopadhyay A. Inflammation: the link between insulin resistance, obesity and diabetes. Trends Immunol. 2004;25:4–7. doi: 10.1016/j.it.2003.10.013. [DOI] [PubMed] [Google Scholar]
- Enerbäck S. Brown adipose tissue in humans. Int. J. Obes. (Lond) 2010;34(Suppl. 1):S43–S46. doi: 10.1038/ijo.2010.183. [DOI] [PubMed] [Google Scholar]
- Evans MJ, Scarpulla RC. NRF-1: a trans-activator of nuclear-encoded respiratory genes in animal cells. Genes Dev. 1990;4:1023–1034. doi: 10.1101/gad.4.6.1023. [DOI] [PubMed] [Google Scholar]
- Ferre P. The biology of peroxisome proliferator-activated receptors: relationship with lipid metabolism and insulin sensitivity. Diabetes. 2004;53(Suppl. 1):S43–S50. doi: 10.2337/diabetes.53.2007.s43. [DOI] [PubMed] [Google Scholar]
- Flurkey K, Currer JM, Harrison DE. The mouse in aging research. In: Fox JG, Davisson MT, Quimby FW, Barthold SW, Newcomer CE, Smith AL, editors. The Mouse in Biomedical Research. Burlington, MA: 2nd ed. American College Laboratory Animal Medicine (Elsevier); 2007. [Google Scholar]
- Frampton MW. Inflammation and airborne particles. Clin. Occup. Environ. Med. 2006;5:797–815. doi: 10.1016/j.coem.2006.07.006. [DOI] [PubMed] [Google Scholar]
- Franks PW, Hanson RL, Knowler WC, Sievers ML, Bennett PH, Looker HC. Childhood obesity, other cardiovascular risk factors, and premature death. N. Engl. J. Med. 2010;362:485–493. doi: 10.1056/NEJMoa0904130. [DOI] [PMC free article] [PubMed] [Google Scholar]
- Hamann A, Flier JS, Lowell BB. Decreased brown fat markedly enhances susceptibility to diet-induced obesity, diabetes, and hyperlipidemia. Endocrinology. 1996;137:21–29. doi: 10.1210/endo.137.1.8536614. [DOI] [PubMed] [Google Scholar]
- Hotamisligil GS. Inflammation and metabolic disorders. Nature. 2006;444:860–867. doi: 10.1038/nature05485. [DOI] [PubMed] [Google Scholar]
- Houstis N, Rosen ED, Lander ES. Reactive oxygen species have a causal role in multiple forms of insulin resistance. Nature. 2006;440:944–948. doi: 10.1038/nature04634. [DOI] [PubMed] [Google Scholar]
- Hwang JS, Nadziejko C, Chen LC. Effects of subchronic exposures to concentrated ambient particles (CAPs) in mice. III. Acute and chronic effects of CAPs on heart rate, heart-rate fluctuation, and body temperature. Inhal. Toxicol. 2005;17:199–207. doi: 10.1080/08958370590912761. [DOI] [PubMed] [Google Scholar]
- Kan H, Chen B, Hong C. Health impact of outdoor air pollution in China: current knowledge and future research needs. Environ. Health Perspect. 2009;117:A187. doi: 10.1289/ehp.12737. [DOI] [PMC free article] [PubMed] [Google Scholar]
- Katsuki A, Sumida Y, Gabazza EC, Murashima S, Furuta M, Araki-Sasaki R, Hori Y, Yano Y, Adachi Y. Homeostasis model assessment is a reliable indicator of insulin resistance during follow-up of patients with type 2 diabetes. Diabetes Care. 2001;24:362–365. doi: 10.2337/diacare.24.2.362. [DOI] [PubMed] [Google Scholar]
- Kongerud J, Madden MC, Hazucha M, Peden D. Nasal responses in asthmatic and nonasthmatic subjects following exposure to diesel exhaust particles. Inhal. Toxicol. 2006;18:589–594. doi: 10.1080/08958370600743027. [DOI] [PubMed] [Google Scholar]
- Lagouge M, Argmann C, Gerhart-Hines Z, Meziane H, Lerin C, Daussin F, Messadeq N, Milne J, Lambert P, Elliott P, et al. Resveratrol improves mitochondrial function and protects against metabolic disease by activating SIRT1 and PGC-1alpha. Cell. 2006;127:1109–1122. doi: 10.1016/j.cell.2006.11.013. [DOI] [PubMed] [Google Scholar]
- Laing S, Wang G, Briazova T, Zhang C, Wang A, Zheng Z, Gow A, Chen AF, Rajagopalan S, Chen LC, et al. Airborne particulate matter selectively activates endoplasmic reticulum stress response in the lung and liver tissues. Am. J. Physiol. Cell. Physiol. 2010;299:C736–C749. doi: 10.1152/ajpcell.00529.2009. [DOI] [PMC free article] [PubMed] [Google Scholar]
- Lin J, Handschin C, Spiegelman BM. Metabolic control through the PGC-1 family of transcription coactivators. Cell Metab. 2005;1:361–370. doi: 10.1016/j.cmet.2005.05.004. [DOI] [PubMed] [Google Scholar]
- Mattsson N, Ronnemaa T, Juonala M, Viikari JS, Raitakari OT. Childhood predictors of the metabolic syndrome in adulthood. The cardiovascular risk in Young Finns study. Ann. Med. 2008;40:542–552. doi: 10.1080/07853890802307709. [DOI] [PubMed] [Google Scholar]
- Miller KA, Siscovick DS, Sheppard L, Shepherd K, Sullivan JH, Anderson GL, Kaufman JD. Long-term exposure to air pollution and incidence of cardiovascular events in women. N. Engl. J. Med. 2007;356:447–458. doi: 10.1056/NEJMoa054409. [DOI] [PubMed] [Google Scholar]
- Mills NL, Donaldson K, Hadoke PW, Boon NA, MacNee W, Cassee FR, Sandstrom T, Blomberg A, Newby DE. Adverse cardiovascular effects of air pollution. Nat. Clin. Pract. Cardiovasc. Med. 2009;6:36–44. doi: 10.1038/ncpcardio1399. [DOI] [PubMed] [Google Scholar]
- Mutlu GM, Green D, Bellmeyer A, Baker CM, Burgess Z, Rajamannan N, Christman JW, Foiles N, Kamp DW, Ghio AJ, et al. Ambient particulate matter accelerates coagulation via an IL-6-dependent pathway. J. Clin. Invest. 2007;117:2952–2961. doi: 10.1172/JCI30639. [DOI] [PMC free article] [PubMed] [Google Scholar]
- Nedergaard J, Cannon B. The changed metabolic world with human brown adipose tissue: therapeutic visions. Cell Metab. 2010;11:268–272. doi: 10.1016/j.cmet.2010.03.007. [DOI] [PubMed] [Google Scholar]
- O'Neill MS, Veves A, Sarnat JA, Zanobetti A, Gold DR, Economides PA, Horton ES, Schwartz J. Air pollution and inflammation in type 2 diabetes: a mechanism for susceptibility. Occup. Environ. Med. 2007;64:373–379. doi: 10.1136/oem.2006.030023. [DOI] [PMC free article] [PubMed] [Google Scholar]
- Park KW, Halperin DS, Tontonoz P. Before they were fat: adipocyte progenitors. Cell Metab. 2008;8:454–457. doi: 10.1016/j.cmet.2008.11.001. [DOI] [PubMed] [Google Scholar]
- Petrovic N, Walden TB, Shabalina IG, Timmons JA, Cannon B, Nedergaard J. Chronic peroxisome proliferator-activated receptor gamma (PPARgamma) activation of epididymally derived white adipocyte cultures reveals a population of thermogenically competent, UCP1-containing adipocytes molecularly distinct from classic brown adipocytes. J. Biol. Chem. 2010;285:7153–7164. doi: 10.1074/jbc.M109.053942. [DOI] [PMC free article] [PubMed] [Google Scholar]
- Pope C, III, Thun M, Namboodiri M, Dockery D, Evans J, Speizer F, Heath C., Jr Particulate air pollution as a predictor of mortality in a prospective study of U.S. adults. Am. J. Respir. Crit. Care Med. 1995;151:669–674. doi: 10.1164/ajrccm/151.3_Pt_1.669. [DOI] [PubMed] [Google Scholar]
- Pope CA, III, Burnett RT, Thurston GD, Thun MJ, Calle EE, Krewski D, Godleski JJ. Cardiovascular mortality and long-term exposure to particulate air pollution: epidemiological evidence of general pathophysiological pathways of disease. Circulation. 2004;109:71–77. doi: 10.1161/01.CIR.0000108927.80044.7F. [DOI] [PubMed] [Google Scholar]
- Pozzi R, De Berardis B, Paoletti L, Guastadisegni C. Inflammatory mediators induced by coarse (PM2.5-10) and fine (PM2.5) urban air particles in RAW 264.7 cells. Toxicology. 2003;183:243–254. doi: 10.1016/s0300-483x(02)00545-0. [DOI] [PubMed] [Google Scholar]
- Ricquier D. Respiration uncoupling and metabolism in the control of energy expenditure. Proc. Nutr. Soc. 2005;64:47–52. doi: 10.1079/pns2004408. [DOI] [PubMed] [Google Scholar]
- Samet JM, Dominici F, Curriero FC, Coursac I, Zeger SL. Fine particulate air pollution and mortality in 20 U.S. cities, 1987–1994. N. Engl. J. Med. 2000;343:1742–1749. doi: 10.1056/NEJM200012143432401. [DOI] [PubMed] [Google Scholar]
- Schwartz J. Air pollution and hospital admissions for heart disease in eight U.S. counties. Epidemiology. 1999;10:17–22. [PubMed] [Google Scholar]
- Shoelson SE, Lee J, Goldfine AB. Inflammation and insulin resistance. J. Clin. Invest. 2006;116:1793–1801. doi: 10.1172/JCI29069. [DOI] [PMC free article] [PubMed] [Google Scholar]
- Silva JE, Larsen PR. Adrenergic activation of triiodothyronine production in brown adipose tissue. Nature. 1983;305:712–713. doi: 10.1038/305712a0. [DOI] [PubMed] [Google Scholar]
- Spiegelman BM, Flier JS. Obesity and the regulation of energy balance. Cell. 2001;104:531–543. doi: 10.1016/s0092-8674(01)00240-9. [DOI] [PubMed] [Google Scholar]
- Sultan A, Strodthoff D, Robertson AK, Paulsson-Berne G, Fauconnier J, Parini P, Ryden M, Thierry-Mieg N, Johansson ME, Chibalin AV, et al. T cell-mediated inflammation in adipose tissue does not cause insulin resistance in hyperlipidemic mice. Circ. Res. 2009;104:961–968. doi: 10.1161/CIRCRESAHA.108.190280. [DOI] [PubMed] [Google Scholar]
- Sun Q, Wang A, Jin X, Natanzon A, Duquaine D, Brook RD, Aguinaldo JG, Fayad ZA, Fuster V, Lippmann M, et al. Long-term air pollution exposure and acceleration of atherosclerosis and vascular inflammation in an animal model. JAMA. 2005;294:3003–3010. doi: 10.1001/jama.294.23.3003. [DOI] [PubMed] [Google Scholar]
- Sun Q, Yue P, Deiuliis JA, Lumeng CN, Kampfrath T, Mikolaj MB, Cai Y, Ostrowski MC, Lu B, Parthasarathy S, et al. Ambient air pollution exaggerates adipose inflammation and insulin resistance in a mouse model of diet-induced obesity. Circulation. 2009;119:538–546. doi: 10.1161/CIRCULATIONAHA.108.799015. [DOI] [PMC free article] [PubMed] [Google Scholar]
- Sun Q, Yue P, Ying Z, Cardounel AJ, Brook RD, Devlin R, Hwang JS, Zweier JL, Chen LC, Rajagopalan S. Air pollution exposure potentiates hypertension through reactive oxygen species-mediated activation of Rho/ROCK. Arterioscler. Thromb. Vasc. Biol. 2008;28:1760–1766. doi: 10.1161/ATVBAHA.108.166967. [DOI] [PMC free article] [PubMed] [Google Scholar]
- Thompson AM, Zanobetti A, Silverman F, Schwartz J, Coull B, Urch B, Speck M, Brook JR, Manno M, Gold DR. Baseline repeated measures from controlled human exposure studies: associations between ambient air pollution exposure and the systemic inflammatory biomarkers IL-6 and fibrinogen. Environ. Health Perspect. 2010;118:120–124. doi: 10.1289/ehp.0900550. [DOI] [PMC free article] [PubMed] [Google Scholar]
- van Eeden SF, Tan WC, Suwa T, Mukae H, Terashima T, Fujii T, Qui D, Vincent R, Hogg JC. Cytokines involved in the systemic inflammatory response induced by exposure to particulate matter air pollutants (PM(10)) Am. J. Respir. Crit. Care Med. 2001;164:826–830. doi: 10.1164/ajrccm.164.5.2010160. [DOI] [PubMed] [Google Scholar]
- Xu H, Barnes GT, Yang Q, Tan G, Yang D, Chou CJ, Sole J, Nichols A, Ross JS, Tartaglia LA, et al. Chronic inflammation in fat plays a crucial role in the development of obesity-related insulin resistance. J. Clin. Invest. 2003;112:1821–1830. doi: 10.1172/JCI19451. [DOI] [PMC free article] [PubMed] [Google Scholar]
- Xu X, Yavar Z, Verdin M, Ying Z, Mihai G, Kampfrath T, Wang A, Zhong M, Lippmann M, Chen LC, et al. Effect of early particulate air pollution exposure on obesity in mice: role of p47phox. Arterioscler. Thromb. Vasc. Biol. 2010;30:2518–2527. doi: 10.1161/ATVBAHA.110.215350. [DOI] [PMC free article] [PubMed] [Google Scholar]
- Xu X, Ying Z, Cai M, Xu Z, Li Y, Jiang SY, Tzan K, Wang A, Parthasarathy S, He G, et al. Exercise ameliorates high-fat diet-induced metabolic and vascular dysfunction, and increases adipocyte progenitor cell population in brown adipose tissue. Am. J. Physiol. Regul. Integr. Comp. Physiol. 2011;300:R1115–R1125. doi: 10.1152/ajpregu.00806.2010. [DOI] [PMC free article] [PubMed] [Google Scholar]
- Ying Z, Yue P, Xu X, Zhong M, Sun Q, Mikolaj M, Wang A, Brook RD, Chen LC, Rajagopalan S. Air pollution and cardiac remodeling: a role for RhoA/Rho-kinase. Am. J. Physiol. Heart Circ. Physiol. 2009;296:H1540–H1550. doi: 10.1152/ajpheart.01270.2008. [DOI] [PMC free article] [PubMed] [Google Scholar]
- Zhou Q, Leeman SE, Amar S. Signaling mechanisms involved in altered function of macrophages from diet-induced obese mice affect immune responses. Proc. Natl. Acad. Sci. U. S. A. 2009;106:10740–10745. doi: 10.1073/pnas.0904412106. [DOI] [PMC free article] [PubMed] [Google Scholar]
Associated Data
This section collects any data citations, data availability statements, or supplementary materials included in this article.


