Abstract
In developing analytical methods for batch certification of the color additive D&C Green No. 8 (G8), the U.S. Food and Drug Administration needed the trisodium salt of 1,3,6-pyrenetrisulfonic acid (P3S) for use as a reference material. Since P3S was not commercially available, preparative quantities of it were separated from portions of a sample of G8 that contained ~ 3.5% P3S. The separations were performed by affinity-ligand pH-zone-refining counter-current chromatography using dodecylamine (DA) as the ligand. The added ligand enabled partitioning of the polysulfonated components into the organic stationary phase of the two-phase solvent system used, 1-butanol – water (1:1). A typical separation that involved 20.3 g of G8, using sulfuric acid as the retainer acid and 20% DA in the stationary phase and 0.1M sodium hydroxide as the mobile phase, resulted in ~0.58 g of P3S of greater than 99% purity. The identification and characterization of the separated P3S were performed by proton nuclear magnetic resonance, high-resolution mass spectrometry, ultra-violet spectra and high-performance liquid chromatography.
Keywords: Counter-current chromatography; pH-Zone-refining CCC; Affinity-ligand; Pyranine; D&C Green No. 8; Dyes; 1,3,6-Pyrenetrisulfonic acid
1. Introduction
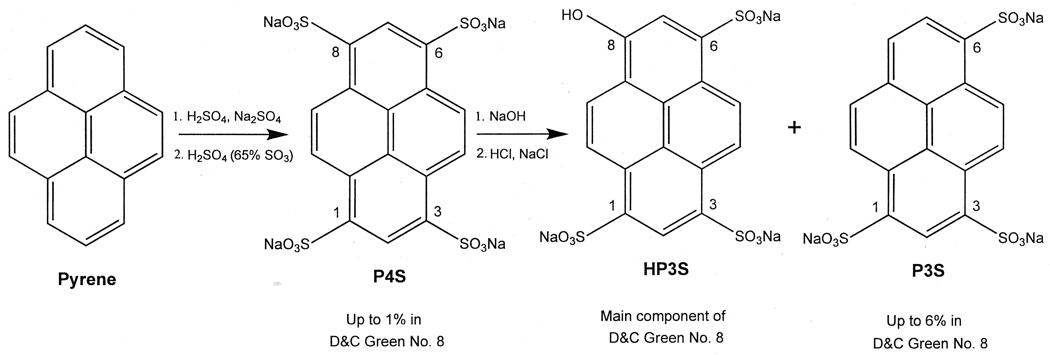
D&C Green No. 8 (G8, Pyranine, Colour Index No. 59040, mainly the trisodium salt of 8-hydroxy-1,3,6-pyrenetrisulfonic acid, HP3S) is a color additive used in externally applied drugs and cosmetics in the U.S. [1]. It is manufactured by sulfonating pyrene to form the tetrasulfonic acid compound, P4S, followed by hydrolyzing one of the sulfonic acids to yield the monohydroxytrisulfonate, which is isolated as the trisodium salt, HP3S [2](Fig. 1). During manufacture, various contaminants may be produced, including 1,3,6-pyrenetrisulfonate, P3S. G8 is subject to batch certification by the U.S. Food and Drug Administration (FDA) to ensure compliance with certain chemical specifications including “not more than 6 percent” of P3S [1]. To develop analytical methods for batch certification of G8, purified P3S is required as a reference material, but it is not commercially available. In the past, small amounts of P3S have been donated by a color additive manufacturer for use as a standard for the development of thin-layer chromatography methods for its determination in G8 [3,4].
Figure 1.
Preparation of D&C Green No. 8 by sulfonation of pyrene.
The present study describes the separation of preparative quantities of P3S from a sample of G8 that contained ~ 3.5% P3S, using pH-zone-refining counter-current chromatography [5–7]. This liquid-liquid chromatographic technique enables the separation of organic acids and bases according to their pKa values and hydrophobicities without using a solid support. The separation procedure and mechanism of separation by this method as well as many applications of this technique have been reviewed [8–10]. Compounds containing one or more carboxylic acid groups are common targets for pH-zone-refining CCC. Preparative separations have been reported for compounds containing isomeric and stereoisomeric mono- and dicarboxylic acids [11–13], amino acids and peptides [8], and monocarboxylated natural products [14–16] and fluorescein dyes [17]. Separations of compounds containing sulfonic acids using conventional pH-zone-refining CCC are less common [18,12]. Dyes containing sulfonic acid groups are more hydrophilic than the carboxylic acid dyes, and their very low pKa values prevent their partitioning into the organic phase of a conventional two-phase solvent system. It was shown, however, that the addition of a ligand (an ion-exchanger, e.g., dodecylamine, or an ion-pair reagent, e.g., tetrabutylammonium hydroxide) to both the sample solution and the organic stationary phase enables separation of sulfonated dyes by affinity-ligand pH-zone-refining CCC because the ligand facilitates their partitioning into the organic stationary phase [8,19–21]. Other very hydrophilic compounds, depolymerized fucans [22] and naphthalenesulfonic acids [23], were fractionated or separated, respectively, using a ligand (the anion exchanger Amberlite LA2) in the organic stationary phase.
The present work describes the conditions that permitted separation by affinity-ligand pH-zone-refining CCC of P3S from a mixture of closely-related very polar components in which the quantity of P3S is far outweighed by the quantity of HP3S. The separated P3S and HP3S are characterized by high-resolution mass spectrometry, 1H nuclear magnetic resonance (NMR) spectroscopy, and 1H-1H NMR correlated spectroscopy (COSY).
2. Experimental
2.1. Materials
The samples of G8 used in this study were from batches submitted to the FDA for certification. Methanol, water, and ammonium acetate (NH4OAc) were of chromatography grade. Dodecylamine (DA, 98%) and 1-butanol were from Sigma-Aldrich, St. Louis, MO, USA. Sulfuric acid (H2SO4, 95.9%) was from Fisher Scientific, Fair Lawn, NJ, USA, and sodium hydroxide (NaOH, A.C.S. reagent grade) was from J.T. Baker, Phillipsburg, NJ, USA.
2.2. pH-Zone-refining CCC
2.2.1. Instrumentation
The separations were performed with a commercial J-type high-speed CCC system (Model CCC-1000, Pharma-Tech Research, Baltimore, MD, USA) that consisted of (i) a column (three Ito-multilayer coils, connected in series, made of 2.6-mm i.d. PTFE tubing, with a total capacity of 800 ml) mounted on a rotating frame (centrifuge), (ii) a rotation-speed controller, and (iii) an LC-10ADVP pump (Shimadzu, Kyoto, Japan). The column effluent was monitored with a UV detector, model UVicord SII, with a 254-nm UV lamp (Pharmacia LKB, Uppsala, Sweden) and a chart recorder (Kipp & Zonen, Delft, The Netherlands). The effluent was collected using a Foxy fraction collector (Isco, Lincoln, NE, USA). The pH of the eluted fractions was measured manually using an Accumet AP61 pH meter (Fisher Scientific, Fair Lawn, NJ, USA).
2.2.2. Affinity-ligand separation procedure
The pH-zone-refining CCC separations were performed in the affinity-ligand mode following the general procedures described previously [10,19]. The two-phase solvent system consisted of 1-butanol-water (1:1, v/v). The solvent system was equilibrated in a separatory funnel, and the two phases were separated before use. To a portion of the upper organic phase (stationary phase), 20% (v/v) DA was added as the ligand and then 0.5% (v/v) conc. H2SO4 was added to the mixture. The sample solution was prepared as follows: the sample (20.3 g of G8 that contained ~ 3.5% P3S) was dissolved in 50 ml of lower aqueous phase followed by addition of 50 ml of stationary phase (that contained the DA and H2SO4). The sulfonated dyes were brought into the upper phase of the sample solution by adding 10 ml of DA and 2 ml of H2SO4. The pH of the sample solution became ~ 2.2. The separation was initiated by completely filling the column with ligand-free stationary phase using the LC pump. Approximately 150 ml of ligand-containing stationary phase was then pumped into the column, thereby displacing part of the column contents. Then the sample solution was loaded into the column using the LC pump. Next, the mobile phase -- the lower aqueous phase with NaOH added as eluter (resulting in a 0.1M NaOH solution) -- was pumped in the head-to-tail direction through the rotating column (700 rpm) at 3 ml/min. The column effluent was monitored with the UV detector at 254 nm and with the chart recorder set at 20 min/cm and attenuation at 2V. Fractions of 6 ml each were collected using the fraction collector and were analyzed using HPLC. The level of retention of the stationary phase was determined after the separation by pushing the column contents out (with pressurized air) and measuring the volume of stationary phase relative to the total column volume [10].
2.3. Analytical HPLC
The HPLC analyses were performed with a Waters Alliance 2690 Separation Module (Waters, Milford, MA, USA). The eluents were 0.2 M aqueous NH4OAc and methanol. The column (Kinetex 2.6u XB-C18, 100A, 100 × 4.60 mm i.d., Phenomenex, Torrance, CA, USA) was eluted by using consecutive linear gradients of 0–20% methanol in 8.80 min and 20–100% methanol in 0.2 min, followed by 100% methanol for 3 min. The effluent was monitored with a Waters 996 photodiode array detector set at 280 nm. Other conditions included: flow-rate, 1 ml/min; column temperature, 30°C; injection volume, 5 µl.
An aliquot (20 µl) from the pH-zone-refining CCC-collected fractions was diluted with 2 ml of water for analysis. The concentration of the samples whose analysis is shown in Fig. 2 and Fig. 3 was 10 mg/ml.
Figure 2.
Analytical HPLC chromatograms of commercial sample portions of D&C Green No. 8 obtained from three different sources.
Figure 3.
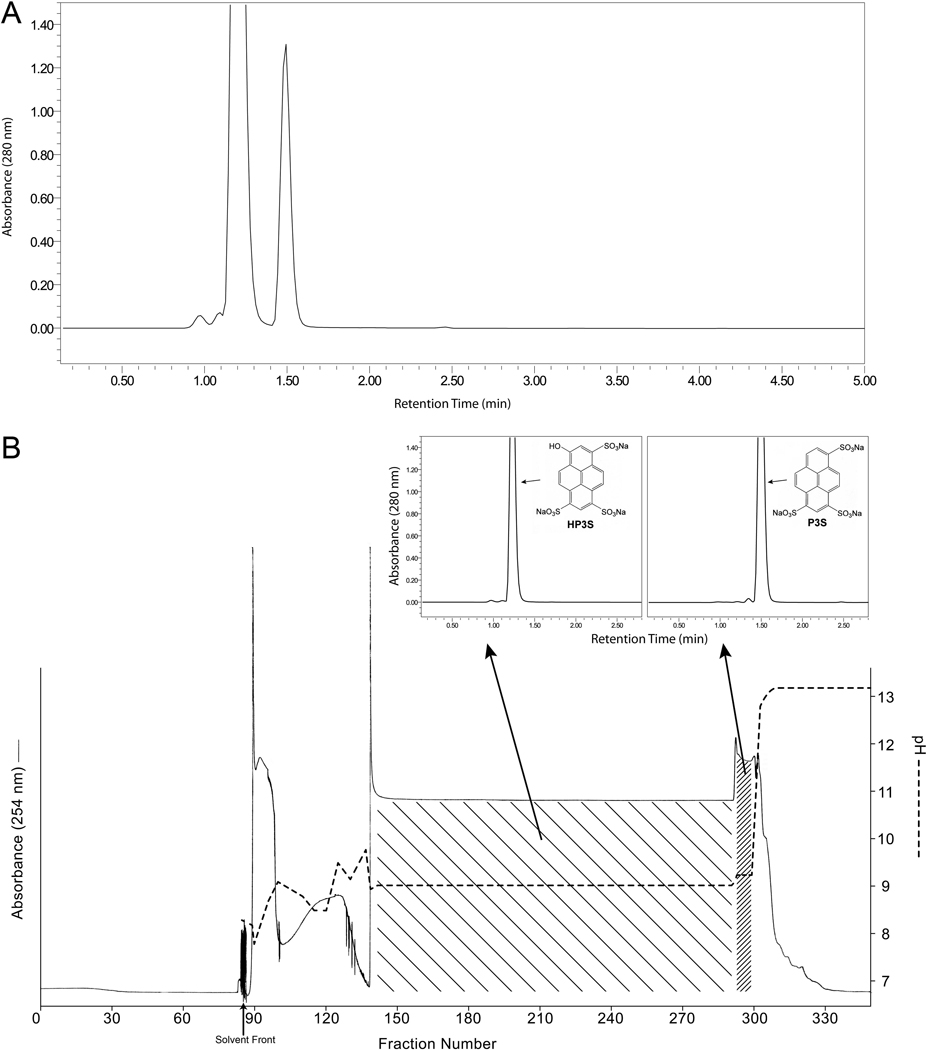
Separation of a 20.3-g portion of D&C Green No. 8 by affinity-ligand pH-zone-refining CCC. (A) HPLC analysis of the original mixture. (B) Chromatogram of the pH-zone-refining CCC separation and analytical HPLC chromatograms of the separated components.
2.4. Liquid chromatography-mass spectrometry
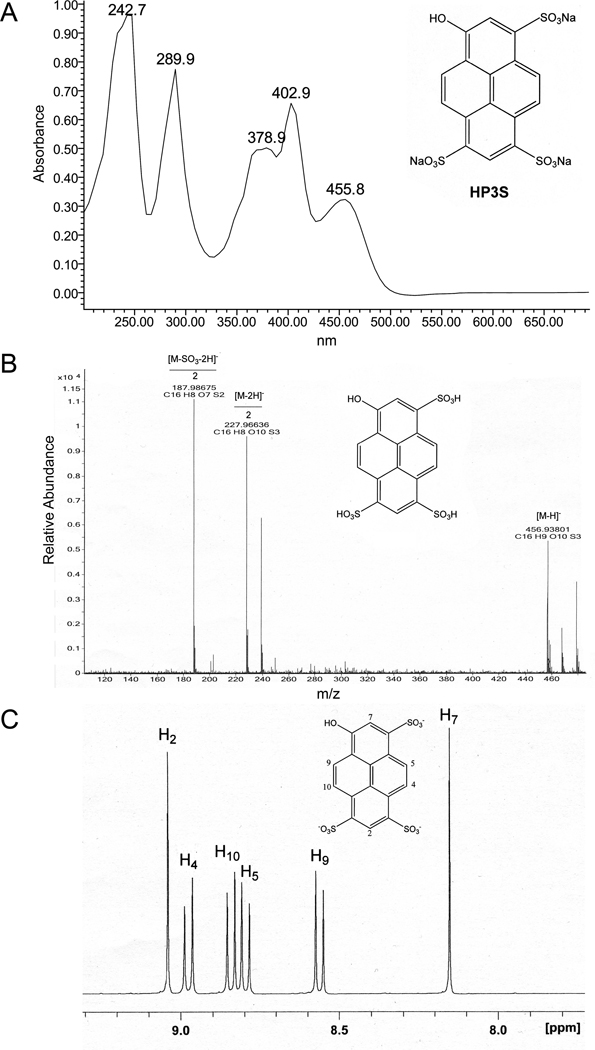
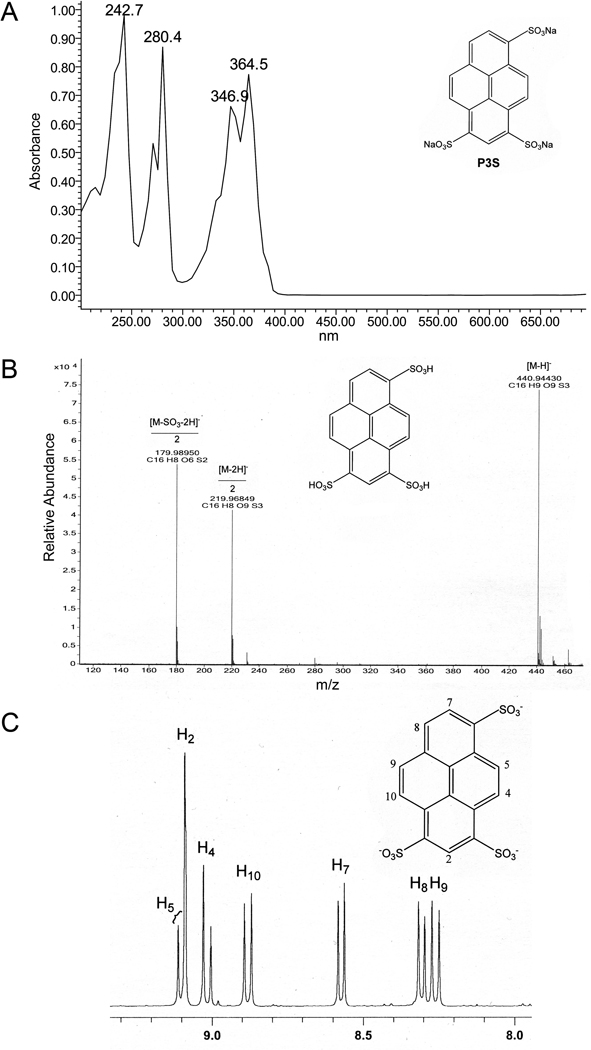
The high-resolution mass spectra of the pH-zone-refining CCC-separated G8 components were obtained on an Agilent 6520 Q-TOF LC/MS system (Agilent Technologies, Santa Clara, CA, USA) equipped with Agilent MassHunter Workstation software for data acquisition and data analysis. The separated dyes were dissolved in water (20 ng/µl) and analyzed in negative electrospray ionization (ESI) mode. The high-resolution measurements of the quasi-molecular ions (M-H)− of the separated components were as follows: P3S m/z 440.94430, which matched the calculated mass for C16H9O9S3 of 440.94142, the deprotonated pyrene substituted with three sulfonic acid groups; and HP3S m/z 456.93801, which matched the calculated mass for C16H9O10S3 of 456.93633, the deprotonated hydroxypyrene substituted with three sulfonic acid groups.
2.5. 1H nuclear magnetic resonance (NMR) spectroscopy
The 1H NMR and COSY spectra of P3S and HP3S were obtained on a Bruker AM-400 NMR spectrometer operating at 400 MHz. Approximately 25 mg of the separated compounds were dissolved in 400 µl of D2O. The following signals were obtained and assigned for each of the compounds: HP3S (Fig. 4), 9.04 (s, H-2), 8.97 (d, H-4), 8.84 (d, H-10), 8.79 (d, H-5), 8.56 (d, H-9), and 8.15 (s, H-7); P3S (Fig. 5), 9.10 (d, H-5), 9.09 (s, H-2), 9.01 (d, H-4), 8.88 (d, H-10), 8.57 (d, H-7), 8.30 (d, H-8), and 8.26 (d, H-9).
Figure 4.
Characterization of the separated HP3S: (A) UV spectrum (water was used as the solvent); (B) Negative ion ESI high-resolution mass spectrum; and (C) 1H NMR spectrum (D2O, 400 MHz).
Figure 5.
Characterization of the separated P3S: (A) UV spectrum (water was used as the solvent); (B) Negative ion ESI high-resolution mass spectrum; and (C) 1H NMR spectrum (D2O, 400 MHz).
3. Results and discussion
Analytical HPLC chromatograms of sample portions of D&C Green No. 8 obtained from three different sources are presented in Fig. 2. These analyses show that the main component, HP3S, is always accompanied by P3S, at varying levels across batches. The present work involved the batch that is represented in Fig. 3A, which contained ~ 3.5% P3S as determined during its certification process. The pH-zone-refining CCC elution profile of the separation of a 20.3 g test portion of this material is shown in Fig. 3B. Addition of an ion-exchange reagent (DA, 20%) and retainer acid (conc. H2SO4, ~ 2.5%) to both sample solution and organic stationary phase previously enabled the separation of the di- and trisulfonated components of Quinoline Yellow [21]. The same conditions were implemented successfully in the present work. The separation was completed in ~ 11 h. The solvent front (first fraction containing mobile phase) emerged at fraction 85, and the retention of the stationary phase, measured after the separation, was 27.8% of the total column volume. The obtained UV pH-zone-refining CCC chromatogram (Fig. 3B) consists of one major broad rectangular peak and one minor narrow peak. The two absorbance plateaus correspond to the two pH plateaus. The eluates corresponding to the two plateaus were collected in fractions 141–290 and 294–299, respectively. Each plateau represents elution of a pure compound, as illustrated by the associated HPLC chromatograms in Fig. 3B of the combined fractions from the two hatched regions. The P3S and HP3S obtained from these combined fractions (0.58 g, fractions 294–299; 12.1 g, fractions 141–290, respectively) were over 99% pure by HPLC at 280 nm and 254 nm. They were characterized by UV, 1H NMR and COSY (not shown) spectra, and negative ESI high-resolution mass spectrometry as shown in Fig. 4 and Fig. 5.
4. Conclusion
In this work, affinity-ligand pH-zone-refining CCC was successfully applied to the difficult task of separating a mixture of closely-related very polar components in which the quantity of one component (P3S) is disproportionately overwhelmed by the quantity of the other component (HP3S). No other preparative-scale chromatographic separation of multi-gram quantities of D&C Green No. 8 has been previously reported.
References
- 1.Code of Federal Regulations, Title 21, Part 74.1208. Washington, DC: U.S. Government Printing Office; 2011. [Google Scholar]
- 2.Tietze E, Bayer O. Justus Liebigs Annalen der Chemie. 1939;540:189. [Google Scholar]
- 3.Richfield-Fratz N. J. Assoc. Off. Anal. Chem. 1984;67:762. [PubMed] [Google Scholar]
- 4.Sherma J, Mahn M, Follweiler J. J. Planar Chromatogr.–Mod. TLC. 1988;1:65. [Google Scholar]
- 5.Weisz A, Scher AL, Shinomiya K, Fales HM, Ito Y. J. Am. Chem. Soc. 1994;116:704. [Google Scholar]
- 6.Ito Y, Shinomiya K, Fales HM, Weisz A, Scher AL. In: Modern Countercurrent Chromatography. Conway WD, Petroski RJ, editors. Washington, DC: American Chemical Society; 1995. p. 156. [Google Scholar]
- 7.Ito Y. Chapter 6. In: Ito Y, Conway WD, editors. High-Speed Counter-Current Chromatography Chemical Analysis. vol. 132. New York: Wiley; 1996. p. 121. [Google Scholar]
- 8.Ito Y, Ma Y. J. Chromatogr. A. 1996;753:1. doi: 10.1016/s0021-9673(96)00565-1. and references cited therein. [DOI] [PubMed] [Google Scholar]
- 9.Billardello B, Berthod A. In: Countercurrent Chromatography, The Support-Free Liquid Stationary Phase, Wilson & Wilson’s Comprehensive Analytical Chemistry. Berthod A, editor. Vol. 38. Amsterdam: Elsevier; 2002. p. 177. [Google Scholar]
- 10.Ito Y. J. Chromatogr. A. 2005;1065:145. doi: 10.1016/j.chroma.2004.12.044. and references cited therein. [DOI] [PubMed] [Google Scholar]
- 11.Denekamp C, Mandelbaum A, Weisz A, Ito Y. J. Chromatogr. A. 1994;685 doi: 10.1016/0021-9673(94)00669-5. [DOI] [PubMed] [Google Scholar]
- 12.Weisz A, Mazzola EP, Murphy CM, Ito Y. J. Chromatogr. A. 2002;966:111. doi: 10.1016/s0021-9673(02)00695-7. [DOI] [PubMed] [Google Scholar]
- 13.Weisz A, Idina A, Ben-Ari J, Karni M, Mandelbaum A, Ito Y. J. Chromatogr. A. 2007;1151:82. doi: 10.1016/j.chroma.2007.03.085. [DOI] [PubMed] [Google Scholar]
- 14.Tong S, Yan J, Guan Y-X. J. Chromatogr. A. 2008;1212:48. doi: 10.1016/j.chroma.2008.09.114. [DOI] [PubMed] [Google Scholar]
- 15.Wang X, Geng Y, Li F, Liu J. J. Separation Science. 2007;30:3214. doi: 10.1002/jssc.200700167. [DOI] [PubMed] [Google Scholar]
- 16.Degenhardt A, Winterhalter P. J. Liquid Chromatogr. & Rel. Technol. 2001;24:1745. [Google Scholar]
- 17.Weisz A. Chapter 12. In: Ito Y, Conway WD, editors. High-Speed Countercurrent Chromatography Chemical Analysis. vol. 132. New York: Wiley; 1996. p. 337. [Google Scholar]
- 18.Oka H, Suzuki M, Harada K-I, Iwaya M, Fujii K, Goto T, Ito Y, Matsumoto H, Ito Y. J. Chromatogr. A. 2002;946:157. doi: 10.1016/s0021-9673(01)01548-5. [DOI] [PubMed] [Google Scholar]
- 19.Weisz A, Ito Y. In: Encyclopedia of Separation Science (III) Wilson ID, Adlard ER, Cooke M, Poole CF, editors. vol. 6. London: Academic Press; 2000. p. 2588. and references cited therein. [Google Scholar]
- 20.Weisz A, Mazzola EP, Matusik JE, Ito Y. J. Chromatogr. A. 2001;923:87. doi: 10.1016/s0021-9673(01)00984-0. [DOI] [PubMed] [Google Scholar]
- 21.Weisz A, Mazzola EP, Ito Y. J. Chromatogr. A. 2009;1216:4161. doi: 10.1016/j.chroma.2009.02.064. [DOI] [PMC free article] [PubMed] [Google Scholar]
- 22.Chevolot L, Colliec-Jouault S, Foucault A, Ratiskol J, Sinquin C. J. Chromatogr. B. 1998;706:43. doi: 10.1016/s0378-4347(97)00448-9. [DOI] [PubMed] [Google Scholar]
- 23.Pennanec R, Viron C, Blanchard S, Lafosse M. J. Liq. Chrom. & Rel. Technol. 2001;24:1575. [Google Scholar]


