

Abstract
The laminin binding integrin α6β1 plays a major role in determining the aggressive phenotype of tumor cells during metastasis. Our previous work has shown that cleavage of the α6β1 integrin to produce the structural variant α6pβ1 on tumor cell surfaces is mediated by the serine protease uPA. Cleavage of α6β1 increases tumor cell motility, invasion, and prostate cancer metastasis, and blockage of uPA inhibits α6pβ1 production. In human tumors uPA and uPAR are expressed in tumor cells and tumor associated macrophages (TAMs). TAMs localize to solid tumors and contribute to increased tumor growth and the metastatic phenotype. In our present study, we utilized a co-culture system of PC-3 prostate tumor cells and macrophages (12-O-tetradecanoylphorbol-13-acetate (TPA) differentiated human leukemia HL-60 cells) to investigate the hypothesis that macrophages stimulate the production of the pro-metastatic variant α6pβ1 on human prostate cancer cells via the uPA/uPAR axis. Our results indicate that adherent macrophages co-cultured with PC-3 cells increased PC-3 uPAR mRNA, uPAR cell-surface protein expression and α6 integrin cleavage. The stimulation does not require macrophage/tumor cell contact since macrophage conditioned medium is sufficient for increased uPAR transcription and α6 cleavage dependent PC-3 cell invasion. The increased cleavage was dependent on uPAR since production was blocked by silencing RNA targeting uPAR. These results indicate that macrophages can stimulate uPA/uPAR production in tumor cells which results in α6 integrin cleavage. These data suggest that tumor associated macrophages promote pro metastatic integrin dependent pericellular proteolysis.
Keywords: macrophage, integrin, prostate cancer, uPAR, uPA
Introduction
Chronic inflammation is a major contributor to tumor initiation, progression and metastasis in multiple cancer types including prostate cancer (1-2). The main determinant of patient mortality is the aggressive phenotype of cancer cells, which is dictated by their capacity to invade and metastasize (3). Inflammatory responses in the solid tumor environment promote tumor metastasis by recruiting migratory immune cells such as macrophages which originate from blood monocytes in the bone marrow. These tumor associated macrophages (TAMs) are attracted from circulation to the tumor due to neoplastic production of inflammatory cytokines and chemokines and will undergo differentiation at the tumor site (4). Therefore, these specific macrophages are considered to be a tumor educated and tumor specific macrophage (5-6). The TAMs can produce various growth factors and cytokines which increase the survival and metastatic capabilities of tumor cells (7) and also directly affect the degradation of the basement membrane surrounding tumor cells by secreting proteases (8-9).
The presence of TAMs is correlated with poor patient outcome in aggressive tumors including breast, cervical and bladder cancer (10). The density, size, and location of tumor infiltrating macrophages in prostate cancer were reported as powerful predictors of patient outcome (11) and prostate cancer specimens harbor increased positive cells expressing the macrophage specific marker CD68 compared to benign glands (12). More recently, it was demonstrated that expression of macrophage colony-stimulating factor (M-CSF) and its receptor colony-stimulating factor-1 receptor (CSF-1R) are increased in primary tumors of patients exhibiting metastatic disease (13), although other studies have demonstrated variable evidence for TAMs during prostate cancer progression (11-12, 14-15).
The metastatic process during prostate cancer progression is accompanied by significant alterations in the composition of the basement membrane and interactions between extracellular matrix (ECM) proteins and cell surface receptors called integrins. TAMs can affect these interactions dramatically as reviewed by Coussens et al. (1). Integrins are type 1 transmembrane receptors which bind extracellular matrix proteins including collagens, laminins, fibronectin and vitronectin. In humans, there are currently 18 alpha and 8 beta subunits which form 24 non-covalently associated and unique alpha and beta heterodimers (16). Previously, we identified that human prostate cancer expresses exclusively laminin receptors (α3β1, α6β1 and α6pβ1) (17). Prostate cancer cell migration and bone metastasis in vivo (18-19) depends upon the production of a variant form of α6β1 created by removal of the extracellular binding domain via the serine protease urokinase plasminogen activator (uPA). uPA is a serine protease which converts plasminogen to plasmin by binding with high affinity to either the membrane-bound or soluble urokinase plasminogen activator receptor (uPAR). The urokinase plasminogen activator (uPA) system plays a significant role in promoting cancer invasion and metastasis through regulation of pericellular proteolysis. Recent evidence has demonstrated that uPAR signaling to promote tumor progression is also coordinated by interactions with the integrin family of receptors (20). Studies have determined that uPAR is expressed in multiple tumor-associated cell types including the tumor cells and tumor associated stromal cells, neutrophils and macrophages (21-22). In prostate cancer, the uPA/uPAR system is associated with prostate cancer metastasis (23-24). Recent work by Zhang et al. demonstrates the requirement for stromal uPA and uPAR in promoting prostate tumor growth and macrophage infiltration in vivo (25).
The goal for this study was to determine whether macrophages induced cleavage of the α6 integrin to the variant α6p through activation of the uPA/uPAR system in prostate tumor cells. To perform these studies we used a co-culture system comprised of prostate tumor cells and the human myeloid leukemia HL-60 cell line treated with the phorbol ester 12-O-tetradecanoylphorbol-13-acetate (TPA) as a model for macrophages. Results presented here demonstrate that macrophages co-cultured with PC-3 cells induced uPAR expression and cleavage of the α6 integrin receptor on the prostate tumor cell lines. Macrophage stimulation of integrin cleavage and uPAR expression was not reliant on direct contact between the macrophages and tumor cells since macrophage conditioned medium induced uPAR expression and α6 cleavage on PC-3 cells and α6 cleavage on the DU-145 cell line. Increased PC-3 invasion in response to macrophage conditioned media and human primary monocytes was inhibited by an α6 cleavage blocking antibody. Silencing RNA targeting uPAR abrogated macrophage induced integrin cleavage, indicating the requirement for uPAR in regulating macrophage mediated cleavage of the receptor.
Materials and Methods
Antibodies and Reagents
The antibody recognizing uPAR used for flow cytometry was a mouse monoclonal (Clone 3/B10, 3936) from American Diagnostica (Stamford, CT). The mouse monoclonal antibody against the c-terminus of uPAR (MAB807) used for immunoblot analysis was from R & D Systems (Minneapolis, MN). The J1B5 rat monoclonal used for immunoprecipitation and flow cytometry analysis which recognizes α6 was generated by Dr. Caroline H. Damsky. The AA6A rabbit polyclonal recognizing the c-terminus of α6 used for immunoblot has been previously characterized by our group and was generated and purified by Bethyl Laboratories (Montgomery, TX). The J8H antibody against α6 has been previously described (19). The CD13 and CD68 phycoerythrin (PE) and fluorescein (FITC) conjugated antibodies for flow cytometry were obtained from BioLegend (San Diego, CA). The actin polyclonal antibody used for immunoblot was from Cytoskeleton (Denver, CO) and the tubulin antibody was from EMD Bioscience (San Diego, CA). The horseradish peroxidase-conjugated secondary antibodies used for immunoblotting were from Jackson ImmunoResearch Laboratories, Inc. (West Grove, PA). 12-O-Tetradecanoylphorbol-13-acetate (TPA) was obtained from Ted Pella, Inc. (Redding, CA). Carboxyfluorescein diacetate, succinimidyl ester (CFSE) cell tracer proliferation kit was obtained from Invitrogen. Matrigel was obtained from BD Bioscience (San Jose, CA).
Cell Culture and Co-Culture Conditions
Human prostate cancer PC-3 and DU-145 cells and myeloid leukemia HL-60 cells were obtained from American Type Tissue Collection (ATCC, Manassas, VA) and maintained in Iscove's Modified Dulbecco's Medium (IMDM; Invitrogen, Carlsbad, CA) supplemented with 10% fetal bovine serum (Hyclone Laboratories, Logan, UT). The cells were grown at 37°C in a 5% CO2 atmosphere with constant humidity. Co-culture experiments using the prostate tumor cells and TPA differentiated HL-60 cells were performed according to the diagram in Figure 1A. The HL-60 cells (1 × 10⁷ cells) were treated with 32 nM TPA in IMDM medium for 72 hours to induce differentiation of HL-60 cells into adherent macrophages. After 72 hours the medium was aspirated and the cells were rinse with PBS. IMDM supplemented with 10% FBS was added without TPA. Prostate cells were labeled with CFSE (10 μM) according to manufacturer recommendations (Invitrogen). The CFSE labeled prostate cells were incubated with the adherent macrophages for 24, 48 or 72 hours. At each time point the co-cultures were harvested using 5 mM EDTA/PBS and the CFSE expressing prostate cells were isolated from the macrophages using a FACSAria cell sorter (BD Bioscience). Macrophage conditioned medium was collected from TPA differentiated HL-60 cells incubated for 24, 48 or 72 hours in IMDM medium supplemented with 10% FBS.
Figure 1. Macrophages increased α6 cleavage and uPAR expression in prostate tumor cells.
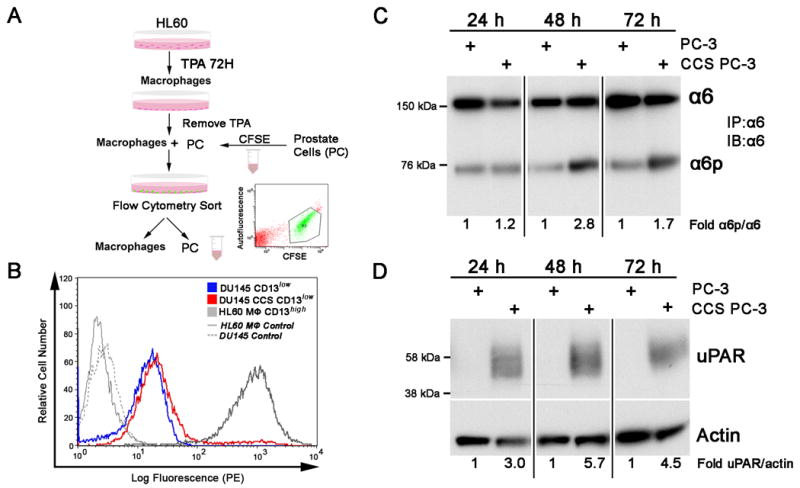
A. Schematic of experiment procedure illustrates that human myeloid leukemia HL-60 cells were treated with 32 nM TPA for 72 hours to induce differentiation to adherent macrophages. The TPA was removed and prostate tumor cells (PC) previously labeled with CFSE were incubated with the macrophages for 24, 48 or 72 hours. The CFSE labeled prostate cells were isolated from the macrophages using flow cytometry (inset) and analyzed for integrin and uPAR expression. B. CFSE labeled prostate (PC) cells cultured with TPA differentiated HL-60 cells are effectively sorted from the macrophages by flow cytometry. DU-145 cells were used to optimize the procedure since they express low levels of the macrophage marker CD13. PC cells (CD13low; blue) cultured alone express equivalent levels of CD13 as PC cells co-cultured and cell sorted from macrophages (PC CCS CD13low; red). TPA differentiated HL-60 (HL-60 MΦ CD13high; grey) express CD13 as expected. C. Using the optimized protocol, PC-3 cells were co-cultured with macrophages and sorted (CCS) at 24, 48 or 72 hours. The resulting PC-3 cells were lysed and the α6 integrin was immunoprecipitated using the J1B5 antibody and immunoblot analysis determined α6 and α6p expression. B. PC-3 and CCS PC-3 cells were lysed and immunoblot analysis was performed using an anti-uPAR specific antibody. Actin expression was determined as a loading control. Results are representative of three independent experiments. Image J analysis was used to perform quantification of immunoblot results.
Isolation of Human Monocytes
Human monocytes were isolated from normal donor peripheral blood by mononuclear cell adherence to plastic culture dishes as previously described (26). Briefly, peripheral blood from a normal donor was diluted 1:1 in RPMI and mixed by gentle inversion. Ficoll was layered on top of the diluted blood in an equal volume. The samples were centrifuged at 400 ×g for 40 minutes with slow deceleration at room temperature. The top layer was aspirated and the peripheral blood leukocytes were isolated from the buffy layer and washed with PBS and centrifuged for 3 minutes at room temperature. The cells were cultured in DMEM medium (Invitrogen) supplemented with L-glutamine (2 mM), 10% FBS and penicillin/streptomycin for conditioned medium experiments. Isolated cells were fixed with Fix and Perm reagent according to manufacturer recommendations (Invitrogen) and flow cytometry for CD68 expression was used to identify monocytes.
Flow Cytometric Analysis
Flow cytometry analysis was used to determine uPAR cell surface expression on PC-3 cells cultured with macrophages. PC-3 cells previously labeled with CFSE were cultured with macrophages for 24, 48 or 72 hours as outlined in the culturing methods section. The cells were harvested using 5mM EDTA/PBS and 1.5 × 10⁶ cells were used per experimental condition. The cells were washed in 0.2% BSA/PBS and centrifuged at 1000 RPM at 4°C for 2 minutes. The cells were suspended in 500 μL 0.2% BSA/PBS with a uPAR specific antibody (American Diagnostica) diluted 1:200. Antibody binding was detected using goat anti-mouse IgG phycoerythrin (PE) conjugated antibody diluted 1:500 (Invitrogen). All antibody reactions were incubated on ice for 30 minutes with gentle vortexing every 5 minutes. Flow cytometry experiments to determine uPAR levels on differentiated HL-60 cells used Alexa Fluor 488 (Invitrogen) secondary antibody diluted 1:500 for antibody binding detection. Flow cytometry experiments to determine CD68+ human monocytes required an anti-CD68-PE antibody diluted 1:100 for detection. DU-145 and differentiated HL-60 cultures were analyzed by flow cytometry using an anti-CD13-PE antibody diluted 1:100 for detection.
Immunoprecipitation and Immunoblot Analysis
The α6 integrin was immunoprecipitated (IP) from PC-3 and DU-145 cells using the J1B5 antibody (1:100) in radioimmunoprecipitation buffer (RIPA, 50 mmol/L Tris, 150 nmol/L NaCl, 1% Triton, 0.10% SDS, 1% deoxycholate) with complete mini protease inhibitor cocktail (Roche, Indianapolis, IN). The IP was incubated at 4°C with continuous rotation overnight. The samples were resolved using SDS-PAGE and immunoblot analysis using the α6 integrin specific antibody AA6A (1:10,000) was performed and detected with a HRP-conjugated anti-rabbit antibody. uPAR expression was determined by lysing the cells in RIPA buffer, resolving the samples by SDS-PAGE and immunoblotting using a uPAR specific antibody (R & D Systems) (1:2,500) detected by a HRP-conjugated anti-mouse antibody. The proteins were visualized using chemiluminescence (ECL Western Blotting Detection System, Amersham, Arlington Heights, IL). The uPAR blots were stripped with 0.2 M NaOH (Sigma, St. Louis, MO) for 5 minutes with rotation at room temperature, rinsed in tris-buffered saline with Tween (0.01%) and reacted with actin or tubulin specific antibodies prior to ECL detection.
Quantitative Real-Time RT-PCR
Total RNA was isolated using the RNAEasy Mini Kit (Qiagen, Valencia, CA). Taqman gene expression probes for uPAR (Hs00182181_m1) and GAPDH (Hs99999905_m1) were obtained from Applied Biosystems (Foster City, CA). RT-PCR data was generated using the Taqman One Step Kit (Applied Biosystems). The REST software program was used to calculate uPAR mRNA levels normalized to GAPDH in each sample. Results include three separate experiments and data are presented as mean ± SD. Statistical analysis was performed using a two-tailed Student's t test.
Silencing RNA Targeting uPAR
The siGENOME silencing RNA (siRNA) smart pool targeting uPAR and a control non-targeting siRNA pool were obtained from Dharmacon Research (Lafayette, CO). Transfection was performed as suggested by Dharmacon Research with slight modifications. Briefly, 2.0 × 10⁵ PC-3 cells were plated in 100 mm tissue culture dishes in IMDM medium supplemented with 10% FBS and transiently transfected the following day with 25 nM uPAR siRNA or control siRNA pools using Dharmafect reagent 2 for 96 hours. Macrophage conditioned medium was added to the siRNA transfected PC-3 cells for 24 or 48 hours and the cells were lysed using RIPA buffer.
Invasion Assay
The tumor cell invasion assay was performed as previously described with slight modifications (19). Briefly, 50 μl of growth factor reduced Matrigel diluted 1:4 with serum free IMDM media was placed in 8.0 micron cell culture inserts (BD Falcon, Franklin Lakes, NJ) and allowed to solidify for 1 hour at 37°C. The inserts were placed into a 24 well plate with 600 μL macrophage conditioned medium supplemented with 10% FBS or IMDM or DMEM supplemented with 10% FBS on the bottom well below the insert. PC-3 (2×10⁵) cells were placed in the upper insert chamber with 200 μL of serum free IMDM. Following 24 hour incubation, inserts were washed in PBS and the Matrigel was removed with a cotton swab. Cells on the underside of the insert were fixed and permeabilized in methanol/acetone and stained with 4′,6-diamidino-2-phenylindole (1 μg/mL) for nuclei detection. Cell numbers were counted using a Zeiss Axiophot inverted microscope. Five random images were collected per insert at a magnification of 20×. Results include three separate experiments performed in quadruplicate and data are presented as mean ± SD. Statistical analysis was performed using a two-tailed Student's t test.
Results
Macrophages stimulated production of the α6p integrin and uPAR expression in PC-3 prostate tumor cells
Figure 1A illustrates the co-culturing method for TPA differentiated HL-60 cells (macrophages) with prostate tumor cells. The HL-60 cells were differentiated into macrophages using TPA and were incubated with CFSE labeled prostate cells for 24, 48 or 72 hours. HL-60 cells are human myeloid leukemia cells that reproducibly differentiate into macrophages in response to TPA as demonstrated by increased uPAR expression (27) shown in Supplementary Figure 1. The labeled prostate cells were then sorted from the macrophages using flow cytometry to select CFSE positive cells (Fig. 1A inset). Figure 1B demonstrates that cell sorting by CFSE expression effectively removes CD13high macrophages from CD13low prostate tumor cells as demonstrated by the absence of CD13 on prostate cells sorted from macrophages. DU-145 cells were used due to low endogenous CD13 expression when compared to PC-3 cells (28). Minimal macrophage phagocytosis of the prostate cells occurs during the co-culture process as demonstrated by flow cytometry analysis of DU-145 and macrophage co-cultures shown in Supplementary Figure 2 (S2). CD13 labeled macrophages (S2.B) and CFSE labeled DU-145 cells (S2.C) cultured together demonstrate a 3.7% increase in cells expressing both CFSE and CD13 (S2.D). PC-3 cells co-cultured with macrophages and cell sorted at 24, 48 and 72 hours exhibited increased α6p at 24 (1.2 fold), 48 (2.8 fold) and 72 hours (1.7 fold) (Fig. 1C). These results correlated with increased PC-3 uPAR expression at 24 (3.0 fold), 48 (5.7 fold) and 72 hours (4.5 fold) (Fig. 1D).
Macrophages increased PC-3 prostate tumor cell surface uPAR expression
Cleavage of the α6 integrin to α6p is a cell surface event (29-31). Therefore, we next determined whether increased total cell uPAR resulted in increased cell surface expression of the receptor. Flow cytometric analysis indicated an increased number of PC-3 cells expressing cell surface uPAR (Fig. 2A) when compared to PC-3 cells cultured alone (Fig. 2B). Results from three independent experiments represented by Fig. 2A and 2B are graphically depicted in Fig. 2E and demonstrate that macrophages significantly increased the number of PC-3 cells expressing uPAR on the cell surface at 24, 48 or 72 hours. Total cells surface levels of uPAR are increased 8 fold on PC-3 cells and exhibit broad distribution when the PC-3 cells are incubated with macrophages for 72 hours (Fig. 2F).
Figure 2. Macrophages increased cell surface uPAR on PC-3 prostate tumor cells.

A-D. PC-3 and macrophage co-cultures were analyzed by flow cytometry for cell surface expression of uPAR. PC-3 cells labeled with CFSE were co-cultured with macrophages for 24, 48 or 72 hours and all cells in the culture were labeled with an anti- uPAR specific antibody and a PE labeled secondary antibody. A. PC-3 (CFSE labeled) and macrophage co-culture grown for 24, 48 or 72 hours demonstrates uPAR expression on each cell population. The upper left quadrant indicates macrophages expressing cell surface uPAR (PE). The upper right quadrant (arrow) indicates PC-3 cells labeled with CFSE which express high levels of uPAR and the lower right quadrant (arrowhead) indicates PC-3 cells labeled with CFSE which express low levels of uPAR. B. PC-3 cells cultured alone for 24, 48 or 72 hours were labeled with CFSE and an anti- uPAR primary and PE conjugated secondary antibody prior to flow cytometric analysis. C. Macrophages cultured for 24, 48 and 72 hours express high levels of uPAR. D. Non-specific secondary antibody binding to PC-3 and macrophage co-cultures. E. The percent of PC-3 cells expressing cell surface uPAR in the presence or absence of macrophages. The results include three independent experiments. Columns, means; bars, SD. *P<0.05 for PC-3 cells expressing uPAR when cultured with macrophages compared to PC-3 cells alone. All statistical analysis was performed using the Student's t-test. F. Flow cytometric analysis of total uPAR cell surface expression on PC-3 cells (light gray) and PC-3 cells co-cultured with macrophages (CC PC-3) (dark grey and shadowed) for 72 hours. Mean fluorescent peak values are shown above each curve on the histogram.
Conditioned medium from macrophages increased α6p integrin and uPAR expression in prostate tumor cells
We next asked whether macrophage and tumor cell contact was a requirement for macrophage stimulation of uPAR and α6p production in prostate tumor cells by providing only macrophage conditioned medium to the prostate tumor cells. Macrophage conditioned medium increased the conversion of α6 to α6p on both PC-3 (2.5 fold, Fig. 3A left panel) and DU-145 (2.3 fold, Fig. 3B left panel) prostate tumor cells lines at 48 hours when compared to undifferentiated HL-60 conditioned medium or IMDM alone. These results correlated with increased PC-3 cell uPAR protein expression (1.5 fold, Fig. 3A right panel) determined at 48 hours post conditioned medium treatment. DU-145 cells express constitutive levels of uPAR which were not elevated in the presence of macrophage conditioned medium (Fig. 3B right panel). Results in Fig. 3C demonstrate that conditioned macrophage medium increased uPAR mRNA expression 2.5 fold in PC-3 cells at 48 hours post conditioned medium treatment.
Figure 3. Differential regulation of uPAR and α6 cleavage in prostate cell lines exposed to macrophage conditioned medium.

A. Immunoprecipitation and immunoblot analysis for α6 and α6p from PC-3 cells (left panel) and immunoblot analysis for uPAR (right panel) treated for 48 hours with control IMDM, macrophage conditioned medium (MΦ CM) or undifferentiated HL-60 medium (HL-60 CM). B. Immunoprecipitation and immunoblot analysis for α6 and α6p from DU-145 cells (left panel) and immunoblot analysis for uPAR (right panel) treated for 48 hours with control IMDM or macrophage conditioned medium (MΦ CM). Tubulin is shown as a loading control for uPAR. Image J analysis was used to perform quantification of immunoblot results. The results are representative of more than three independent experiments. C. Quantitative real-time RT-PCR demonstrates increased uPAR mRNA levels in PC-3 cells treated for 48 hours with macrophage conditioned medium when compared to control IMDM medium. The results include three independent experiments performed in triplicate (*P<0.05). Columns, mean; bars, SD.
Silencing RNA targeting uPAR in PC-3 cells prevented macrophage induced α6p integrin production
PC-3 cells were transiently transfected with silencing RNA (siRNA) targeting uPAR and a non-targeting pooled siRNA as a control and incubated with macrophage conditioned medium. Depletion of uPAR from PC-3 cells occurs at 96 hours post treatment with siRNA (Fig. 4A) and inhibits α6p production (Fig. 4B). Under these conditioned, macrophage conditioned media does not induce uPAR expression (Fig. 4A) or α6p production (Fig. 4B). These results demonstrate that uPAR is required for macrophage induced cleavage of integrin α6.
Figure 4. Silencing RNA targeting uPAR inhibited macrophage induced α6p on prostate tumor cells.

A. Immunoblot analysis was performed to determine uPAR expression in PC-3 cells transfected with silencing RNA targeting uPAR. In lane 1, PC-3 cells treated with siRNA control (siCON) were incubated with macrophage conditioned medium (MΦ CM) to demonstrate increased uPAR expression in the presence of MΦ CM. In lanes 2 and 3, the cells were incubated with a siCON or uPAR specific siRNA (siuPAR) for 96 hours followed by incubation in IMDM control medium or MΦ CM for an additional 48 hours prior to cell lysis and protein isolation. In lanes 4 and 5, the PC-3 cells were transiently transfected with siCON or siuPAR for 96 hours and IMDM or MΦ CM were added to the cells with fresh siCON or siuPAR for an additional 48 hours prior to cell lysis and protein isolation. B. Integrin α6 was immunoprecipitated from cell lysates and immunoblot analysis was performed to detect expression of the integrin.
Macrophages increased α6p dependent PC-3 tumor cell invasion
We next asked whether TPA differentiated HL-60 macrophages or human monocytes increased α6p dependent tumor cell invasion. The PC-3 tumor cells were applied to Matrigel-coated inserts to determine if invasion was increased in response to macrophage conditioned medium. PC-3 cell invasion through Matrigel was increased by 66% in response to conditioned medium from TPA differentiated HL-60 cells when compared to undifferentiated HL-60 cell conditioned medium, and by 93% when compared to IMDM medium supplemented with 10% FBS (Fig. 5A). PC-3 invasion was increased by 93% in the presence of human monocyte conditioned medium when compared to control medium (Fig. 5B). Increased PC-3 cell invasion in response to macrophage or human monocyte conditioned medium was inhibited by 81% and 54%, respectively, when the prostate cells were treated with the α6 cleavage blocking antibody J8H (Fig. 5A and B).
Figure 5. J8H inhibits macrophage and human monocyte induced prostate cancer cell invasion through Matrigel.

A. PC-3 cells were incubated with IMDM, HL-60 conditioned medium (HL-60 CM) and TPA differentiated HL-60 conditioned medium (HL60 MΦ CM) in the presence or absence of the J8H α6 cleavage blocking antibody (50 μg/ml) in a Matrigel invasion assay. HL60 macrophage conditioned medium significantly increased PC-3 tumor cell invasion which was blocked by the J8H antibody B. Human monocyte conditioned medium (HMCM) significantly increased PC-3 invasion which was blocked by the J8H antibody. Results are expressed as the mean of three independent experiments performed in quadruplicate. Columns, means; bars, SD. * P<0.05 for PC-3 invasion induced by macrophage or human monocyte conditioned medium compared to all other treatment groups. Approximately 600 and 250 cells are represented by 100% invasion for HL-60 macrophage conditioned media and monocyte conditioned media, respectively.
Discussion
Macrophages induced production of α6pβ1 on prostate tumor cell surfaces in an in vitro co-culture model. Macrophage dependent increased α6p does not require macrophage and tumor cell contact since macrophage conditioned medium induced cleavage of the integrin on prostate tumor cell lines. The observed formation of macrophage induced α6p is dependent on increased uPAR expression since silencing RNA targeting uPAR blocked cleavage of the integrin in the presence of macrophage conditioned medium. Increased prostate tumor cell invasion in response to macrophage conditioned medium is dependent on α6p since a cleavage blocking antibody (J8H) inhibited prostate tumor cell invasion in in vitro invasion assays. Results from this study demonstrate a new mechanism by which macrophages increase the invasive phenotype of prostate tumor cells through modulation of α6β1 integrin cleavage.
Macrophages regulate tumor cell invasion and metastasis by facilitating degradation of the basement membrane surrounding tumor cells by inducing tumor cell proteases (32). The production of α6p suggests that macrophages stimulate a new form of pericellular proteolysis, i.e. integrin α6p formation. Presumably this would be coordinated with immune cells to direct tumor cell invasion and metastasis by secretion of cytokines which affect tumor cell chemotaxis (4, 7). The presence of highly motile macrophages in regions surrounding vessels which promote tumor cell intravasation into blood vessel walls in metastatic mammary tumors in vivo has been reported (33) and it is thought that the presence of macrophages along vessel walls causes tumor cell intravasation as they react to the abundance of chemotactic factors produced by the macrophages (34). Investigation of the role macrophages play in regulating tumorigenesis has been demonstrated in vitro and in vivo. In vitro co-culture models have established the role of macrophages in regulating invasion (32) growth (35) and survival (36). Specific to prostate cancer, it has been identified that macrophage interactions with tumor cells promote androgen resistance (37) and increased prostate cancer invasion through tissue factor (TF) expression (12). Recent in vivo studies by Bianchi-Frias et al. demonstrated a significant increase in infiltrating inflammatory cells including macrophages in the prostates of aged mice (38), reflecting the prominent role for inflammation during the aging process, which is linked to prostate cancer development.
In this study, the well characterized human myeloid leukemia HL-60 cell line was used as a model system for macrophages. The use of TPA to stimulate the HL-60 cell line into a monocyte/macrophage pathway of differentiation has been investigated (39). TPA differentiated HL-60 macrophage cells have been widely used as a model for studying macrophage interactions with various cell types in in vitro models (40-42) and express cell surface receptors, growth factors and proteases characteristic of tumor associated macrophages. For instance, TPA differentiated HL-60 cells express the matrix metalloproteinase MMP-9 (43) mimicking TAMs which secrete MMP-9 during processes of angiogenesis in human cervical cancer in vivo (44). TPA differentiated HL-60 cells express uPA and uPAR as shown here (Fig. 1) and by others (45-46). Additionally, HL-60 cells express colony-stimulating factor 1 (CSF-1), a growth factor originally identified as a major regulator of macrophage proliferation and differentiation (47), and its associated receptor CSF-1R upon TPA treatment (48). Recent evidence has shown that CSF-1 is expressed in mammary tumors and contributes to metastatic tumor progression and increased presence of macrophages in primary tumors in vivo (49). Increased expression of CSF-1R in macrophage lineage cells in human prostate cancer tissue has also been reported (50).
In this study, tumor cell line and macrophage co-cultures demonstrated macrophage increased α6p and uPAR protein expression. Macrophage conditioned medium induced both uPAR mRNA and protein and integrin α6p on PC-3 prostate tumor cells indicating transcriptional regulation of uPAR will direct α6 cleavage in tumor cells. Interestingly, TAMs are recruited to poorly vascularized, hypoxic and necrotic areas of tumors (51) and secrete factors such as vascular endothelial growth factor (VEGF) to stimulate angiogenesis (52). VEGF increases uPAR mRNA levels indicating transcriptional control of uPAR in the presence of this growth factor (53). It is also pertinent that VEGF and uPAR are both transcriptionally regulated by hypoxia-inducible factor 1 alpha (HIF1A) (54-55), a hypoxia regulated transcription factor which activates genes required for critical aspects of tumor progression. TPA differentiated HL-60 cells exhibit increased expression of VEGF upon TPA treatment (56), which could be a potential regulator of uPAR transcription in our system. Depletion of uPAR from PC-3 cells using silencing RNA indicated the requirement for tumor cell derived uPAR in cleavage of α6β1 in the presence of macrophage conditioned medium. These results demonstrate that tumor infiltrating macrophages stimulate prostate tumor invasion through a coordinated mechanism of uPAR induction and subsequent integrin cleavage, a process which does not require direct contact between tumor cells and the TAMs. These results suggest that although prostate tumors can exhibit low levels of macrophage infiltration as previously reported (15), the TAM mediated paracrine regulation of tumor cell uPAR and α6β1 may be expansive. Notable contributing factors may include TAM secreted cytokines such as IL-1β (51, 57) or growth factors including epidermal growth factor (EGF) (58).
It is intriguing that a subpopulation of PC-3 cells exists which does not exhibit increased uPAR expression in response to macrophages (Figure 2A). This demonstrates differential regulation of tumor cell responses to macrophages and may be a useful clue for determining whether an aggressive macrophage responsive phenotype exists in prostate cancer patients. Furthermore, DU-145 cells have constitutive expression of uPAR and exhibit increased α6p production in response to macrophages. These results suggest that other components of the uPA/uPAR axis may increase α6 cleavage in DU-145 cells. Tumor cell uPA or suppression of plasminogen activator inhibitor-1 (PAI- 1) are likely candidates responsive to macrophage derived signals in cells exhibiting constitutive levels of the uPAR receptor. The increased availability of uPA secreted by macrophages may also contribute to the observed increase in integrin α6p formation on DU-145 cells. The functional role of macrophage dependent increased α6p was demonstrated in in vitro invasion assays (Figure 5) which indicated that blocking α6 cleavage impeded prostate tumor cell invasion in response to macrophages. This antibody does not affect cell adhesion (59). Therefore, these results highlight a novel mechanism by which a tumor specific modification of a cell surface receptor induced by the stromal environment can be targeted to halt invasive progression of this disease.
In summary, we have identified that macrophages increased uPAR and α6p integrin on PC-3 cells and α6p on DU-145 cells. The role of the uPA in α6p formation to promote prostate cancer cell migration, invasion and metastasis to bone (17, 19, 29, 31) has been established. Reagents developed in our laboratory have demonstrated that this cleavage event and α6 integrin dependent tumor cell migration and metastasis are inhibited when this function of the receptor is blocked (19, 60). Here, we demonstrate that tumor associated macrophages directly contribute to an invasive tumor cell phenotype by modulating α6p through the uPA receptor, uPAR. Identifying contributing factors in the tumor microenvironment which modulate this cleavage event on tumor cells is necessary for determining alternative therapeutic targets for a multi-modality approach to inhibit the invasion steps of metastasis. Inhibition of tumor associated macrophages combined with specific blockade of integrin cleavage and uPAR will be essential for controlling metastatic spread in prostate cancer.
Supplementary Material
Supplementary Figure 1. TPA induced differentiation of HL-60 cells to macrophages as demonstrated by increased uPAR expression. A. The macrophage differentiation marker uPAR is increased at 24, 48, and 72 hours post treatment with 32 nM TPA as shown by immunoblot analysis. Actin is shown as a loading control. Image J analysis was used to perform quantification of immunoblot results. B. Flow cytometric analysis of HL-60 cells indicates cell surface expression of uPAR following treatment with 32 nM TPA for 24, 48 or 72 hours. The solid grey peak demonstrates non-specific secondary antibody binding.
Supplementary Figure 2. Macrophage and prostate tumor cell co-cultures demonstrate low CFSE expression in macrophages. A-D. DU-145 and TPA differentiated HL-60 macrophage 72 hour co-cultures were analyzed by flow cytometry for cell surface expression of CD13 (PE) and CFSE (FITC). DU-145 cells labeled with CFSE were co-cultured with the macrophages for 72 hours and the cells were labeled with an anti-CD13-PE specific antibody. A. DU-145 and macrophage culture without CD13-PE antibody labeling. B. Macrophages labeled with an anti-CD13-PE antibody C. CFSE expression in DU-145 cells following 72 hours of culture. D. CFSE labeled DU-145 cells and macrophage co-cultures demonstrate 3.72% of cells express both CD13 and CFSE following 72 hours in culture.
Acknowledgments
We would like to thank Dr. Terry Landowski for her technical assistance in human monocyte isolation procedures. This work was supported in part by NIH grants P01 CA56666 and P30 CA23074. The Arizona Cancer Center Genomics Core is supported by the Southwest Environmental Health Sciences Center NIEHS grant ES06694. The Genomics and Flow Cytometry Cores are supported by the Arizona Cancer Center NIH grant CA23074. CPS was supported by the T34 GM 8718 grant and HC was supported by the Howard Hughes Medical Institute Grant 52005889.
References Cited
- 1.Coussens LM, Werb Z. Inflammation and cancer. Nature. 2002;420(6917):860–7. doi: 10.1038/nature01322. [DOI] [PMC free article] [PubMed] [Google Scholar]
- 2.De Marzo AM, Platz EA, Sutcliffe S, Xu J, Gronberg H, Drake CG, et al. Inflammation in prostate carcinogenesis. Nat Rev Cancer. 2007;7(4):256–69. doi: 10.1038/nrc2090. [DOI] [PMC free article] [PubMed] [Google Scholar]
- 3.Gupta GP, Massague J. Cancer metastasis: building a framework. Cell. 2006;127(4):679–95. doi: 10.1016/j.cell.2006.11.001. [DOI] [PubMed] [Google Scholar]
- 4.Lewis CE, Pollard JW. Distinct role of macrophages in different tumor microenvironments. Cancer Res. 2006;66(2):605–12. doi: 10.1158/0008-5472.CAN-05-4005. [DOI] [PubMed] [Google Scholar]
- 5.Mantovani A, Sozzani S, Locati M, Allavena P, Sica A. Macrophage polarization: tumor-associated macrophages as a paradigm for polarized M2 mononuclear phagocytes. Trends Immunol. 2002;23(11):549–55. doi: 10.1016/s1471-4906(02)02302-5. [DOI] [PubMed] [Google Scholar]
- 6.Pollard JW. Tumour-educated macrophages promote tumour progression and metastasis. Nat Rev Cancer. 2004;4(1):71–8. doi: 10.1038/nrc1256. [DOI] [PubMed] [Google Scholar]
- 7.Solinas G, Germano G, Mantovani A, Allavena P. Tumor-associated macrophages (TAM) as major players of the cancer-related inflammation. J Leukoc Biol. 2009;86(5):1065–73. doi: 10.1189/jlb.0609385. [DOI] [PubMed] [Google Scholar]
- 8.Allavena P, Sica A, Solinas G, Porta C, Mantovani A. The inflammatory micro-environment in tumor progression: the role of tumor-associated macrophages. Crit Rev Oncol Hematol. 2008;66(1):1–9. doi: 10.1016/j.critrevonc.2007.07.004. [DOI] [PubMed] [Google Scholar]
- 9.Wels J, Kaplan RN, Rafii S, Lyden D. Migratory neighbors and distant invaders: tumor-associated niche cells. Genes Dev. 2008;22(5):559–74. doi: 10.1101/gad.1636908. [DOI] [PMC free article] [PubMed] [Google Scholar]
- 10.Bingle L, Brown NJ, Lewis CE. The role of tumour-associated macrophages in tumour progression: implications for new anticancer therapies. J Pathol. 2002;196(3):254–65. doi: 10.1002/path.1027. [DOI] [PubMed] [Google Scholar]
- 11.Lissbrant IF, Stattin P, Wikstrom P, Damber JE, Egevad L, Bergh A. Tumor associated macrophages in human prostate cancer: relation to clinicopathological variables and survival. Int J Oncol. 2000;17(3):445–51. doi: 10.3892/ijo.17.3.445. [DOI] [PubMed] [Google Scholar]
- 12.Lindholm PF, Lu Y, Adley BP, Vladislav T, Jovanovic B, Sivapurapu N, et al. Role of monocyte-lineage cells in prostate cancer cell invasion and tissue factor expression. Prostate. 2010 doi: 10.1002/pros.21202. [DOI] [PubMed] [Google Scholar]
- 13.Richardsen E, Uglehus RD, Due J, Busch C, Busund LT. The prognostic impact of M-CSF, CSF-1 receptor, CD68 and CD3 in prostatic carcinoma. Histopathology. 2008;53(1):30–8. doi: 10.1111/j.1365-2559.2008.03058.x. [DOI] [PubMed] [Google Scholar]
- 14.Hussein MR, Al-Assiri M, Musalam AO. Phenotypic characterization of the infiltrating immune cells in normal prostate, benign nodular prostatic hyperplasia and prostatic adenocarcinoma. Exp Mol Pathol. 2009;86(2):108–13. doi: 10.1016/j.yexmp.2008.11.010. [DOI] [PubMed] [Google Scholar]
- 15.Shimura S, Yang G, Ebara S, Wheeler TM, Frolov A, Thompson TC. Reduced infiltration of tumor-associated macrophages in human prostate cancer: association with cancer progression. Cancer Res. 2000;60(20):5857–61. [PubMed] [Google Scholar]
- 16.Hynes RO. Integrins: bidirectional, allosteric signaling machines. Cell. 2002;110(6):673–87. doi: 10.1016/s0092-8674(02)00971-6. [DOI] [PubMed] [Google Scholar]
- 17.Schmelz M, Cress AE, Scott KM, Burger F, Cui H, Sallam K, et al. Different phenotypes in human prostate cancer: alpha6 or alpha3 integrin in cell-extracellular adhesion sites. Neoplasia. 2002;4(3):243–54. doi: 10.1038/sj.neo.7900223. [DOI] [PMC free article] [PubMed] [Google Scholar]
- 18.King TE, Pawar SC, Majuta L, Sroka IC, Wynn D, Demetriou MC, et al. The role of alpha 6 integrin in prostate cancer migration and bone pain in a novel xenograft model. PLoS One. 2008;3(10):e3535. doi: 10.1371/journal.pone.0003535. [DOI] [PMC free article] [PubMed] [Google Scholar]
- 19.Ports MO, Nagle RB, Pond GD, Cress AE. Extracellular engagement of alpha6 integrin inhibited urokinase-type plasminogen activator-mediated cleavage and delayed human prostate bone metastasis. Cancer Res. 2009;69(12):5007–14. doi: 10.1158/0008-5472.CAN-09-0354. [DOI] [PMC free article] [PubMed] [Google Scholar]
- 20.Kugler MC, Wei Y, Chapman HA. Urokinase receptor and integrin interactions. Curr Pharm Des. 2003;9(19):1565–74. doi: 10.2174/1381612033454658. [DOI] [PubMed] [Google Scholar]
- 21.Cozzi PJ, Wang J, Delprado W, Madigan MC, Fairy S, Russell PJ, et al. Evaluation of urokinase plasminogen activator and its receptor in different grades of human prostate cancer. Hum Pathol. 2006;37(11):1442–51. doi: 10.1016/j.humpath.2006.05.002. [DOI] [PubMed] [Google Scholar]
- 22.Usher PA, Thomsen OF, Iversen P, Johnsen M, Brunner N, Hoyer-Hansen G, et al. Expression of urokinase plasminogen activator, its receptor and type-1 inhibitor in malignant and benign prostate tissue. Int J Cancer. 2005;113(6):870–80. doi: 10.1002/ijc.20665. [DOI] [PubMed] [Google Scholar]
- 23.Kirchheimer JC, Pfluger H, Ritschl P, Hienert G, Binder BR. Plasminogen activator activity in bone metastases of prostatic carcinomas as compared to primary tumors. Invasion Metastasis. 1985;5(6):344–55. [PubMed] [Google Scholar]
- 24.Shariat SF, Roehrborn CG, McConnell JD, Park S, Alam N, Wheeler TM, et al. Association of the circulating levels of the urokinase system of plasminogen activation with the presence of prostate cancer and invasion, progression, and metastasis. J Clin Oncol. 2007;25(4):349–55. doi: 10.1200/JCO.2006.05.6853. [DOI] [PubMed] [Google Scholar]
- 25.Zhang J, Sudha S, Kosuke M, Gyetko MR, Pienta KJ. Activation of Urokinase Plasminogen Activator and Its Receptor Axis Is Essential for Macrophage Infiltration in a Prostate Cancer Mouse Model. Neoplasia. 2011;13(1):22–30. doi: 10.1593/neo.10728. [DOI] [PMC free article] [PubMed] [Google Scholar]
- 26.Wahl LM, Wahl SM, Smythies LE, Smith PD. Immunologic studies in humans. In: Coligan JE, Kruisbeek AM, Margulies DH, Shevach EM, editors. Unit 7.6A isolation of monocyte/macrophage populations. John Wiley; 2005. pp. 7.6.1–7.6.3. [Google Scholar]
- 27.Nusrat AR, Chapman HA., Jr An autocrine role for urokinase in phorbol ester-mediated differentiation of myeloid cell lines. J Clin Invest. 1991;87(3):1091–7. doi: 10.1172/JCI115070. [DOI] [PMC free article] [PubMed] [Google Scholar]
- 28.Liu AY. Differential expression of cell surface molecules in prostate cancer cells. Cancer Res. 2000;60(13):3429–34. [PubMed] [Google Scholar]
- 29.Demetriou MC, Cress AE. Integrin clipping: a novel adhesion switch? J Cell Biochem. 2004;91(1):26–35. doi: 10.1002/jcb.10675. [DOI] [PMC free article] [PubMed] [Google Scholar]
- 30.Demetriou MC, Pennington ME, Nagle RB, Cress AE. Extracellular alpha 6 integrin cleavage by urokinase-type plasminogen activator in human prostate cancer. Exp Cell Res. 2004;294(2):550–8. doi: 10.1016/j.yexcr.2003.11.023. [DOI] [PMC free article] [PubMed] [Google Scholar]
- 31.Pawar SC, Demetriou MC, Nagle RB, Bowden GT, Cress AE. Integrin alpha6 cleavage: a novel modification to modulate cell migration. Exp Cell Res. 2007;313(6):1080–9. doi: 10.1016/j.yexcr.2007.01.006. [DOI] [PMC free article] [PubMed] [Google Scholar]
- 32.Hagemann T, Robinson SC, Schulz M, Trumper L, Balkwill FR, Binder C. Enhanced invasiveness of breast cancer cell lines upon co-cultivation with macrophages is due to TNF-alpha dependent up-regulation of matrix metalloproteases. Carcinogenesis. 2004;25(8):1543–9. doi: 10.1093/carcin/bgh146. [DOI] [PubMed] [Google Scholar]
- 33.Wyckoff JB, Wang Y, Lin EY, Li JF, Goswami S, Stanley ER, et al. Direct visualization of macrophage-assisted tumor cell intravasation in mammary tumors. Cancer Res. 2007;67(6):2649–56. doi: 10.1158/0008-5472.CAN-06-1823. [DOI] [PubMed] [Google Scholar]
- 34.Condeelis J, Segall JE. Intravital imaging of cell movement in tumours. Nat Rev Cancer. 2003;3(12):921–30. doi: 10.1038/nrc1231. [DOI] [PubMed] [Google Scholar]
- 35.Hewlett G, Opitz HG, Flad HD, Schlumberger HD. Macrophages/monocytes require cell-to-cell contact in order to regulate the growth of a murine lymphoma cell line. J Immunol. 1979;123(5):2265–9. [PubMed] [Google Scholar]
- 36.Kaler P, Galea V, Augenlicht L, Klampfer L. Tumor associated macrophages protect colon cancer cells from TRAIL-induced apoptosis through IL-1beta-dependent stabilization of Snail in tumor cells. PLoS One. 2010;5(7):e11700. doi: 10.1371/journal.pone.0011700. [DOI] [PMC free article] [PubMed] [Google Scholar]
- 37.Zhu P, Baek SH, Bourk EM, Ohgi KA, Garcia-Bassets I, Sanjo H, et al. Macrophage/cancer cell interactions mediate hormone resistance by a nuclear receptor derepression pathway. Cell. 2006;124(3):615–29. doi: 10.1016/j.cell.2005.12.032. [DOI] [PubMed] [Google Scholar]
- 38.Bianchi-Frias D, Vakar-Lopez F, Coleman IM, Plymate SR, Reed MJ, Nelson PS. The effects of aging on the molecular and cellular composition of the prostate microenvironment. PLoS One. 2010;5(9) doi: 10.1371/journal.pone.0012501. [DOI] [PMC free article] [PubMed] [Google Scholar]
- 39.Birnie GD. The HL60 cell line: a model system for studying human myeloid cell differentiation. Br J Cancer Suppl. 1988;9:41–5. [PMC free article] [PubMed] [Google Scholar]
- 40.Kim HW, Murakami A, Williams MV, Ohigashi H. Mutagenicity of reactive oxygen and nitrogen species as detected by co-culture of activated inflammatory leukocytes and AS52 cells. Carcinogenesis. 2003;24(2):235–41. doi: 10.1093/carcin/24.2.235. [DOI] [PubMed] [Google Scholar]
- 41.Koll S, Goppelt-Struebe M, Hauser I, Goerig M. Monocytic-endothelial cell interaction: regulation of prostanoid synthesis in human coculture. J Leukoc Biol. 1997;61(6):679–88. doi: 10.1002/jlb.61.6.679. [DOI] [PubMed] [Google Scholar]
- 42.Ohkawa H, Harigaya K. Effect of direct cell-to-cell interaction between the KM-102 clonal human marrow stromal cell line and the HL-60 myeloid leukemic cell line on the differentiation and proliferation of the HL-60 line. Cancer Res. 1987;47(11):2879–82. [PubMed] [Google Scholar]
- 43.Ries C, Kolb H, Petrides PE. Regulation of 92-kD gelatinase release in HL-60 leukemia cells: tumor necrosis factor-alpha as an autocrine stimulus for basal- and phorbol ester-induced secretion. Blood. 1994;83(12):3638–46. [PubMed] [Google Scholar]
- 44.Giraudo E, Inoue M, Hanahan D. An amino-bisphosphonate targets MMP-9-expressing macrophages and angiogenesis to impair cervical carcinogenesis. J Clin Invest. 2004;114(5):623–33. doi: 10.1172/JCI22087. [DOI] [PMC free article] [PubMed] [Google Scholar]
- 45.Plesner T, Ralfkiaer E, Wittrup M, Johnsen H, Pyke C, Pedersen TL, et al. Expression of the receptor for urokinase-type plasminogen activator in normal and neoplastic blood cells and hematopoietic tissue. Am J Clin Pathol. 1994;102(6):835–41. doi: 10.1093/ajcp/102.6.835. [DOI] [PubMed] [Google Scholar]
- 46.Zheng X, Ravatn R, Lin Y, Shih WC, Rabson A, Strair R, et al. Gene expression of TPA induced differentiation in HL-60 cells by DNA microarray analysis. Nucleic Acids Res. 2002;30(20):4489–99. doi: 10.1093/nar/gkf580. [DOI] [PMC free article] [PubMed] [Google Scholar]
- 47.Stanley ER, Guilbert LJ, Tushinski RJ, Bartelmez SH. CSF-1--a mononuclear phagocyte lineage-specific hemopoietic growth factor. J Cell Biochem. 1983;21(2):151–9. doi: 10.1002/jcb.240210206. [DOI] [PubMed] [Google Scholar]
- 48.Horiguchi J, Warren MK, Kufe D. Expression of the macrophage-specific colony-stimulating factor in human monocytes treated with granulocyte-macrophage colony-stimulating factor. Blood. 1987;69(4):1259–61. [PubMed] [Google Scholar]
- 49.Lin EY, Nguyen AV, Russell RG, Pollard JW. Colony-stimulating factor 1 promotes progression of mammary tumors to malignancy. J Exp Med. 2001;193(6):727–40. doi: 10.1084/jem.193.6.727. [DOI] [PMC free article] [PubMed] [Google Scholar]
- 50.Ide H, Seligson DB, Memarzadeh S, Xin L, Horvath S, Dubey P, et al. Expression of colony-stimulating factor 1 receptor during prostate development and prostate cancer progression. Proc Natl Acad Sci U S A. 2002;99(22):14404–9. doi: 10.1073/pnas.222537099. [DOI] [PMC free article] [PubMed] [Google Scholar]
- 51.Leek RD, Harris AL, Lewis CE. Cytokine networks in solid human tumors: regulation of angiogenesis. J Leukoc Biol. 1994;56(4):423–35. doi: 10.1002/jlb.56.4.423. [DOI] [PubMed] [Google Scholar]
- 52.Leek RD, Hunt NC, Landers RJ, Lewis CE, Royds JA, Harris AL. Macrophage infiltration is associated with VEGF and EGFR expression in breast cancer. J Pathol. 2000;190(4):430–6. doi: 10.1002/(SICI)1096-9896(200003)190:4<430::AID-PATH538>3.0.CO;2-6. [DOI] [PubMed] [Google Scholar]
- 53.Behzadian MA, Windsor LJ, Ghaly N, Liou G, Tsai NT, Caldwell RB. VEGF-induced paracellular permeability in cultured endothelial cells involves urokinase and its receptor. FASEB J. 2003;17(6):752–4. doi: 10.1096/fj.02-0484fje. [DOI] [PubMed] [Google Scholar]
- 54.Krishnamachary B, Berg-Dixon S, Kelly B, Agani F, Feldser D, Ferreira G, et al. Regulation of colon carcinoma cell invasion by hypoxia-inducible factor 1. Cancer Res. 2003;63(5):1138–43. [PubMed] [Google Scholar]
- 55.Sowter HM, Raval RR, Moore JW, Ratcliffe PJ, Harris AL. Predominant role of hypoxia-inducible transcription factor (Hif)-1alpha versus Hif-2alpha in regulation of the transcriptional response to hypoxia. Cancer Res. 2003;63(19):6130–4. [PubMed] [Google Scholar]
- 56.Ohsaka A, Hirota-Komatsu S, Shibata M, Ezaki J, Shinohara F, Yoshida T. Specific association of increased vascular endothelial growth factor expression and its receptors with macrophage differentiation of HL-60 leukemia cells. Biochem Biophys Res Commun. 2008;368(3):543–9. doi: 10.1016/j.bbrc.2008.01.129. [DOI] [PubMed] [Google Scholar]
- 57.Kaler P, Augenlicht L, Klampfer L. Macrophage-derived IL-1beta stimulates Wnt signaling and growth of colon cancer cells: a crosstalk interrupted by vitamin D3. Oncogene. 2009;28(44):3892–902. doi: 10.1038/onc.2009.247. [DOI] [PMC free article] [PubMed] [Google Scholar]
- 58.Wyckoff J, Wang W, Lin EY, Wang Y, Pixley F, Stanley ER, et al. A paracrine loop between tumor cells and macrophages is required for tumor cell migration in mammary tumors. Cancer Res. 2004;64(19):7022–9. doi: 10.1158/0008-5472.CAN-04-1449. [DOI] [PubMed] [Google Scholar]
- 59.Hogervorst F, Kuikman I, Noteboom E, Sonnenberg A. The role of phosphorylation in activation of the alpha 6A beta 1 laminin receptor. J Biol Chem. 1993;268(25):18427–30. [PubMed] [Google Scholar]
- 60.Sroka TC, Pennington ME, Cress AE. Synthetic D-amino acid peptide inhibits tumor cell motility on laminin-5. Carcinogenesis. 2006;27(9):1748–57. doi: 10.1093/carcin/bgl005. [DOI] [PMC free article] [PubMed] [Google Scholar]
Associated Data
This section collects any data citations, data availability statements, or supplementary materials included in this article.
Supplementary Materials
Supplementary Figure 1. TPA induced differentiation of HL-60 cells to macrophages as demonstrated by increased uPAR expression. A. The macrophage differentiation marker uPAR is increased at 24, 48, and 72 hours post treatment with 32 nM TPA as shown by immunoblot analysis. Actin is shown as a loading control. Image J analysis was used to perform quantification of immunoblot results. B. Flow cytometric analysis of HL-60 cells indicates cell surface expression of uPAR following treatment with 32 nM TPA for 24, 48 or 72 hours. The solid grey peak demonstrates non-specific secondary antibody binding.
Supplementary Figure 2. Macrophage and prostate tumor cell co-cultures demonstrate low CFSE expression in macrophages. A-D. DU-145 and TPA differentiated HL-60 macrophage 72 hour co-cultures were analyzed by flow cytometry for cell surface expression of CD13 (PE) and CFSE (FITC). DU-145 cells labeled with CFSE were co-cultured with the macrophages for 72 hours and the cells were labeled with an anti-CD13-PE specific antibody. A. DU-145 and macrophage culture without CD13-PE antibody labeling. B. Macrophages labeled with an anti-CD13-PE antibody C. CFSE expression in DU-145 cells following 72 hours of culture. D. CFSE labeled DU-145 cells and macrophage co-cultures demonstrate 3.72% of cells express both CD13 and CFSE following 72 hours in culture.