

Abstract
An approach for rapid HPLC-based profiling for new GABAA ligands of natural origin has been developed. Active extracts are separated by a single injection of 3 – 10 mg of extract onto a semi-preparative (150 × 10 mm i.d.) HPLC column with gradient elution and time-based fractionation. The microfractions are tested in an automated two-microelectrode voltage-clamp assay on Xenopus oocytes expressing recombinant GABAA channels composed of α1, β2 and γ2S subunits. The protocol has been validated by spiking experiments with inactive extract and the GABAA receptor ligand magnolol, and by profiling of active extracts such as valerian extract containing the known GABAA receptor ligand valerenic acid. For dereplication of GABA containing extracts, we established a rapid and simple procedure by which GABA is analyzed as OPA derivative by reversed-phase HPLC. This dereplication protocol was validated with plant and fungal extracts which had been previously tested active or inactive in the oocyte assay and with spiking experiments.
Keywords: GABAA receptor ligand, microelectrode voltage-clamp assay, Xenopus oocytes, HPLC actvity profiling, dereplication, lead discovery
Introduction
γ-Aminobutyric acid type A (GABAA) receptors are the major mediators of fast synaptic inhibition in the central nervous system. They are composed of five subunits forming a ligand gated chloride channel. GABAA receptors may be assembled from combinations of nineteen subunit isoforms: α1–6, β1–3, γ1–3, δ, ε, π, ρ1–3 and Θ [1], [2], [3]. The most common receptors in vivo are likely to be composed of α1, β2 and γ2 subunits [4], [5]. The subunit composition determines the GABA sensitivity and the pharmacological properties of the GABAA receptor [1], [2], [6]. GABAA channels are modulated by numerous structurally distinct substances including clinically important drugs such as benzodiazepines, barbiturates, neurosteroids and various general anaesthetics [1]. The use of the most frequently prescribed benzodiazepines is, however, associated with a number of unwanted side effects such as reduced coordination, cognitive impairment, increased accident proneness and, most importantly, development of dependence and abuse liability [7]. Receptor subtype-selective GABAA ligands that are expected to produce fewer side effects than the benzodiazepines are currently in various stages of preclinical and clinical development [8]. The number of structural templates is, however, limited and systematic screening of alternative sources for drug leads may expand the repertory of structures that could be developed. The occurrence of GABAA receptor ligands is reportedly high in plant extracts [9], and a number of structurally diverse natural products are known to interact with GABAA receptors. Antagonists and channel blockers include compounds such as bicuculline, picrotoxin [10] and thujone [11], but these molecules are only of interest for basic science and not for drug development. The biflavone amentoflavone [12], tetrahydroberberines, and simple flavones [13], [14] have been reported to interact with GABAA receptors. Khom et al. recently reported that valerenic acid, a compound from the roots of Valeriana officinalis, allosterically modulates GABAA receptors exclusively containing β2 or β3 subunits. Chloride currents through receptors (IGABA) incorporating a β1 subunit were not stimulated [15]. These and other data support the existence of natural products with subtype specific action on GABAA receptors [16], [17], [18]. Considering the therapeutic potential of subtype selective GABAA modulators and the few synthetic leads and drug candidates in development, a systematic screening for natural product leads appears worthwhile.
Past efforts for identifying GABAA ligands from plant extracts were scattered and focussed mainly on few compound classes such as flavonoids and alkaloids [14]. Also, classical activity-guided preparative isolation of compounds from an extract tested active is tedious and time-consuming. In contrast, HPLC-based activity profiling combines the speed and separation power of HPLC with structural information of on-line spectroscopy and miniaturized bioassays [19]. We have previously implemented and used this approach for the profiling of plant extracts for various pharmacological targets including cyclooxygenase-2, inducible NO synthase, leukocytic elastase and monoamine oxidase B in cell-based and cell-free assay systems [20], [21], [22].
For the purpose of a medium-throughput search for new GABAA receptor ligands, we here describe the implementation and validation of an efficient profiling approach for plant and fungal extracts which combines HPLC-PDA-MS with an automated functional assay using Xenopus oocytes expressing human GABAA receptors of the desired subtype composition.
Materials and Methods
General experimental procedures
HPLC analysis was carried out with an Alliance™ system (Waters) consisting of a 2695 separation module and a 996 photo-diode array detector. Data acquisition and processing were performed using Empower software (Waters). Microfractionation for profiling was carried out with an HP 1100 series system (Agilent) consisting of a degasser, a quaternary pump, a column oven and a diode array detector. An injection module 819 and a liquid handler 215 (Gilson) were used as autosampler. LC/DAD/ESI-MS analysis was performed on an HP 1100 system consisting of a degasser, a binary mixing pump, a column oven and a diode array detector, which are coupled to an Esquire 3000 Plus ion trap mass spectrometer (Bruker Daltonics). Data acquisition and processing were performed on Hystar 3.0 software (Bruker Daltonics). A SunFire™ C18 (3.5 μm, 3.0 × 150 mm) and a SunFire™ Prep C18 (5 μm, 10 × 150 mm) were used for analytical and semi-preparative HPLC analysis, respectively.
Plant material
Dried roots of Notopterygium incisum were purchased from Yong Quan GmbH. The roots of Valeriana officinalis were obtained from Alfred Galke GmbH. Voucher specimens (00 013 and 00127) are deposited at the herbarium of the Institute of Pharmaceutical Biology, University of Basel.
Extraction
The dried plant samples were ground with a ZM1 mill (Retsch). Extracts for the initial screening were prepared with an ASE 200 extraction system with solvent module (Dionex) by consecutive extraction with dichloromethane, ethyl acetate and methanol. Extraction pressure was 120 bar and temperature was set at 70 °C.
HPLC separation and microfractionation
Microfractionation for activity profiling was performed using a SunFire™ Prep C18 (5 μm, 10 × 150 mm) (Waters). Gradient elution was carried out with acetonitrile containing 0.1 % formic acid (solvent A) and water containing 0.1 % formic acid (solvent B). The flow rate was 7 mL/min. The extracts were dissolved in DMSO at concentrations of 15 mg/mL or 20 mg/mL, and the injection volumes varied between 200 μL and 500 μL.
The EtOAc extract of Notopterygium incisum was separated with the following gradient: 30 % A to 90 % A for 30 min, followed by isocratic condition of 100 % A for 5 min. For activity profiling, aliquots of 200 μL, corresponding to 3 mg of EtOAc extract, were injected. For spiking experiments, 500 μg of magnolol (>98 % purity by HPLC-PDA-ESIMS) was added. The column effluent was collected into test tubes (90 sec per fraction), and a total of 20 fractions was obtained. The solvent was removed with an EZ-2 vacuum evaporator (Genevac). The dry films were redissolved in 1 mL of MeOH, and aliquots of 0.5 mL were dispensed into two vials and dried under N2 gas. As positive control, 500 μg of magnolol alone was separated under the same HPLC condition, and the collected magnolol fraction was divided into two vials after dryness.
The EtOAc extract of Valeriana officinalis was separated using the following condition: 20 % A to 100 % A for 30 min, hold for 5 min. For activity profiling, aliquots of 500 μL, corresponding to 10 mg of EtOAc extract, were injected. Sample work-up was as above.
HPLC analysis of GABA
For experimental details, see Supporting Information
Expression and functional characterization of GABAA receptors
Stage V-VI oocytes from Xenopus laevis were prepared and cRNA injected as previously described by Khom et al. [24]. Female Xenopus laevis (NASCO) were anaesthetised by exposing them for 15 minutes to a 0.2 % MS-222 (methanesulfonate salt of 3-aminobenzoic acid ethyl ester; Sandoz) solution before surgically removing parts of the ovaries. Follicle membranes from isolated oocytes were enzymatically digested with 2 mg/mL collagenase (Type 1A, Sigma). Synthesis of capped off run-off poly (A+) cRNA transcripts was performed from linearized cDNA templates (pCMV vector). One day after enzymatic isolation, the oocytes were injected with 10–50 nL of DEPC-treated water (diethyl pyrocarbonate, Sigma) containing the different cRNAs of α1, β2 and γ2S subunits. Oocytes were stored at 18 °C in ND96 solution [25]. Electrophysiological experiments were performed by the two-electrode voltage clamp method making use of a TURBO TEC 01C amplifier (npi electronic, Tamm) at a holding potential of −70 mV. The bath solution contained 90 mM NaCl, 1 mM KCl, 1 mM MgCl2 · 6H2O, 1 mM CaCl2 and 5 mM HEPES (pH 7.4). The animal experiments were approved by the Austrian Ministry of Education, Science and Culture.
Screening of extract library and profiling for GABAA ligand activity
Fast extract application of neurotransmitters is a conditio sine qua non in studies of ligand-gated ion channels. Hence, receptor desensitisation occurs in the millisecond range and may affect the estimation of the peak of the ionic current [24], [26]. We have, therefore, applied a recently developed automated fast perfusion system of Xenopus oocytes as described by Baburin et al. [27] for the screening of extract library. Stock solutions from the extract library (10 mg/mL in DMSO) were diluted to a concentration of 100 μg/mL with bath solution and then mixed with 1 mM GABA stock solution to effective concentration of GABA inducing 3–10% of the maximal response (EC3–10). 150 μL of this solution were applied to the oocyte in the perfusion chamber. Microfractions collected from the semi-preparative HPLC separations were dissolved in 30 μL DMSO and were mixed with 2.97 mL of bath solution. After addition of GABA solution, it was applied to oocytes at a perfusion speed of 300 μL/sec [27].
Results and Discussion
For screening and subsequent activity profiling of plant extracts we expressed GABAA receptors with the most abundant subunit composition (α1β2γ2S) in Xenopus oocytes. Extracts were applied to the oocytes by means of an automated fast perfusion system during two microelectrode voltage clamp measurements [27]. The assay was first used for the screening of an extract library consisting of 704 plant and fungal extracts. The outcome of this screening guided us in the subsequent development of this protocol. First of all, the number of extracts significantly enhancing chloride currents through GABAA receptors [defined as > 30 % potentiation of IGABA at a test concentration of 100 μg/mL] was high (~6% of extracts tested). Secondly, we also found a number (~2%) of extracts significantly inhibiting IGABA (> 30% at 100 μg/mL). Third, among the samples with stimulating effects were a number of extracts in which we suspected the presence of GABA at concentrations that could lead to false positive response. Taking into account the requirements of the oocyte assay, we designed a protocol for HPLC-profiling of the active extracts, which included semi-preparative separation of 3 to 10 mg of extract on a 10 × 150 mm column with gradient elution, and a time-based fraction collection (90 sec per fraction).
The applicability of the protocol was tested with plant extracts from the screening campaign. They were selected to contain structurally diverse compounds and provide a complex HPLC profile, in order to test the robustness of the assay and the applicability towards an accurate localization of activity. For a first test, we chose an EtOAc extract of Notopterygium incisum (Umbelliferae), which was essentially inactive in the initial extract screening (13.3 ± 7.1 % potentiation of IGABA, n = 3). The HPLC profile of a semi-preparative separation of 3 mg extract is shown in Fig. 2B (grey lines). Fractions of 90 sec were collected, evaporated and tested after reconstitution. The corresponding activity profile is shown above and confirmed the lack of activity [maximal IGABA potentiation (27.4 ± 14.9 %, n = 3) observed in the fraction 9 was not significantly different from zero, Fig. 2A, grey bars]. We then spiked the extract with 500 μg of the known GA-BAA ligand magnolol (1)(Fig. 1) [28] and submitted it again to the microfractionation. The magnolol peak eluted under the given gradient profile at 16.77 min, directly after a UV-absorbing peak of the inactive extract (Fig. 2B, b). The trace shows the chromatograms of extract spiked with 500 μg of the compound (300 μM concentration in the bioassay). The activity profiles are shown above in the same colour code (Fig. 2A, black bars). Comparison of IGABA potentiation by fraction 11 (2038.9 ± 638. 9%, n = 4) of the Notopterygium incisum extract spiked with 500 μg magnolol (see Fig. 2A) and the positive control, 300 μM magnolol (2111.3 ± 659.3%, n = 4, Fig. 2A, a) revealed no significant difference. Typical chloride currents through GABAA receptors in control and during co-application of GABA and fraction 11 (Fig. 2C) and 300 μM magnolol (Fig. 2D) are shown.
Fig. 2.

HPLC-based activity profiling of the EtOAc extract from the roots of Notopterygium incisum and magnolol for GABAA ligand activity. The bar graphs (A) display potentiation of IGABA in% by the fractions collected from a single injection of the original extract of N. incisum (3 mg) (grey bars) and the spiked extract with magnolol (500 μg) (black bars). Magnolol, which is collected from an injection of the same amount under the same chromatographic condition, was used as control (a) for GABAergic activity. The HPLC chromatograms (B) show 20 fractions each which is separated by time-based fractionation (90 sec). A single peak corresponding to magnolol (b) was shown at 16.77 min. (C) Representative current traces recorded from oocytes expressing GABAA receptors composed of α1, β2 and γ2S subunits in the presence of control GABA (EC3–10, single bar) and traces recorded during co-application of GABA EC3–10 and fraction 11 (left column, double bar) or magnolol (300 μM, right column, double bar).
Fig. 1.
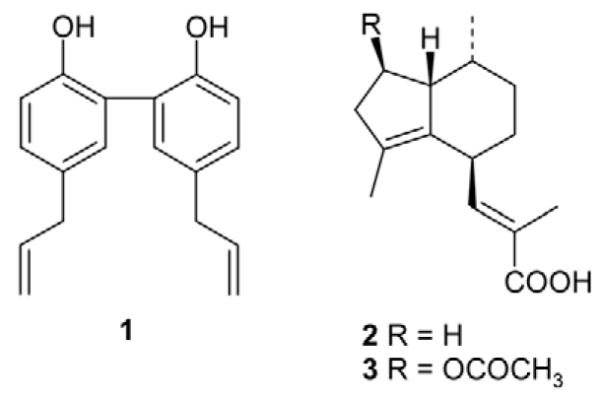
Structures of magnolol (1), valerenic acid (2) and acetoxyva-lerenic acid (3).
As a second example, we selected an extract of Valeriana officinalis (Valerianaceae) containing the subunit specific modulator valerenic acid (2)(Fig. 1) [15], [29]. Besides valerenic acid, extracts contain a range of related diterpenoids, valepotriates and lignans [30], [31]. The HPLC chromatogram of a pharmacologically active EtOAc extract of valerian and the corresponding activity profile are shown in Fig. 3. A major peak of activity (1370.4 ± 199.4% potentiation of IGABA, n=4, Fig. 3A)is seen in the time window 19.50 to 21.00 min, corresponding to the peak of valerenic acid at 19.72 min (Fig. 3B, a). Structurally related acteoxyvalerenic acid (3) (14.95 min, Fig. 3B, b) identified by UV and ESI-MS data recorded on-line, was inactive (24.5 ± 6.3%, n = 4). This finding is in accord with data obtained from isolated compounds [15].
Fig. 3.

HPLC-based activity profiling of the EtOAc extract from the roots of Valeriana officinalis for GABAA ligands. The bar graphs (A) display potentiation of IGABA by the fractions collected from a single injection of valerian extract (10 mg). The HPLC chromatograms (B) show 20 fractions each of which is separated by time-based fractionation (90 sec) after elution of DMSO. The peaks of valerenic acid (a) and acetoxyvalerenic acid (b) were shown at 19.72 min and 14.95 min, respectively.
GABA may occur as the free amino acid in plant and fungal extracts and thus give false positive responses in the bioassay. Hence, an effective strategy for dereplication of GABA-containing active extracts was needed. Non-derivatised GABA itself is difficult to detect in an extract due to the complexity of the matrix, the polarity of the amino acid and its lack of a chromophore. Amino acid mixtures are usually analyzed after derivatisation with o-phthaldialdehyde (OPA) by RP-HPLC and fluorescence detection. First, we tested the conditions for derivatisation and found that 50% aqueous methanol could be used equally well as water for dissolving the extract and the subsequent derivatisation. This point was important in view of the handling of moderately polar extracts which would be poorly soluble in water. As a next step, spiking experiments were carried out with the MeOH extract of Aeonium arboreum that was free of measurable amounts of GABA. A typical chromatogram is shown in Supporting Information (Fig. 1A), together with the chromatogram recorded for the GABA reference. The peak of spiked GABA and reference both eluted at 11.4 min. The calibration curves for derivatisation in water and in 50% aqueous methanol were essentially similar and linear over a wide concentration range (5 μg/mL to 1 mg/mL). The regression curves were y = 849582x–150332 (R2 = 0.9986) and y = 878727x–53529 (R2 = 0.9991) in water and in 50% aqueous methanol, respectively. Limit of detection (LOD) (S/N ≥ 4) and limit of quantification (LOQ) (S/N ≥ 10) were estimated as 0.02 μg on column.
To elucidate if an extract contains interfering GABA we selected two pairs of plant and fungal extracts. GABA content in the extracts was determined by the OPA method (Supporting Information, Fig. 1B and Table 1) as well as compared the IGABA enhancement during co-application of GABA and extract with the chloride current induced by the extract alone (i. e., in the absence of the agonist) (Fig. 4). Potentiation of IGABA (EC3–10) by co-application of the MeOH extract of Cleome amblyocarpa (100 μg/mL) amounted 31.2 ± 8.8 % (n = 4, Fig. 4A, middle trace). In the absence of GABA the extract induced a mean current with an amplitude of 30.8 ± 10.8% of the control IGABA (n = 3, see Fig. 4A, right trace). Correspondingly, a significant GABA concentration (4.54 ± 0.06 mg/g in H2O and 3.93 ± 0.04 mg/g in MeOH extracts) was detected by the OPA method (Supporting Information, Table 1 and Fig. 1B). Similar observations were made for Paecilomyces militaris RCEF 0720 MeOH extract which contained even higher amounts of GABA (~20 mg/g, Supporting Information, Table 1 and Fig. 1B) and induced larger chloride currents (125.6 ± 13.7% of IGABA potentiation (n = 3) vs. 50.9 ± 31.4% of the control IGABA (n = 3) when applied alone, traces not shown).
Fig. 4.
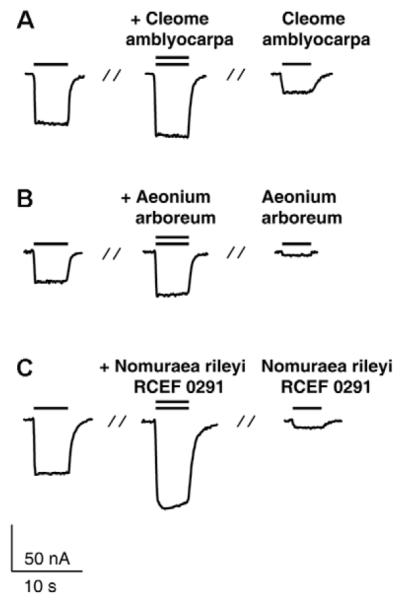
Chloride currents in oocytes expressing GABAA receptors composed of α1, β2 and γ2s subunits induced by GABA (EC3–10, left column), during co-application of GABA EC3–10 and the indicated extract (middle column, double bar) and during application of the extracts alone (right column). The EC3–10 GABA concentrations were 10 μM (A–C).
A low GABA concentration (< 1 mg/g dry extract) was found in an MeOH extract of Aeonium arboreum (Supporting Information, Fig. 1B and Table 1). This extract induced only a small current response (6.4 ± 3.5 % of IGABA control, n = 3) compared to the enhancement of IGABA when the extract was co-applied (49.3 ± 0.7%, n = 3, see Fig. 4B for typical chloride currents). MeOH extracts of Nomuraea rileyi RCEF 0291 (100 μg/mL) potentiated IGABA by 70.9 ± 10.9% (n = 3) when co-applied with GABA. In the absence of GABA the extracts induced mean current amplitudes of 9.4 ± 1.1 % (n = 4) of the control IGABA (see Fig. 4C for corresponding current traces). The small amount of GABA detected in the extract (Supporting Information, Fig. 1B and Table 1) nicely agrees with the induced current. Thus, the enhancement of IGABA by Cleome amblyocarpa and Paecilomyces militaris RCEF 0720 may be explained by the presence of GABA in the extract whereas IGABA enhancement by Aeonium arboreum and Nomuraea rileyi RCEF 0291 was significantly larger than the current response induced by the extracts suggesting the presence of allosteric modulators. It was recently shown that valerenic acid (a GABAA receptor modulator isolated from Valeriana officinalis) induces chloride currents in the absence of the agonist [15]. The current response upon application of an extract in the absence of GABA may, therefore, alternatively indicate the presence of a naturally occurring agonist.
In summary, we have developed and validated an approach for effective screening and prioritization of extracts modulating GABAA receptor activity, dereplication of GABA containing extracts, and for rapid localization and identification of active secondary metabolites via an HPLC-based profiling. The protocol offers significant advantages in terms of speed and information content over previous classical preparative isolation guided by a receptor binding assay. Localization of activity can be performed with a resolution matching that of the HPLC separation. The activity of valerenic acid was easily detected in the oocyte assay, and the lack of IGABA stimulation by acetoxyvalerenic acid and hydroxy-valerenic acid which had been recently shown in a testing of pure compounds, could be confirmed [15].
Our screening of an extract library confirmed previous reports [9] that the hit rate in an extract-based screening for GABAA ligands is high. According to current knowledge, this may be due to the frequent occurrence of GABA in extracts. Therefore, we propose that extracts stimulating chloride currents through GABAA receptors in the absence of GABA are analysed by HPLC for GABA. Derivatisation of GABA with OPA reagent and HPLC analysis with UV detection at 340 nm was sufficiently sensitive for our needs, even though the LOQ (0.2 mg/g GABA in a dry extract) was approx. 100-fold higher than that reported for fluorescence detection. The GABA sensitivity of the oocyte assay depends on the subunit composition (range: 0.1 – 1 μM). In our assay protocol, this concentration corresponds to GABA contents between approximately 0.1 and 1 mg/g GABA in a dry extract. For a rapid dereplication, a semi-quantitative estimation with a single concentration reference corresponding to the maximal tolerable GABA concentration should be sufficient. The detection of extract induced chloride currents and simultaneous detection of significant amounts of GABA by the OPA method will, therefore, help to identify “false positive” responses. Extract induced currents may, however, alternatively indicate the presence of GABAA receptor agonists. We currently use this profiling protocol for the identification of GABAA receptor ligands with scaffolds new for the target.
Supplementary Material
Supporting information available online at http://www.thieme-connect.de/ejournals/toc/plantamedica
Acknowledgement
This work was supported by the Korea Research Foundation Grant funded by the Korean Government (MOEHRD) (Grant No. KRF-2006-352-E00026) and FWF grant 15 914 (to S.H.).
Abbreviations
- GABA
γ-aminobutyric acid
- OPA
o-phthaldialdehyde
References
- 1.Barnard EA, Skolnick P, Olsen RW, Mohler H, Sieghart W, Biggio G, et al. International Union of Pharmacology. XV. Subtypes of γ-aminobutyric acid A receptors: classification on the basis of subunit structure and receptor function. Pharmacol Rev. 1998;50:291–313. [PubMed] [Google Scholar]
- 2.Hevers W, Luddens H. The diversity of GABAA receptors: Pharmacological and electrophysiological properties of GABAA channel subtypes. Mol Neurobiol. 1998;18:35–86. doi: 10.1007/BF02741459. [DOI] [PubMed] [Google Scholar]
- 3.Bonnert TP, McKernan RM, Farrar S, le Bourdellès B, Heavens RP, Smith DW, et al. Θ, a novel γ-aminobutyric acid type A receptor subunit. Proc Natl Acad Sci USA. 1999;96:9891–6. doi: 10.1073/pnas.96.17.9891. [DOI] [PMC free article] [PubMed] [Google Scholar]
- 4.Benke D, Mertens S, Trzeciak A, Gillessen D, Mohler H. GABAA receptors display association of γ2-subunit with α1- and β2/3-subunits. J Biol Chem. 1991;266:4478–83. [PubMed] [Google Scholar]
- 5.Benke D, Fritschy JM, Trzeciak A, Bannwarth W, Mohler H. Distribution, prevalence, and drug binding profile of γ-aminobutyric acid type A receptor subtypes differing in the β-subunit variant. J Biol Chem. 1994;269:27100–7. [PubMed] [Google Scholar]
- 6.Boileau AJ, Baur R, Sharkey LM, Sigel E, Czajkowski C. The relative amount of cRNA coding for γ2 subunits affects stimulating by benzodiazepines in GABAA receptors expressed in Xenopus oocytes. Neuropharmacology. 2002;43:695–700. doi: 10.1016/s0028-3908(02)00036-9. [DOI] [PubMed] [Google Scholar]
- 7.Hobbs WR, Rall TW, Verdoorn TA. In: Goodman and Gilman’s the pharmacological basis of therapeutics. Hardmann J, Limbird L, editors. Columbus: McGraw-Hill Companies Inc.; 1996. pp. 361–98. [Google Scholar]
- 8.Whiting PJ. GABA-A receptors: a viable target for novel anxiolytics? Curr Opin Pharmacol. 2006;6:24–9. doi: 10.1016/j.coph.2005.08.005. [DOI] [PubMed] [Google Scholar]
- 9.Medina JH, Pena C, de Stein M Levi, Wolfman C, Paladini AC. Benzodia-zepine-like molecules, as well as other ligands for the brain benzodiazepine receptors, are relatively common constituents of plants. Biochem Biophys Res Commun. 1989;165:547–53. doi: 10.1016/s0006-291x(89)80001-4. [DOI] [PubMed] [Google Scholar]
- 10.Stephenson FA. The GABAA receptors. Biochem J. 1995;310:1–9. doi: 10.1042/bj3100001. [DOI] [PMC free article] [PubMed] [Google Scholar]
- 11.Höld KM, Sirisoma NS, Ikeda T, Narahashi T, Casida JE. α-Thujone (the active component of absinthe): γ-aminobutyric acid type A receptor modulation and metabolic detoxification. Proc Natl Acad Sci USA. 2000;97:3826–31. doi: 10.1073/pnas.070042397. [DOI] [PMC free article] [PubMed] [Google Scholar]
- 12.Nielsen M, Frokjaer S, Braestrup C. High affinity of the natrually-occurring biflavonoid, amentoflavone, to brain benzodiazepine receptors in vitro. Biochem Pharmacol. 1988;37:3285–7. doi: 10.1016/0006-2952(88)90640-5. [DOI] [PubMed] [Google Scholar]
- 13.Ai J, Dekermendjian K, Wang X, Nielsen M, Witt MR. 6-Methylflavone, a benzodiazepine receptor ligand with antagonistic properties on rat brain and human recombinant GABAA receptors in vitro. Drug Develop Res. 1997;41:99–106. [Google Scholar]
- 14.Tsang SY, Xue H. Development of effective therapeutics targeting the GABAA receptor: naturally occurring alternatives. Curr Pharm Design. 2004;10:1035–44. doi: 10.2174/1381612043452767. [DOI] [PubMed] [Google Scholar]
- 15.Khom S, Baburin I, Timin E, Hohaus A, Trauner G, Kopp B, et al. Valerenic acid potentiates and inhibits GABAA receptors: Molecular mechanism and subunit specificity. Neuropharmacology. 2007;53:178–87. doi: 10.1016/j.neuropharm.2007.04.018. [DOI] [PubMed] [Google Scholar]
- 16.Baur R, Simmen U, Senn M, Séquin U, Sigel E. Novel plant substances acting as β subunit isoform-selective positive allosteric modulators of GABAA receptors. Mol Pharmacol. 2005;68:787–92. doi: 10.1124/mol.105.011882. [DOI] [PubMed] [Google Scholar]
- 17.Huen MS, Hui KM, Leung JW, Sigel E, Baur R, Wong JT, et al. Naturally occurring 2′-hydroxyl-substituted flavonoids as high-affinity benzodiazepine site ligands. Biochem Pharmacol. 2003;66:2397–407. doi: 10.1016/j.bcp.2003.08.016. [DOI] [PubMed] [Google Scholar]
- 18.Hansen RS, Paulsen I, Davis M. Determinants of amentoflavone interaction at the GABAA receptor. Eur J Pharmacol. 2005;519:199–207. doi: 10.1016/j.ejphar.2005.06.036. [DOI] [PubMed] [Google Scholar]
- 19.Potterat O, Hamburger M. Natural products in drug discovery – concepts and approaches for tracking bioactivity. Curr Org Chem. 2006;10:899–920. [Google Scholar]
- 20.Danz H, Stoyanova S, Wippich P, Brattström A, Hamburger M. Identification and isolation of the cyclooxygenase-2 inhibitory principle in Isatis tinctoria. Planta Med. 2001;67:411–6. doi: 10.1055/s-2001-15805. [DOI] [PubMed] [Google Scholar]
- 21.Dittmann K, Gerhäuser C, Klimo K, Hamburger M. HPLC-based activity profiling of Salvia miltiorrhiza for MAO A and iNOS inhibitory activities. Planta Med. 2004;70:909–13. doi: 10.1055/s-2004-832615. [DOI] [PubMed] [Google Scholar]
- 22.Hamburger M, Rüster GU, Melzig MF. HPLC based activity profiling for inhibitors of human neutrophil elastase in Isatis tinctoria leaf extracts. Nat Prod Commun. 2006;1:1107–10. [Google Scholar]
- 23.Moret S, Populin T, Conte LS, Cosens G. HPLC determination of free nitrogenous compounds of Centaurea solstitialis (Asteraceae), the cause of equine nigropallidal encephalomalacia. Toxicon. 2005;46:651–7. doi: 10.1016/j.toxicon.2005.07.006. [DOI] [PubMed] [Google Scholar]
- 24.Khom S, Baburin I, Timin EN, Hohaus A, Sieghart W, Hering S. Pharmacological properties of GABAA receptors containing γ1 subunits. Mol Pharmacol. 2006;69:640–9. doi: 10.1124/mol.105.017236. [DOI] [PubMed] [Google Scholar]
- 25.Methfessel C, Witzemann V, Takahashi T, Mishina M, Numa S, Sakmann B. Patch clamp measurements on Xenopus laevis oocytes: currents through endogenous channels and implanted acetylcholine receptor and sodium channels. Pflugers Arch. 1986;407:577–88. doi: 10.1007/BF00582635. [DOI] [PubMed] [Google Scholar]
- 26.Hering S. Small-volume and rapid extracellular solution exchange around Xenopus oocytes during voltage-clamp recordings. Pflugers Arch. 1998;436:303–7. doi: 10.1007/s004240050636. [DOI] [PubMed] [Google Scholar]
- 27.Baburin I, Beyl S, Hering S. Automated fast perfusion of Xenopus oocytes for drug screening. Pflugers Arch Eur J Physiol. 2006;453:117–23. doi: 10.1007/s00424-006-0125-y. [DOI] [PMC free article] [PubMed] [Google Scholar]
- 28.Squires RF, Ai J, Witt MR, Kahnberg P, Saederup E, Sterner O, et al. Honokiol and magnolol increase the number of [3H]muscimol binding sites three-fold in rat forebrain membranes in vitro using a filtration assay, by allosterically increasing the affinities of low-affinity sites. Neurochem Res. 1999;24:1593–602. doi: 10.1023/a:1021116502548. [DOI] [PubMed] [Google Scholar]
- 29.Yuan C-S, Mehendale S, Xiao Y, Aung HH, Xie JT, Ang-Lee MK. The gamma-aminobutyric acidergic effects of valerian and valerenic acid on rat brainstem neuronal activity. Anesth Analg. 2004;98:353–8. doi: 10.1213/01.ANE.0000096189.70405.A5. [DOI] [PubMed] [Google Scholar]
- 30.Schumacher B, Scholle S, Hölzl J, Khudeir N, Hess S, Müller CE. Lignans isolated from Valerian: Identification and characterization of a new olivil dervivative with partial agonistic activity at A1 adenosine receptors. J Nat Prod. 2002;65:1479–85. doi: 10.1021/np010464q. [DOI] [PubMed] [Google Scholar]
- 31.Navarrete A, Avula B, Choi Y-W, Khan IA. Chemical fingerprinting of Valeriana species: simultaneous determination of valerenic acids, flavonoids, and phenylpropanoids using liquid chromatography with ultraviolet detection. J AOAC Int. 2006;89:8–15. [PubMed] [Google Scholar]
Associated Data
This section collects any data citations, data availability statements, or supplementary materials included in this article.