

Abstract
BACKGROUND
Whole-blood concentrations of Δ9-tetrahydrocannabinol (THC), 11-hydroxy-THC (11-OH-THC), and 11-nor-9-carboxy-THC(THCCOOH)are approximately half of those in plasma due to high plasma protein binding and poor cannabinoid distribution into erythrocytes. Whole blood is frequently the only specimen available in forensic investigations; controlled cannabinoid administration studies provide scientific data for interpretation of cannabinoid tests but usually report plasma concentrations. Whole-blood/plasma cannabinoid ratios from simultaneously collected authentic specimens are rarely reported.
METHODS
We collected whole blood for 7 days from 32 individuals residing on a closed research unit. Part of the whole blood was processed to obtain plasma, and the whole blood and plasma were stored at −20°C until analysis by validated 2-dimensional GC-MS methods.
RESULTS
We measured whole-blood/plasma cannabinoid ratios in 187 specimen pairs. Median (interquartile range) whole-blood/plasma ratios were 0.39 (0.28–0.48) for THC (n = 75), 0.56 (0.43–0.73) for 11-OH-THC (n = 17), and 0.37 (0.24–0.56) for THCCOOH (n = 187). Intrasubject variability was determined for the first time: 18.1%–56.6% CV (THC) and 10.8%–38.2% CV (THCCOOH). The mean whole-blood/plasma THC ratio was significantly lower than the THCCOOH ratio (P = 0.0001; 4 participants’ mean THCCOOH ratios were >0.8).
CONCLUSION
Intra- and intersubject whole-blood/plasma THC and THCCOOH ratios will aid interpretation of whole-blood cannabinoid data.
Cannabis remains the most common illicit substance detected in the blood of drivers apprehended in driving under the influence of drugs (DUID)4 cases and in hospitalized or fatally injured drivers. The primary psychoactive constituent of cannabis, Δ9-tetrahydrocannabinol (THC), is rapidly oxidized to its equipotent metabolite, 11-hydroxy-THC (11-OH-THC). Further oxidation yields the most abundant metabolite found in blood and urine, 11-nor-9-carboxy-THC (THCCOOH). Analytes also may be subject to phase II metabolism, producing glucuronide and sulfate analogs.
Controlled cannabinoid administration studies guide interpretation of cannabinoid concentrations in whole blood. Although most clinical studies report plasma cannabinoids, whole blood often is the only specimen available in forensic investigations and DUID cases. Additionally, most European countries and the Driving under the Influence of Drugs, Alcohol and Medicines (DRUID) project mandate whole blood as the specimen for confirmatory analysis. THC is strongly lipophilic, distributes rapidly to the brain and other highly vascularized tissues, and is efficiently metabolized in the liver. Concentrations are below analytical detection limits within hours after a single acute dose in occasional users (1); daily and prolonged cannabis use may produce extended detection times due to the slow release of THC back into the blood from tissue stores. For THC in blood, ≥1 μg/L is commonly interpreted as indicating recent cannabis exposure; however, recent evidence suggests that >1 μg/L THC may be detected in whole blood in frequent cannabis users for several days after last drug administration (2).
Whole-blood cannabinoid concentrations are approximately 50% of plasma concentrations owing to low distribution into erythrocytes and high plasma protein binding (>90%) (3, 4), although little albumin binding occurred with tritium-labeled THC (5). 11-OH-THC in whole blood is 90% bound to plasma proteins, with only 9% distributed into blood cells (4). The major metabolite THCCOOH and its glucuronide conjugate are 89.9% (12.6%) and 96.7% (2.4%) albumin bound, respectively, with 74.8%–100% total protein binding in authentic serum specimens (6). Although the ratio of cannabinoids in whole blood and plasma is vital to interpret forensic toxicology results and use predictive models of time of last cannabis use (7-9), few data have investigated this important parameter, especially intra- and intersubject variability.
Comparison of whole-blood/plasma cannabinoid ratios has rarely been determined from simultaneously collected specimens. THC whole-blood-to-plasma ratio was 0.46 in simultaneously collected fresh plasma specimens analyzed shortly after collection and whole-blood specimens analyzed after storage for 8 months (10). Whole-blood-to-plasma ratios in 8 subjects after controlled cannabis smoking were 0.66 (0.06), 0.76 (0.14), and 0.61 (0.08) for THC, 11-OH-THC, and THCCOOH, respectively, whereas in postmortem whole-blood and serum specimens collected at autopsy, cannabinoid ratios were <0.52 for all analytes (11).
Based on the scarcity of data on the disposition of cannabinoids in whole blood and plasma, we developed a selective and robust method with an adequate limit of quantification (LOQ) for monitoring THC, 11-OH-THC, and THCCOOH in plasma and whole-blood specimens. Two-dimensional (2D) GC-MS offers advantages over 1-dimensional systems for detection of drugs in complex matrices. Our laboratory recently published a 2D GC-MS method for THC, 11-OH-THC, and THCCOOH in plasma (12).
We present a method modification and full validation for simultaneous quantification of these 3 cannabinoids in whole blood after solid-phase extraction (SPE) and 2D electron impact (EI) GC-MS with cryofocusing. We also evaluated the assay with postmortem specimens collected at autopsy to assess method robustness for cannabinoid quantification in this highly complex matrix, and we analyzed whole-blood and associated plasma specimens from frequent cannabis users. We collected multiple paired specimens from the same individuals to evaluate intrasubject variability in whole-blood/plasma ratios at varying times after cannabinoid administration and from multiple volunteers to determine inter subject variability.
Materials and Methods
CHEMICALS AND REAGENTS
We purchased calibrators and deuterated internal standards from Cerilliant, Clean Screen® ZSTHC020 SPE columns from United Chemical Technologies, and methanol, acetonitrile, hexane, ethyl acetate, concentrated HCl, ethanol, anhydrous sodium acetate, di- and monobasic potassium phosphate, and sodium hydroxide from Mallinckrodt Baker. Organic solvents were HPLC grade. We obtained N,Obis(trimethylsilyl)trifluoro-acetamide (BSTFA) with 1% trimethylchlorosilane (TMCS) from Pierce Biotechnology and blank whole blood (verified negative for cannabinoids) from the NIH Clinical Center.
Working solutions of 10, 100, or 1000 μg/L THC, 11-OH-THC and THCCOOH in methanol were created for preparation of fortified calibrators. Working solutions of 10, 100, or 1000 μg/L of all analytes in methanol were created for preparation of fortified QC solutions (prepared from stock solutions of different lots than calibrators). The working internal standard solution contained 200 μg/L THC-d3, 11-OH-THC-d3 and THCCOOH-d3. Standard solutions were stored in amber vials at −20°C.
EXTRACTION
We pipetted blank whole blood (1 mL) into 10-mL culture tubes to which working calibrator solutions were added to produce final calibrator concentrations of 0.25, 0.5, 1.0, 2.5, 5, 10, 25, 50, 75, and 100 μg/L. We added working QC solutions to produce final QC samples of 0.35, 2.0, 20, 30, 60, and 90 μg/L, and we analyzed QC samples in duplicate in each batch. We added 25 μL internal standard (5 ng) and 1 mL potassium phosphate buffer (pH 6.8). Whole-blood proteins were precipitated with 3 mL cold acetonitrile, added in 0.5-mL increments while vortex-mixing. After centrifugation, we decanted the supernatants into clean 10-mL culture tubes containing 5 mL 2.0 mol/L sodium acetate buffer. Extraction columns were conditioned with 1mL elution solvent (hexane:ethyl acetate, 80:20 by volume), 3 mL methanol, 3 mL deionized water, and 2 mL 0.1 mol/L HCL; the supernatants were added to columns under gravity flow. Columns were washed with 3 mL deionized water followed by 2 mL 0.1 mol/L HCl:acetonitrile (70:30) and dried under vacuum for 15 min. We added 0.5 mL 100% ethanol to 15-mL conical centrifuge tubes, positioned columns above tubes, and primed column beds with 0.2 mL hexane. Analytes were eluted under gravity flow with 3 mL elution solvent followed by a further 2 mL elution solvent. Samples were evaporated to dryness under nitrogen, derivatized with 25 μL BSTFA + 1% TMCS at 70°C for 40 min, and transferred to GC-MS autosampler vials.
INSTRUMENTATION
We injected extracts (3 μL in splitless mode) onto an Agilent 6890 GC–flame ionization detector/5973 mass selective detector, modified with a microfluidic Deans switch (Agilent Technologies) and cryogenic focusing device (cryotrap; Joint Analytical Systems). Helium was the carrier gas. Primary and secondary capillary columns were DB-1MS (15 m by 0.25 mm i.d. by 0.25 μm film thickness; Agilent Technologies) and ZB-50 (30 m by 0.32 mm i.d. by 0.25 μm film thickness; Phenomenex), respectively. Two-dimensional chromatography flow rates, heart cuts, cryofocusing parameters, postrun back flushing, and primary column retention times are reported elsewhere (12). Flow was diverted to the secondary column (heart cuts) at approximately 6.3– 6.6, 7.2–7.5, and 7.9–8.2 min for THC, 11-OH-THC, and THCCOOH, respectively. Initial oven temperature was 150°C, ramped at 25°C/min to 200°C, held for 0.5 min, ramped at 15°C/min to 275°C, and held for 8 min. Ions monitored were as follows [target and qualifier(s) m/z]: 389, 374 for THC-d3; 386, 371, and 303 for THC; 374 and 462 for 11-OH-THC-d3; 371, 474, and 459 for 11-OH-THC; 374 and 491 for THCCOOH-d3; and 371, 488, and 473 for THCCOOH.
We identified compounds based on relative retention times (±2% of calibrators) and the presence of quantification and qualifier ions. Acceptable qualifier ion ratios were ±20% of average calibrator ratios. The calibration curve was split (low and high; Table 1) to apply a linear model at both low and high concentrations. We constructed calibration curves using linear regression with 1/x weighting and quantified analytes by native target ion abundances relative to internal standard ion abundances. Calibrators were recalculated against the calibration curve and required to quantify within 20% of target concentration.
Table 1.
LOQ, mean slope (SD), mean intercept (SD), r2 range, and linear range (n = 10) for low and high calibration curves for THC, 11-OH-THC, and THCCOOH in whole blood by SPE and 2D electron impact GC-MS.
| Compound | LOQ, μg/L | Curve | Mean slope (SD) | Mean intercept (SD) | r2, range | Linear range, μg/L |
|---|---|---|---|---|---|---|
| THC | 0.25 | Low | 0.171 (0.013) | 0.005 (0.004) | 0.995–1.000 | 0.25–25 |
| High | 0.137 (0.014) | 0.590 (0.558) | 0.995–1.000 | 25–100 | ||
| 11-OH-THC | 0.5 | Low | 0.183 (0.013) | 0.009 (0.005) | 0.994–0.999 | 0.5–25 |
| High | 0.121 (0.013) | 1.271 (0.395) | 0.991–1.000 | 10–75 | ||
| THCCOOH | 0.25 | Low | 0.191 (0.013) | 0.004 (0.003) | 0.996–1.000 | 0.25–25 |
| High | 0.149 (0.016) | 0.814 (0.623) | 0.992–1.000 | 25–100 |
METHOD VALIDATION
Plasma cannabinoid method development and validation have been reported (12). We validated the whole-blood method for analytical recovery, limit of detection (LOD) and LOQ, intra- and interassay imprecision, specificity, linearity, extraction efficiency, and stability. We determined analytical recovery (acceptable within 80%–120% of target concentration) and intra- and interassay imprecision (acceptable if <20% CV) from triplicate quality control samples at 2, 10, 30, and 60 μg/L from 4 separate batches. We evaluated 21 illicit, over-the-counter (OTC), and prescription drugs for interference by fortifying 0.25 μg/L calibrators with 10 mg/L of each compound and cannabinol and cannabidiol at 100 μg/L (Supplemental Table 1, which accompanies the online version of this article at http://www.clinchem.org/content/vol55/issue6), and we evaluated 6 blank whole-blood pools obtained from the NIH blood bank for endogenous interferences. We considered a lack of interference if quantification of analytes in the 0.25 μg/L calibrator (LOQ) was within 20% of target.
We determined extraction efficiency by comparing the ratio of analyte/internal standard target ion abundances when analytes were added before and after SPE [(extracted target abundance/extracted internal standard abundance)/(unextracted target abundance/extracted internal standard abundance) × 100]. We measured cannabinoid stability in whole blood stored at −20°C, 4°C, and room temperature by analysis of triplicate whole-blood pooled samples (prepared on day 0) on days 1 (baseline), 3, 7, and 14 after preparation. Pools were fortified with methanolic cannabinoids (30–300 μL), vortex-mixed for 1 min, aliquoted into polypropylene cryotubes, and stored at the appropriate temperature until analysis. Freeze-thaw stability was determined from 3 replicates each of quality control concentrations after 3 freeze-thaw cycles. Cannabinoids were considered stable if the quantified analyte concentration was within 20% of target.
CLINICAL SPECIMENS
Thirty-two frequent cannabis users (age 19–38 years, 50% male, 84% African American) provided written informed consent for this institutional review board–approved study and resided on a closed clinical research unit for 7 days of monitored abstinence. Whole blood (3 mL) was collected in Vacutainer tubes (Becton Dickinson) containing sodium heparin anticoagulant. A second whole-blood specimen was collected at the same time and centrifuged for 10 min at 2500g to separate plasma from erythrocytes within 2 h of collection, and plasma was removed for future analysis. We obtained whole-blood and plasma specimens simultaneously from each individual upon unit admission and every 24 h for 6 days thereafter. Specimens were transferred to polypropylene cryotubes and stored at −20°C before analysis.
Postmortem (n = 24) peripheral whole-blood specimens (verified cannabinoid positive) were collected at autopsy according to approved procedures at a median of 2 days (range 0–6) after death. Whole blood was collected in gray-top Vacutainer tubes containing sodium fluoride and potassium oxalate and stored at 4°C for approximately 2 weeks. After initial screening and confirmation, specimens were transferred to long-term storage at −20°C for a median of 523 (340–647) days, thawed, aliquoted into polypropylene cryotubes, and refrozen until analysis by 2D GC-MS.
STATISTICAL ANALYSES
We calculated estimates of imprecision using triplicate QC concentrations (1, 10, 30, and 60 μg/L) from 4 analytical runs according to Krouwer and Rabinowitz (13). The difference between THC and THCCOOH whole-blood/plasma ratios (n = 75 pairs) was determined using a paired t-test (α = 0.05). One-way ANOVA (participant as grouping variable) determined significant differences (α = 0.05) between harmonic mean (adopted because of unequal group sizes, n = 3–7 ratios) whole-blood/plasma cannabinoid ratios among 13 participants.
Results
MATERIALS AND METHOD DEVELOPMENT AND VALIDATION
2D GC-MS of cannabinoids in whole blood was optimized for the primary DB-1 and secondary ZB-50 columns. Qualifier ion peak abundances were more consistent with this column combination, improving quantification at low concentrations. 11-OH-THC was always quantified with the low calibration curve, as all quantifications were <10 μg/L. Coefficients of determination (r2) were always >0.990.
LOD and LOQ were empirically determined by assaying decreasing analyte concentrations. LOD was the lowest calibrator concentration, with acceptable chromatography, retention time within 2% of calibrator mean, acceptable qualifier ion ratios, and signal-to-noise ratio >3:1. LOQ was the lowest calibrator meeting LOD criteria and quantifying within 20% of target. LOD and LOQ were 0.25 μg/L for THC and THCCOOH and 0.5 μg/L for 11-OH-THC (Fig. 1A; Table 1).
Fig. 1. Ion chromatograms for THC, 11-OH-THC, and THCCOOH extracted from whole blood by SPE followed by 2D GC-MS with cryofocusing.
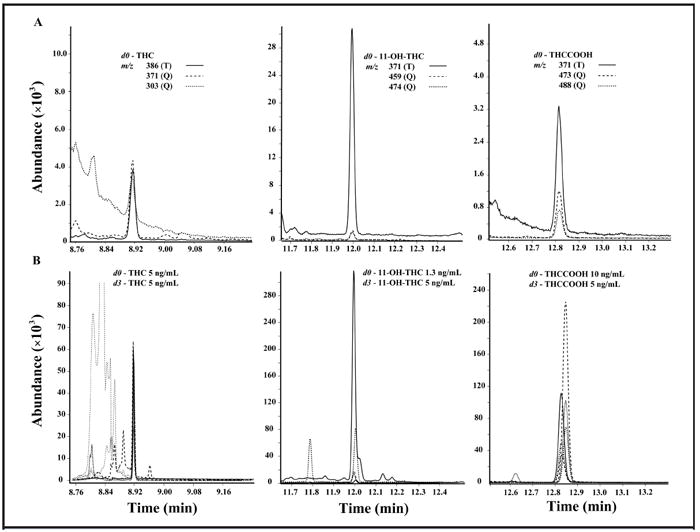
(A), Target (T) and qualifier (Q) ions at the method’s LOQ (0.25 μg/L THC and THCCOOH; 0.5 μg/L 11-OH-THC). (B), A typical chromatogram from postmortem whole blood.
Intra- and interassay imprecision and analytical recoveries met acceptability criteria (Table 2). Extraction efficiencies (Table 3) were determined at 3 concentrations (2, 20, and 40 μg/L) in triplicate and were sufficient to achieve a low LOQ.
Table 2.
Imprecision (CV) and percent analytical recovery of THC, 11-OH-THC, and THCCOOH in whole blood by SPE 2D electron impact GC-MS.a
| Compound and QC concentration, μg/L | Pooled intraassay CV | Interassay CV | Total CV | Analytical recovery, % |
|---|---|---|---|---|
| THC | ||||
| 1 | 3.4 | 5.2 | 6.2 | 90.8 |
| 10 | 3.1 | 2.6 | 4.0 | 85.0 |
| 30 | 2.5 | 4.0 | 4.7 | 91.7 |
| 60 | 3.1 | 5.4 | 6.2 | 94.4 |
| 11-OH-THC | ||||
| 1 | 2.2 | 5.4 | 5.9 | 97.5 |
| 10 | 3.0 | 8.1 | 8.6 | 91.3 |
| 30 | 3.1 | 7.4 | 8.0 | 95.1 |
| 60 | 3.2 | 7.8 | 8.4 | 101.4 |
| THCCOOH | ||||
| 1 | 3.9 | 11.6 | 12.2 | 97.5 |
| 10 | 2.4 | 12.6 | 12.8 | 92.6 |
| 30 | 2.1 | 6.7 | 7.1 | 95.4 |
| 60 | 2.4 | 9.3 | 9.6 | 99.6 |
Triplicate QC samples at 4 concentrations were extracted and analyzed in 4 separate batches.
Table 3.
Extraction efficiency.a
| Extraction efficiency, % | |||
|---|---|---|---|
| 2 μg/L | 20 μg/L | 40 μg/L | |
| THC | 39.4 | 40.7 | 43.8 |
| 11-OH-THC | 73.6 | 74.3 | 76.0 |
| THCCOOH | 79.4 | 79.4 | 82.7 |
Triplicate whole blood samples were fortified with 2, 20, and 40 μg/L THC, 11-OH-THC, and THCCOOH. Cannabinoids were extracted by SPE followed by 2D electron impact GC-MS. Extraction efficiency was determined from analyte target ion relative to internal standard compared to abundances obtained when analytes were added after SPE.
No interference was detected from 21 common illicit, OTC, or prescription medications or cannabinol and cannabidiol at the assay LOQ; analyte concentrations fortified at 0.25 μg/L were always within 20% of target. Matrix interference from endogenous compounds in 6 whole-blood pools was less than the LOQ for all 3 cannabinoids.
We evaluated potential matrix interference by analysis of 24 postmortem whole-blood specimens (verified cannabinoid positive) (Fig. 1B). Matrix interference from putrefactive or in vitro breakdown products markedly affected chromatography in some specimens analyzed 11–22 months after collection. THC was quantifiable in 19 (82.6%), 11-OH-THC in 10 (43.5%), and THCCOOH in 22 (95.7%) specimens. Quantification of 11-OH-THC was not possible in 13 of 24 specimens, owing to substantial endogenous interference with 11-OH-THC-d3 target ion m/z 374. One specimen could not be adequately extracted.
Cannabinoid stability in whole blood stored for 2 weeks at −20°C, 4°C, and room temperature is shown in Fig. 2. At −20°C and room temperature, all analytes decreased by more than 20%; storage at 4°C for 2 weeks yielded results within 20% of target. All cannabinoids quantified within 20% of target after 3 24-h freeze/thaw cycles.
Fig. 2. Stability of THC, 11-OH-THC, and THCCOOH in whole blood stored in polypropylene cryotubes at −20°C (A), room temperature (B), and 4°C (C).
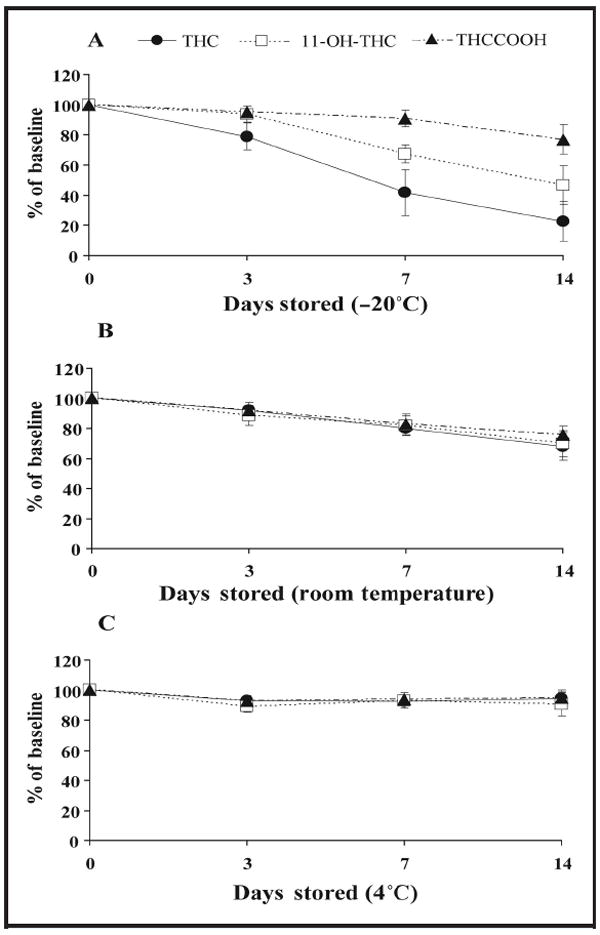
Whole-blood pools (0.35, 1, 2, 5, 10, 20, 30, or 60 μg/L) were prepared in triplicate on day 0, extracted by SPE, and analyzed by 2D GC-MS with cryofocusing 1 (baseline), 3, 7, and 14 days later. Data points are means of all QC samples for Fig. 1A (n = 24) and concentrations 1, 10, 30, and 60 μg/L for Fig. 1, B and C (n = 12).
WHOLE BLOOD/PLASMA RATIOS
We measured whole-blood/plasma cannabinoid ratios in 187 paired whole-blood and plasma specimens from 32 frequent cannabis users. Overall median ratios (interquartile ranges) were 0.39 (0.28–0.48) for THC (n = 75), 0.53 (0.43– 0.73) for 11-OH-THC (n = 17), and 0.37 (0.24–0.56) for THCCOOH (n =187). THC and THCCOOH intrasubject ratio variability in 13 participants with 3–7 positive specimens over 7 days are presented in Fig. 3A and B. One-way ANOVA revealed significant differences in (harmonic) mean whole-blood/plasma ratios among the 13 participants for THC (P = 0.003) and THCCOOH (P = 0.0001). THC intra- and intersubject variances were 0.14 and 0.09, respectively; for THCCOOH, 0.14 and 0.28. Insufficient data were available for 11-OH-THC intrasubject ratio variability. A paired samples t-test (α = 0.05) revealed that the whole-blood/plasma THC ratio was significantly lower than the corresponding THCCOOH ratio (P = 0.0001). Four of 13 participants’ mean THCCOOH ratios (n =7 each) were >0.8.
Fig. 3. Intrasubject whole-blood (WB)/plasma (PL) ratio variability in 13 frequent cannabis users positive for THC (A) and THCCOOH (B).
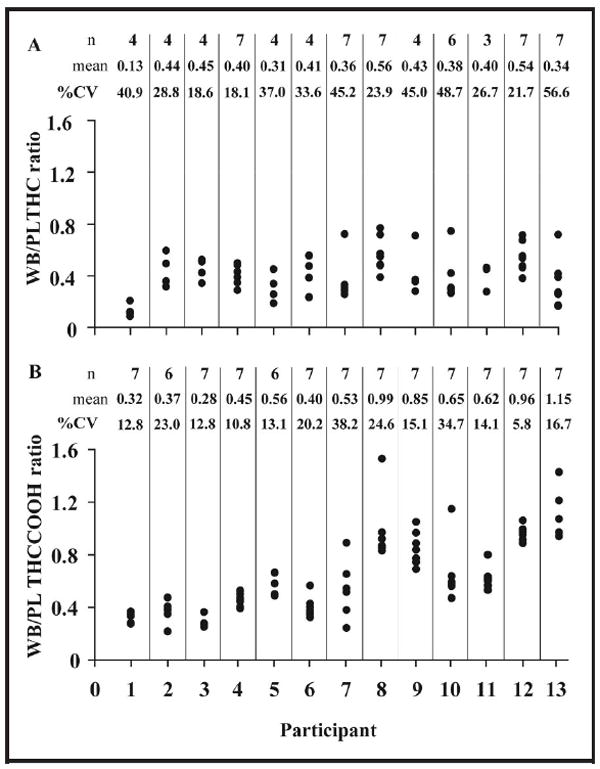
Cannabinoids were determined by SPE followed by 2D-GC-MS with cryofocusing in whole blood and plasma collected simultaneously from frequent cannabis users during 7 days of monitored abstinence.
Discussion
Low LOD and LOQ were achieved by improved chromatographic separation of cannabinoids from endogenous interferences in whole-blood matrix, yielding an improved signal-to-noise ratio. 2D GC-MS only recently was applied to cannabinoid analyses in hair (14), oral fluid (15), meconium (16), and whole blood (17). Methods with low LOD/LOQ are necessary, particularly for THC in whole blood, because clinically relevant concentrations are frequently <2 μg/L, and chromatographic separation of cannabinoids from endogenous interferences is challenging.
It is unclear whether poor stability of cannabinoids during storage results from chemical degradation or whether compounds become irreversibly bound to container surfaces or whole-blood precipitate. THC has a pKa of 10.6, is thermally labile, and is degraded in acidic conditions (18). Whole-blood pH was not measured before analysis, so it is unknown whether low pH could have affected compound stability; however, pH is unlikely to have changed during storage at −20°C. Binding to container surfaces occurs via hydrophobic interactions (19) but also is reversed by extraction with ethanol (20). In this study, whole blood was aliquoted from storage tubes, so disruption of container surface binding with organic solvents was not possible. Plasma cannabinoids were reported stable for 30 days at −20°C (21) and up to 6 months at −10°C and 4°C (22). Stability in whole blood is variable, depending on storage time, temperature, and container type (19, 22-24). In this study, specimens were collected in green-top Vacutainer tubes containing EDTA anticoagulant and transferred to polypropylene cryotubes for long-term storage at −20°C. We found poor stability of fortified cannabinoids at −20°C and room temperature; when stored at 4°C, however, cannabinoids were stable for 2 weeks. To our knowledge, this is the first published report of this finding and the first to describe whole-blood stability in polypropylene containers. Instability during frozen storage possibly could result from cannabinoid binding to denatured proteins and/or adsorption to container surfaces. At room temperature, analytes also may degrade, bind to denatured proteins, or adsorb to container surfaces. Comparative stability at 4°C possibly may result because whole-blood proteins remain intact, analyte degradation is less likely, and plasma protein binding may prevent adsorption to polypropylene. All specimens were stored in polypropylene up to 6 years at −20°C before analysis. Polypropylene cryotubes were selected because of durability at −20°C; however, unbound THCCOOH in urine readily adsorbs to polypropylene, with losses of up to 5.0 (0.6) ng/cm2 after equilibration at room temperature (19).
Data on ratio variability between subjects are lacking. In paired authentic whole-blood and plasma specimens from 8 cannabis users, ratios were 0.66 (0.06) (9.7% CV), 0.76 (0.14) (18.1% CV), and 0.61 (0.08) (13.5% CV) for THC (n = 7), 11-OH-THC (n = 4), and THCCOOH (n = 8), respectively (11). Higher CVs for THC and THCCOOH were found in 6 whole-blood and serum specimen pairs collected at autopsy. THC (n = 6), 11-OH-THC (n = 4), and THCCOOH (n = 6) ratios were 0.48 (0.10) (22% CV), 0.52 (0.20) (38% CV), and 0.41 (0.14) (34% CV). Higher CVs were observed in the present study; 0.39 (0.17) (n = 75, 42% CV), 0.55 (0.22) (n = 17, 40% CV), and 0.45 (0.29) (n = 187, 64% CV) for THC, 11-OH-THC and THCCOOH.
To our knowledge, these are the first data on intrasubject whole-blood/plasma cannabinoid ratio variability. High intrasubject ratio variability was observed, most likely caused by irrecoverable cannabinoids due to binding to whole-blood precipitate or container surfaces and chemical degradation of analytes during storage. Differences in hematocrit could also contribute to intrasubject variability, but it is doubtful that hematocrit would vary considerably within a week. Significant differences in whole-blood/plasma cannabinoid ratios among 13 participants suggest variable in vivo protein binding and/or variable in vitro binding to container surfaces or protein precipitate. Several participants’ mean THCCOOH ratios were >0.8, indicating possible loss of this analyte from plasma or its increase in whole blood during storage. An increase in plasma THCCOOH was found when specimens containing THCCOOH-glucuronide were stored at 4, 20, and 40°C but was not detected when specimens were stored at −20°C for 10 days (25). It is possible that THCCOOH-glucuronide is less stable in whole blood than plasma during long-term frozen storage, leading to increased whole-blood/plasma THCCOOH ratios in some specimens.
Whole-blood/plasma cannabinoid ratios determined from paired authentic specimens are vital for interpretation of forensic toxicology results and employing predictive models of time of last cannabis use (7-9). Considering such high intrasubject variability, estimations of time of cannabis exposure from conversion of whole-blood to plasma concentrations in aged specimens is not recommended. Further studies using refrigerated whole blood and plasma analyzed shortly after collection are warranted. Additionally, studies on cannabinoid stability in authentic whole-blood and plasma specimens would improve interpretation of concentrations obtained after long-term storage. Despite these limitations, these whole-blood/plasma cannabinoid ratios provide new data on intra- and intersubject variability and are useful for interpretation of forensic whole-blood cannabinoid results in similarly stored specimens.
Supplementary Material
Acknowledgments
This research was funded and approved by the Intramural Research Program of the National Institute on Drug Abuse, NIH.
Employment or Leadership: None declared.
Consultant or Advisory Role: None declared.
Stock Ownership: None declared.
Honoraria: None declared.
Research Funding: None declared.
Expert Testimony: E.W. Schwilke, Washington State Superior Court.
Role of Sponsor: The funding organizations played a direct role in the design of study, choice of enrolled patients, review and interpretation of data, and preparation and approval of manuscript.
Footnotes
Author Contributions: All authors confirmed they have contributed to the intellectual content of this paper and have met the following 3 requirements: (a) significant contributions to the conception and design, acquisition of data, or analysis and interpretation of data; (b) drafting or revising the article for intellectual content; and (c) final approval of the published article.
Nonstandard abbreviations: DUID, driving under the influence of drugs; THC, Δ9-tetrahydrocannabinol; 11-OH-THC, 11-hydroxy-THC; THCCOOH, 11-nor-9-carboxy-THC; DRUID, Driving under the Influence of Drugs, Alcohol and Medicines; LOQ, limit of quantification; 2D, 2-dimensional; SPE, solid-phase extraction; EI, electron impact; BSTFA, N,O-bis(trimethylsilyl)trifluoro-acetamide; TMCS, trimethylchlorosilane; LOD, limit of detection; OTC, over-the-counter.
Authors’ Disclosures of Potential Conflicts of Interest: Upon manuscript submission, all authors completed the Disclosures of Potential Conflict of Interest form. Potential conflicts of interest:
References
- 1.Huestis MA, Henningfield JE, Cone EJ. Blood cannabinoids. I. Absorption of THC and formation of 11-OH-THC and THCCOOH during and after smoking marijuana. J Anal Toxicol. 1992;16:276–82. doi: 10.1093/jat/16.5.276. [DOI] [PubMed] [Google Scholar]
- 2.Schwilke EW, Karschner EL, Lowe RH, Darwin WD, Huestis MA. Whole blood cannabinoids in daily cannabis users during seven days of monitored abstinence. Society of Forensic Toxicologists annual meeting; 2007 Oct 15-19; Durham, NC. Abstract nr S23. [Google Scholar]
- 3.McCallum NK, Eastwood ME. In vivo binding of Delta 1-tetrahydrocannabinol and cannabinol to rat serum proteins. J Pharm Pharmacol. 1978;30:384–6. doi: 10.1111/j.2042-7158.1978.tb13265.x. [DOI] [PubMed] [Google Scholar]
- 4.Widman M, Agurell S, Ehrnebo M, Jones G. Binding of (+)- and (−)-delta-1-tetrahydrocannabinols and (−)-7-hydroxy-delta-1-tetrahydrocannabinol to blood cells and plasma proteins in man. J Pharm Pharmacol. 1974;26:914–6. doi: 10.1111/j.2042-7158.1974.tb09207.x. [DOI] [PubMed] [Google Scholar]
- 5.Wahlqvist M, Nilsson IM, Sandberg F, Agurell S. Binding of Delta-1-tetrahydrocannabinol to human plasma proteins. Biochem Pharmacol. 1970;19:2579–84. doi: 10.1016/0006-2952(70)90007-9. [DOI] [PubMed] [Google Scholar]
- 6.Skopp G, Potsch L, Mauden M, Richter B. Partition coefficient, blood to plasma ratio, protein binding and short-term stability of 11-nor-Delta(9)-carboxy tetrahydrocannabinol glucuronide. Forensic Sci Int. 2002;126:17–23. doi: 10.1016/s0379-0738(02)00023-3. [DOI] [PubMed] [Google Scholar]
- 7.Huestis MA, Henningfield JE, Cone EJ. Blood cannabinoids. II. Models for the prediction of time of marijuana exposure from plasma concentrations of Delta-9-tetrahydrocannabinol (THC) and 11-nor-9-carboxy-Delta-9-tetrahydrocannabinol (THCCOOH) J Anal Toxicol. 1992;16:283–90. doi: 10.1093/jat/16.5.283. [DOI] [PubMed] [Google Scholar]
- 8.Huestis MA, Barnes A, Smith ML. Estimating the time of last cannabis use from plasma Delta9-tetrahydrocannabinol and 11-nor-9-carboxy-Delta9-tetrahydrocannabinol concentrations. Clin Chem. 2005;51:2289–95. doi: 10.1373/clinchem.2005.056838. [DOI] [PubMed] [Google Scholar]
- 9.Huestis MA, Elsohly M, Nebro W, Barnes A, Gustafson RA, Smith ML. Estimating time of last oral ingestion of cannabis from plasma THC and THCCOOH concentrations. Ther Drug Monit. 2006;28:540–4. doi: 10.1097/00007691-200608000-00009. [DOI] [PubMed] [Google Scholar]
- 10.Owens SM, McBay AJ, Reisner HM, Perez-Reyes M. 125I radioimmunoassay of Delta-9-tetrahydrocannabinol in blood and plasma with a solid-phase second-antibody separation method. Clin Chem. 1981;27:619–24. [PubMed] [Google Scholar]
- 11.Giroud C, Menetrey A, Augsburger M, Buclin T, Sanchez-Mazas P, Mangin P. Delta9-THC, 11-OH-Delta9-THC and Delta9-THCCOOH plasma or serum to whole blood concentrations distribution ratios in blood samples taken from living and dead people. Forensic Sci Int. 2001;123:159–64. doi: 10.1016/s0379-0738(01)00538-2. [DOI] [PubMed] [Google Scholar]
- 12.Lowe RH, Karschner EL, Schwilke EW, Barnes AJ, Huestis MA. Simultaneous quantification of Delta-9-tetrahydrocannabinol (THC), 11-hydroxy-Delta-9-tetrahydrocannabinol (11-OH-THC), and 11-nor-Delta-9-tetrahydrocannabinol-9-carboxylic acid (THCCOOH)in human plasma using two-dimensional gas chromatography, cryofocusing, and electron impact-mass spectrometry. J Chromatogr A. 2007;1163:318–27. doi: 10.1016/j.chroma.2007.06.069. [DOI] [PMC free article] [PubMed] [Google Scholar]
- 13.Krouwer JS, Rabinowitz R. How to improve estimates of imprecision. Clin Chem. 1984;30:290–2. [PubMed] [Google Scholar]
- 14.Moore C, Rana S, Coulter C, Feyerherm F, Prest H. Application of two-dimensional gas chromatography with electron capture chemical ionization mass spectrometry to the detection of 11-nor-Delta9-tetrahydrocannabinol-9-carboxylic acid (THC-COOH) in hair. J Anal Toxicol. 2006;30:171–7. doi: 10.1093/jat/30.3.171. [DOI] [PubMed] [Google Scholar]
- 15.Moore C, Coulter C, Rana S, Vincent M, Soares J. Analytical procedure for the determination of the marijuana metabolite 11-nor-Delta9-tetrahydrocannabinol-9-carboxylic acid in oral fluid specimens. J Anal Toxicol. 2006;30:409–12. doi: 10.1093/jat/30.7.409. [DOI] [PubMed] [Google Scholar]
- 16.Marin SJ, Coles R, Urry FM, McMillin GA. Confirmation of cannabinoids in meconium using two-dimensional gas chromatography with mass spectrometry detection. J Chromatogr B. 2007;858:59–64. doi: 10.1016/j.jchromb.2007.08.026. [DOI] [PubMed] [Google Scholar]
- 17.Scurlock RD, Ohlson GB, Worthen DK. The detection of Delta9-tetrahydrocannabinol (THC) and 11-nor-9-carboxy-Delta9-tetrahydrocannabinol (THCA) in whole blood using two-dimensional gas chromatography and EI-mass spectrometry. J Anal Toxicol. 2006;30:262–6. doi: 10.1093/jat/30.4.262. [DOI] [PubMed] [Google Scholar]
- 18.Agurell S, Halldin M, Lindgren JE, Ohlsson A, Widman M, Gillespie H, Hollister L. Pharmacokinetics and metabolism of Delta-tetrahydrocannabinol and other cannabinoids with emphasis on man. Pharmacol Rev. 1986;38:21–43. [PubMed] [Google Scholar]
- 19.Roth KDW, Siegel NA, Johnson RW, Litauszki L, Salvati L, Jr, Harrington CA, Wray LK. Investigation of the effects of solution composition and container material type on the loss of 11-nor-Delta-9-THC-9-carboxylic acid. J Anal Toxicol. 1996;20:291–300. doi: 10.1093/jat/20.5.291. [DOI] [PubMed] [Google Scholar]
- 20.Blanc JA, Manneh VA, Ernst R, Berger DE, de Keczer SA, Chase C, et al. Adsorption losses from urine-bases cannabinoid calibrators during routine use. Clin Chem. 1993;39:1705–17. [PubMed] [Google Scholar]
- 21.Schwilke EW, Karschner EL, Lowe RH, Darwin WD, Huestis MA. Whole blood/plasma cannabinoid ratios in daily cannabis users after multiple years of frozen storage. Washington, DC: American Association of Forensic Sciences; 2008. p. K55. [Google Scholar]
- 22.Johnson JR, Jennison TA, Peat MA, Foltz RL. Stability of Delta-9-tetrahydrocannabinol (THC), 11-hydroxy-THC, and 11-nor-9-carboxy-THC in blood and plasma. J Anal Toxicol. 1984;8:202–4. doi: 10.1093/jat/8.5.202. [DOI] [PubMed] [Google Scholar]
- 23.Wong AS, Orbanosky MW, Reeve VC, Beede JD. Anal Cannabinoids Res Monogr. Rockville, MD: National Institute on Drug Abuse; 1982. Stability of Delta-9-tetrahydrocannabinol in stored blood and serum; pp. 119–24. [PubMed] [Google Scholar]
- 24.Christophersen AS. Tetrahydrocannabinol stability in whole blood: plastic versus glass containers. J Anal Toxicol. 1986;10:129–31. doi: 10.1093/jat/10.4.129. [DOI] [PubMed] [Google Scholar]
- 25.Skopp G, Potsch L. Stability of 11-nor-Delta(9)-carboxy-tetrahydrocannabinol glucuronide in plasma and urine assessed by liquid chromatography-tandem mass spectrometry. Clin Chem. 2002;48:301–6. [PubMed] [Google Scholar]
Associated Data
This section collects any data citations, data availability statements, or supplementary materials included in this article.