Abstract
Non-destructive volume visualization can be achieved only by tomographic techniques, of which the most efficient is the x-ray micro computerized tomography (μCT).
High resolution μCT is a very versatile yet accurate (1-2 microns of resolution) technique for 3D examination of ex-vivo biological samples1, 2. As opposed to electron tomography, the μCT allows the examination of up to 4 cm thick samples. This technique requires only few hours of measurement as compared to weeks in histology. In addition, μCT does not rely on 2D stereologic models, thus it may complement and in some cases can even replace histological methods3, 4, which are both time consuming and destructive. Sample conditioning and positioning in μCT is straightforward and does not require high vacuum or low temperatures, which may adversely affect the structure. The sample is positioned and rotated 180° or 360°between a microfocused x-ray source and a detector, which includes a scintillator and an accurate CCD camera, For each angle a 2D image is taken, and then the entire volume is reconstructed using one of the different available algorithms5-7. The 3D resolution increases with the decrease of the rotation step. The present video protocol shows the main steps in preparation, immobilization and positioning of the sample followed by imaging at high resolution.
Keywords: Bioengineering, Issue 52, 3D imaging, tomography, x-ray, non invasive, ex-vivo
Protocol
1. Sample preparation
- After extracting the tissue which is to be examined, mineralized tissues can be positioned in the instrument and imaged. To image the mouse femur one should follow the following steps:
- Remove post mortem leg from a C57/Bl6 embryo 18.5 days postceutus (E18.5).
- Seal the narrow end of a polystyrene pipette tip (20-200 μl) using epoxy resin or another glue, and fill the tip with the working buffer (PBS or other).
- Fit tightly the leg into the tip and seal the other end with parafilm sheet.
- Place the pipette tip into a suitable holder and follow the protocol from chapter 3. For visualizing the femur from the mouse leg embryo, the instrument is set 40 KV and 200 μA. For 8μ resolution 1000 projection images with 4x magnification have to be acquired.
- Non-mineralized tissues have to be initially fixed and stained in order to increase the X-ray attenuation of the tissue of interest by using one of the many available protocols8,9. For the rat lungs and similar samples, the preparation protocol is:
- Orthotopical implantation of non small cell lung carcinoma (NSCLC) NCI-H460 on nude rat lungs
- Lung cancer nodules start being detectable 4 weeks from implantation
- Sacrifice the rat and immediately infuse it with saline solution mixed with heparin
- Inject it with of a diluted solution of Microfil (Flowtech), (2 ml of compound solution, 3 ml of diluent and 0.3 ml of curing agent) into the left ventricle to stain the bronchial circulation
- Extract the lungs and heart of the rat
- Immobilize the sample (see chapter 2 of the protocol) by fitting it tightly into a 50 ml plastic test tube
- Create a saturated ethanol atmosphere by placing on the bottom of the tube a cloth damped in ethanol
- Glue or screw the tube in a holder of the instrument
- Proceed with setting the imaging parameters (chapter 3). For complete imaging of the rat lungs the source is set at 40KV and 100 μA. In order to reach 16μ resolution one has to acquire 2500 projection images at a magnification of 0.5x.
2. Sample immobilization
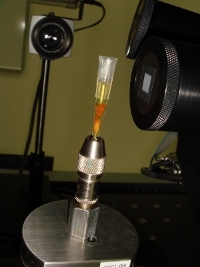
At high resolution, it is important to avoid any change in the sample position during the measurement. For this, the sample is tightly fixed into a plastic recipient that fits its size. Polystyrene pipette tips, plastic Pasteur pipettes or specially built plastic holders are used in this respect. According to the experimental requirements, the sample can be examined in air or immersed in ethanol or buffer solutions. Typical immobilization and final positioning of the leg of the mouse embryo in the instrument is shown in Fig 1.
 Figure 1. Final positioning of the embryonic mouse leg in the micro CT instrument.
3. Setting acquisition parameters: x-ray voltage and current, CCD exposure time
Placed into a holder, the sample is put in the rotation stage of the instrument
A first x-ray image is taken with the voltage and current arbitrarily set.
If the image is too dark, one should increase the number of photons first, so increase a little bit the current. If this is not enough, one should increase slightly the energy of the x-ray photons, i.e. the voltage on the x-ray tube.
If the image is too bright, one should first decrease the voltage, then the current.
The brightness of the image can be increased by binning. Binning of 1 takes into account the intensity of each pixel in the image, whereas binning of 2 takes the sum of each matrix of 2x2 pixels. The image will be about 4 times brighter than in the case of binning 1, but will have half the resolution.
After setting the optimum brightness, one has to optimize the exposure time of the camera to compromise between the best contrast on one side and a reasonable duration of the experiment on another side.
The contrast of images, especially of the low absorbing samples, can be improved by using filters, which reduce the photon flux, mainly that of the lower energy photons.
4. Sample positioning
Choose the working magnification. Possible choices are 0.5x,4x,10x,20x and 40x. The field of view decreases with increasing magnification.
Get the optimal resolution and field of view by setting the distances between the x-ray source and the sample and between the sample and the detector. Increasing the source to sample distance decreases the field of view and increases the resolution. Sample to detector distance has the opposite effect.
The whole field to be viewed in 3D should be present in the projection image at all angles. One should check this by rotating the sample at different angles and by bringing the sample as close as possible to the rotation axis. For this, one should follow the following steps:
Take an image at 0 deg, and then rotate the sample at -20 deg. If the desired volume has shifted laterally, one should correct its position by repositioning the rotation axis.
After correction, the sample is to be rotated at another angle and the position corrected again, until the field of interest is inside the image at all angles from -90 to 90 deg.
5. High resolution tomogram
During the measurement, the sample is rotated by a small angle at a time and at each angle one projection image is taken. The total number of images is always a compromise between the desired resolution on one side and the time of the measurement and the file size on another side. As shown in Fig.2, every single projection includes all slices in the sample superposed one over another, and therefore cannot reveal the 3D structure of the sample.
 Figure 2. Projection images of the lung of rat at 0°(A), 45° (B) and 90° (C) rotation angle.
Only after taking projection images at least between -90 and 90 deg, one can proceed to the reconstruction of the sample volume. Reconstruction takes between 10 min and 2 hours, depending of the software used and of the number of projections. Again, the final quality of the 3D image is a compromise between the desired resolution and the time one wants to spend and the size of the resulting file.
6. Image scale calibration
The pixel level (value) in a reconstructed image is unique for that image. In order to compare two different images, a unique intensity scale has to be imposed on each image. For this
Run a tomography with a standard phantom using the same experimental conditions as for the sample
Recalibrate the sample image using the values obtained for the phantom. The most common scale is the Hounsfield (or CT) scale. For 4x magnification the background value of 15,000 (for water or PBS) was replaced with 0 and the maximum value of 35,000 for the bone was replaced with the standard Hounsfield value of 3000. Other pixel values resulted from linear interpolation or extrapolation based on those limits.
7. Image processing and analysis
After obtaining high resolution images, one has to extract relevant information by using image analysis software. The software package to be used has to be designed to work with very large files (up to 20Gb).
8. Representative Results
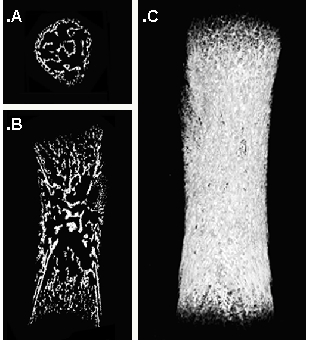
A representation of a femur from a C57/Bl6 mouse at embryonic day 18.5 (E18.5) - four days after the initiation of the mineralization process is shown in Fig 3. The mineral layers are clearly visible (white), while soft tissues are not visible in this preparation. We took 1000 projection images with a linear magnification of 4x. The final resolution is 8 microns. A careful analysis of the volume rendering shown in Fig.1, shows that the bone volume fraction (the fraction of the bone volume that is occupied by mineralized tissue) is 0.18, and the bone mineral density is 723 mg/cm3. Those values allow us to compare this structure with bones in other stages of development.
 Figure 3. Different representations of a 3D image of a mouse femur embryo. The transversal (cross section) (A), the sagital (medio-lateral) section (B) and a snapshot of the volume rendering (C) are shown.
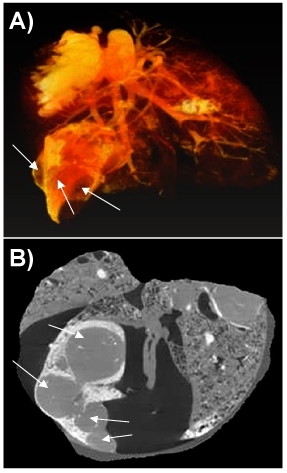
Figure 4 shows a 3D image of the lungs of a female nude rat (RNU), 12 weeks old, implanted orthotopically with non small cell lung carcinoma (NSCLC) NCI-H460. 2500 projection images were taken with a linear magnification of 0.5x, ensuring a final resolution of 16 microns. The image shows the Microfil stained blood vessels (down to 20 micron diameter).The image analysis shows that 4 weeks after implantation, multiple cancer nodules are formed. They are covering a significant fraction of the lung volume (17%). Most of the pulmonary staining was found in the peripheral areas of the tumors. Significantly, as shown in the fig 4B, several blood vessels are present also inside the nodules, covering, according to preliminary analysis some 3% of their volume.
 Figure 4. 3D image of cancer nodules growing in a rat lung. A snapshot of the volume rendering (A) and a section through the volume (B) are shown. The cancer nodules are marked with arrows.
Movie 1. Volume rendering of the mouse femur in Figure 1. Click here to watch the movie.
Movie 2. Volume rendering of the rat lungs in Figure 2. Click here to watch the movie.
Movie 3. Serial sections through the lungs. The nodules appear as grey areas in most of the slices. Click here to watch the movie.
Discussion
C57/Bl6 mouse at embryonic day 18.5 (E18.5) is four days after the initiation of the mineralization process. At this stage of development, the future bone is made of many layers of mineralized osteoids, clearly seen in Fig 3. At this point, one should stress that mineralized tissues can be visualized at lower resolution with different instruments which require less sample handling. The present protocol (and the micro CT instrument used in it) besides providing higher resolution, offers the highest flexibility for the user to choose the best geometrical parameters for the measurement.
Results in Fig 4 show that in the orthotopic lung cancer animal models, human non small cell lung cancer can induce recruitment of blood vessels and neovascularization. We consider that the lung tissue was neither moved, nor has its shape changed during the measurement. The user should take special precautions to avoid such changes during a tomography. For some samples, especially for the softer tissue, one has to build special holding devices that immobilize perfectly the sample during the measurement. Unfortunately the presence of high leakages of contrast agent in the surroundings of the tumors prevented reliable quantification of the peripheral blood vessels. As a result the images are tainted by some staining agent especially at the edges, which is clearly present in movies 2 and 3. We could not prevent this spill, but the useful information about the cancer nodules, including their size, shape and the presence of inner blood vessels was not affected. We could clearly conclude that at least for the bronchial circulation which was studied here, peripheral blood supply participates in tumor perfusion, with some perfusion present also inside the tumor.
Disclosures
No conflicts of interest declared.
Acknowledgments
The studies were conducted at the Irving and Cherna Moskowitz Center for Nano and Bio-Nano Imaging at the Weizmann Institute of Science.
We are grateful to Orna Yeger for her help in designing and running this protocol.
References
- Schambach SJ, Bag S, Schilling L, Groden C, Brockmann MA. Application of micro-CT in small animal imaging. Methods. 2010;50:2–13. doi: 10.1016/j.ymeth.2009.08.007. [DOI] [PubMed] [Google Scholar]
- Bauer JS, Link TM. Advances in osteoporosis imaging. Eur J Radiol. 2009;71:440–449. doi: 10.1016/j.ejrad.2008.04.064. [DOI] [PubMed] [Google Scholar]
- Chappard D, Retailleau-Gaborit N, Legrand E, Basle MF, Audran M. Comparison insight bone measurements by histomorphometry and microCT. J Bone Miner Res. 2005;20:1177–1184. doi: 10.1359/JBMR.050205. [DOI] [PubMed] [Google Scholar]
- Muller R, Van Campenhout H, Damme BVan. Morphometric analysis of human bone biopsies: a quantitative structural comparison of histological sections and micro-computed tomography. Bone. 1998;23:59–66. doi: 10.1016/s8756-3282(98)00068-4. [DOI] [PubMed] [Google Scholar]
- Mueller K, Yagel R, Wheller JJ. Anti-Aliased 3D Cone-Beam Reconstruction Of Low-Contrast Objects With Algebraic Methods. IEEE Transactions on Medical Imaging. 1999;18:519–537. doi: 10.1109/42.781017. [DOI] [PubMed] [Google Scholar]
- Kachelriess M, Schaller S, Kalender WA. Advanced single-slice rebinning in cone-beam spiral CT. Med Phys. 2000;27:754–772. doi: 10.1118/1.598938. [DOI] [PubMed] [Google Scholar]
- Endo M, Komatsu S, Kandatsu S, Yashiro T, Baba M. A combination-weighted Feldkamp-based reconstruction algorithm for cone-beam CT. Phys. Med. Biol. 2006;51:3953–3965. doi: 10.1088/0031-9155/51/16/005. [DOI] [PubMed] [Google Scholar]
- Marxen M, Thornton MM, Chiarot CB, Klement G, Koprivnikar J, Sled JG, Henkelman RM. MicroCT scanner performance and considerations for vascular specimen imaging. Med Phys. 2004;31:305–313. doi: 10.1118/1.1637971. [DOI] [PubMed] [Google Scholar]
- Plouraboué F, Cloetens P, Fonta C, Steyer A, Lauwers F, Marc-Vergnes JP. X-ray high-resolution vascular network imaging. J Microsc. 2004;215:139–148. doi: 10.1111/j.0022-2720.2004.01362.x. [DOI] [PubMed] [Google Scholar]


