Abstract
Vapor deposition of silver and gold onto a porous anodized aluminum oxide template is shown to produce a SERS substrate with an average surface enhancement factor of 107 – 108. The high level of enhancement is explored using a combination of dark-field Rayleigh scattering and Raman spectroscopy and imaging. The scattering spectrum of the surface indicates a Plasmon resonance at 633 nm and dark-field imaging shows a relatively uniform scattering intensity at this wavelength. These measurements are consistent with the uniform enhanced Raman intensity observed in Raman maps of the substrate. Scanning electron microscopy shows the surface exhibits heterogeneous nanostructures with diameters of approximately 100 nm, the size of the pores in the template. Our measurements indicate that interactions between adjacent structures forming junctions and crevices likely give rise to a high density of hotspots, which provide the extraordinary SERS enhancement. The advantage of substrates prepared in this way is the reproducibly dense distribution of hotspots across the surface, increasing the likelihood that an analyte will experience the largest enhancement.
Introduction
The signal enhancements associated with surfaced enhanced Raman scattering (SERS) offer tremendous potential for label free detection of trace molecular analytes. Since the initial observation that roughened metal surfaces could give rise to substantial increases in the Raman scattering of adsorbates,1 considerable effort has gone into understanding the interactions that give rise to SERS.2, 3 While chemical mechanisms can generate increased Raman scattering intensities,4 it is acknowledged that the electromagnetic enhancement gives rise to the largest component of the SERS signal.2, 3 Specifically, when the excitation laser frequency coincides with a localized surface Plasmon resonance resonance (LSPR) of a metal nanostructure, the Raman scattering from a molecule within the effective range of the plasmon oscillation can be enhanced by as much as 108.2 The origin of the SERS enhancement continues to be an area of active research; however, multiple reports indicate that the largest enhancements come from specific “hotspots” on surfaces.5–7 These hotspots have been correlated to metallic junctions, wherein the maximum enhancements are observed in the gap or crevice between metallic nanostructures.8
Numerous SERS substrates have been developed to both understand the phenomena but also to utilize the enhanced Raman scattering for analytical measurements including single molecule SERS detection.6, 7, 9–11 SERS active surfaces have been prepared by such methods as electrochemical roughening, metal island films, electron-beam lithography, chemical etching, and the deposition or growth of metal nanostructures.2, 12–14 The design parameters that are important for a SERS substrate are the size, shape, and composition of the nanostructures, which are important for controlling the LSPR frequency that needs to be excited to generate the SERS effect.15, 16 In general, individual nanostructures, such as spheres or nanopyramids, will support enhancements on the order of 105.17–19 To create highly enhancing surfaces, SERS surfaces have been fabricated with junctions to maximize the enhancements of molecules residing in the “hotspot”.20–22 The signal from a hotspot generates significantly more signal than other, less enhancing sites, and thus it is desirable to maximize the density of hotspots on a surface.
Equally important to substrate fabrication is characterization. Key to understanding and utilizing SERS is detection of the LSPR and correlating it to the observed Raman enhancement. Wavelength scanning studies have verified the connection between the LSPR and high Raman enhancements.17 Measuring the dark-field Rayleigh scattering is a useful method of detecting the plasmon resonance frequencies.23 By illuminating with a broad white light source, enhanced scattering can be spectroscopically resolved to provide information about electronic properties of the sample. Dark-field scattering has been combined with Raman scattering to correlate scattering propeties with Raman enhancements of individual nanoparticles and particle aggregates.24–26 Because coupled nanostructures experience a shift in their Plasmon frequency associated with such factors as their dielectric surroundings and structure spacing, scattering measurements can provide insight into the interactions between nanoparticles on a surface.
Here we use the combination of dark-field hyperspectral imaging, Raman spectroscopy, and scanning electron microscopy to correlate the observed enhancements in a SERS substrate with the electronic and physical structure of the surface. Our studies indicate that extraordinary enhancement observed in these studies arises from a high density of hotpots, present on the surface, that are excited by our excitation laser. These results indicate substrates prepared using our method show a high level of enhancement that is consistent with ideas correlated to nanostructure junctions, or hotspots. By maximizing the overall hotspot density, the likelihoodof an analyte experiencing the largest enhancement increases, which is important for the detection of trace analytes.
Experimental
SERS substrate preparation
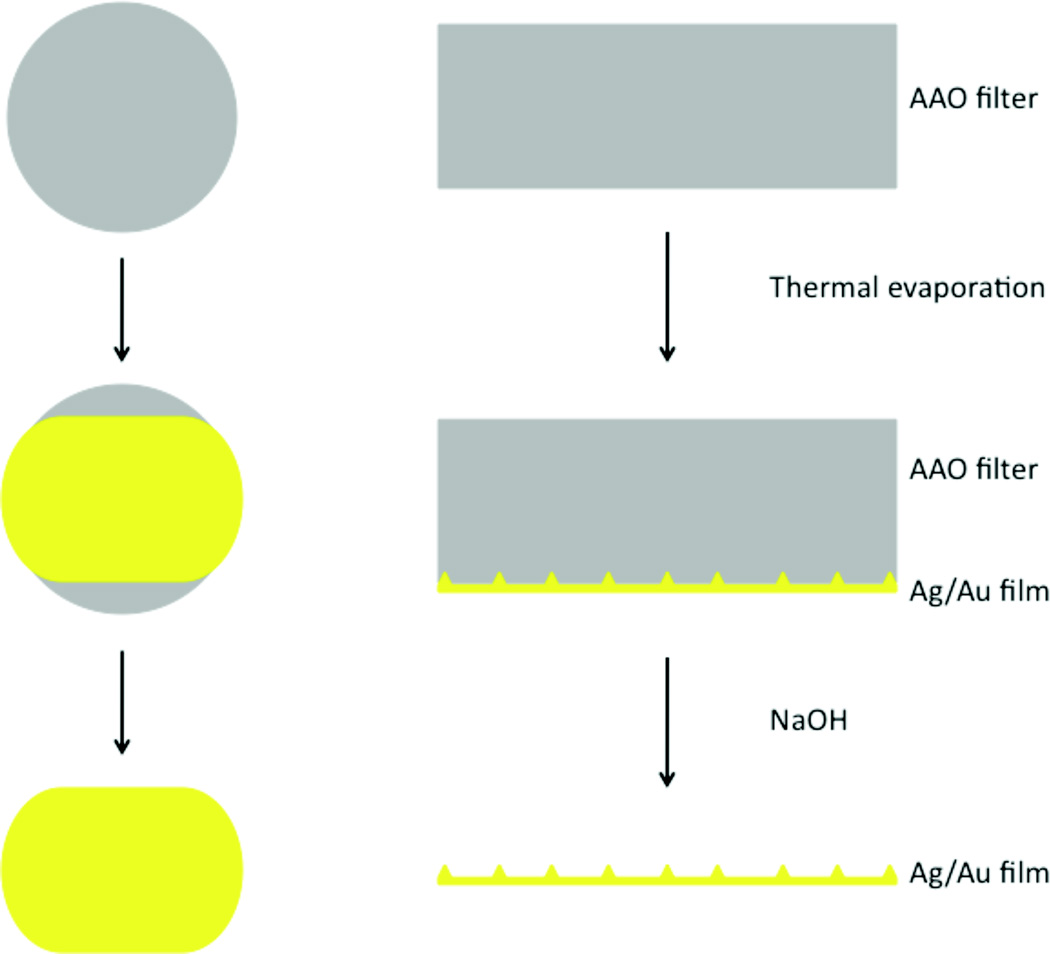
SERS substrates were prepared by thermal evaporation of either silver (Ag, Sigma-Aldrich, 99.999%) or gold (Au, American Elements, 99.999%) onto a commercial anodized aluminum oxide filter (Anodisc 13, Whatman) with 0.1 µm pores followed by subsequent removal of the AAO template as shown in Figure 1. The Anodisc filters were cleaned in Argon plasma for 5 minutes prior to depositing 400–1000 nm of Ag/Au onto a single side of the filter. Deposition was performed at a rate of 1 Å/sec. After deposition, the metal-coated filters were stored under vacuum until needed to prevent surface oxidation and contamination. The AAO filter was removed in 0.1 M NaOH (Sigma-Aldrich, 99.99%). After dissolution of the AAO filter, the film was rinsed with ultrapure water (Nanopure, 18.2MΩ cm).
Figure 1.
The steps involved in the preparation of the SERS substrate are depicted. A porous anodized aluminum oxide (AAO) filter is vapor coated with 500 nm of Ag or Au on one side. The metal-coated filter is soaked in thiophenol then the AAO template is removed by with 0.1 M NaOH. The side of the film nearest to the filter during deposition is a highly effective SERS substrate.
For analysis, a self-assembled monolayer of thiophenol was formed on the SERS substrate by soaking in a 10 mM ethanolic solution of thiophenol (Sigma-Aldrich, >99%) for 24 h, rinsing with ethanol, and allowing to dry prior to further experiments. Characterization was performed on the thiophenol-SAM on the metal-coated filter and after dissolution of the AAO template.
The SERS active metal film is quite thin (≤ 1 micrometer) and delicate after removal of the AAO template. For experiments, the film is epoxied to a solid support prior to template dissolution.
Characterization
Raman and dark-field scattering analysis was performed on a home-built micro-spectrometer. The instrument is built around a customized Olympus BX-51 upright microscope.
Raman Measurements
Raman Spectroscopy was performed using a 17 mW (cw) HeNe laser at 632.8 nm. The laser output was filtered using a 633 nm laser-line filter (Semrock), half-wave plate (Thorlabs), and thin film polarizer (ThorLabs). The beam diameter was increased using a 5x beam expander (Thorlabs) and reflected off a 633 nm edge filter (Semrock) at near normal incidence before being transmitted to the microscope. The laser was coupled into the microscope through an Olympus dual camera port, positioned above the BX-51 filter turret, where a moveable 90/10-beamsplitter (Chroma) directed the Raman excitation laser to the objective lens. A 100x Nikon L Plan SLWD objective (NA = 0.70) was used. Raman back-scattering was collected via the same objective lens and transmitted back through the Raman edge filter into an optical fiber connected to an Andor SR i303 spectrograph with a 600 groove/mm grating and a iDus 420BV CCD detector. Additional measurements and Raman imaging was performed using the piezo stage of an existing tip-enhanced Raman microscope, described previously,27 with similar excitation and detection. The excitation power was attenuated by adjusting the half-wave plate relative to the fixed polarizer and measured at the output of the microscope objective. The laser power incident on the sample was 1 mW, unless otherwise noted. The reported spectra are the average of 100 spectra collected with 10 ms acquisition times.
Dark-field Hyperspectral Imaging
Dark-field images were acquired using a SOC710 hyperspectral imaging system (Surface Optics Corp.) mounted vertically to the trinocular port with a c-mount adapter on the Olympus microscope. Reflected dark-field signals were obtained using an Olympus dark-field cube and and LMPlanFLN 50x BD objective (NA=0.50). The illumination was a 100W tungsten halogen bulb in a standard Olympus lamp housing with the heat shield removed. The SOC710 camera collects hyperspectral images using line scanning to generate a 520 bands×696 lines. The results presented were obtained by with an integration time of 50–100 ms per line. The reported scattering spectra were corrected for inhomogenieties in the system using a white reflectance calibration standard (Edmunds Optics).
Scanning Electron Microscopy
SEM images were acquired using Magellan 400 (FEI) field-emission scanning electron microscope with beam energies from 3–20kV. AAO filters were coated with 2 nm of iridium prior to analysis. Metallic films were imaged as prepared.
Results and Discussion
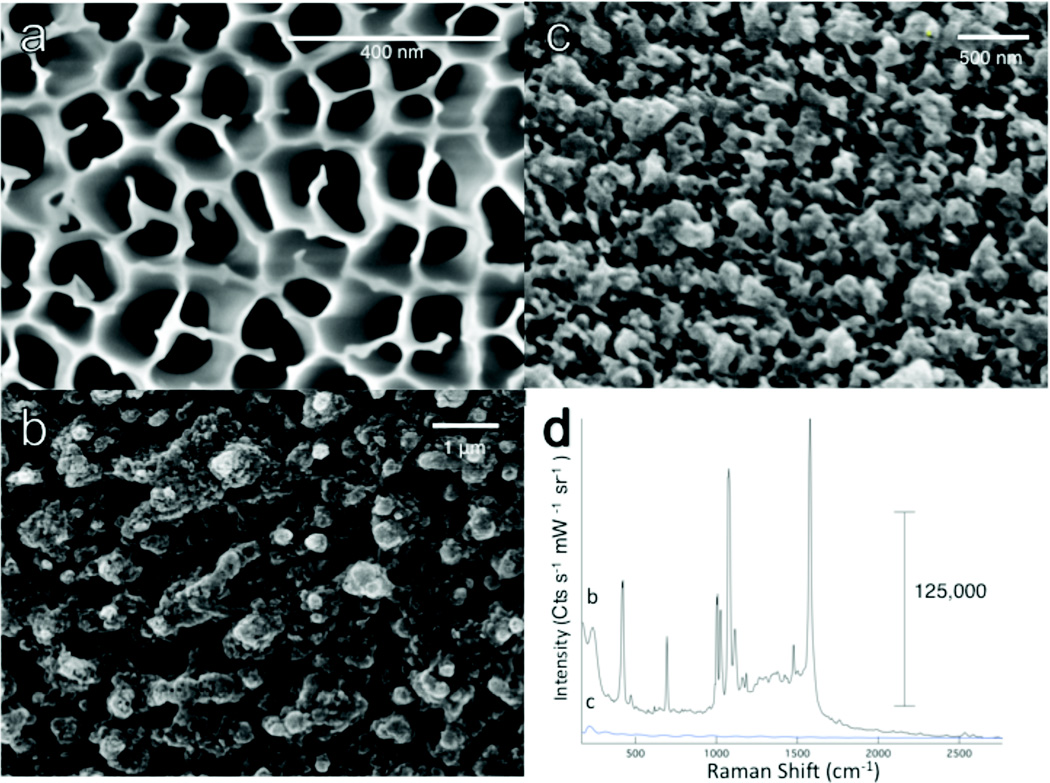
The SERS substrates were fabricated by thermally evaporating Ag or Au into the porous AAO template. The dimensions of the nanostructured features arise from the properties of the AAO template. From the SEM characterization shown in Figure 2, we see that the AAO template (Fig 2a) is rather irregular and gives rise to heterogeneous nanostructured surface after removal of the AAO template (Fig 2b). The nanostructures dimensions are limited by the ability of gas-phase metal ions to penetrate the pores of the template. As the pores fill in, the film seals itself and continued deposition results in a thickened metal film. The metal side furthest from the template exhibits roughness as shown in Figure 2c.
Figure 2.
Scanning electron micrographs are shown for (a) the AAO filter and the two sides of the metallic film: (b) the side of the film nearest the AAO template and (c) the back side of the film. (d) The templated metallic film evinces strong Raman scattering from a monolayer of thiophenol, while no scattering associated with the monolayer is observed from the back side of the film.
While the pores of the AAO template are heterogeneous in shape, the optical properties of the metal film are highly reproducible as will be discussed below. The AAO template shows different morphology on either side of the filter, one with well-defined pores and the other with larger openings branching into the well-defined pores. Comparison of SERS results obtained from deposition into either side yielded similar enhancements. We believe this uniformity arises from the metallic vapor deposition, where the larger openings provide access to the smaller pores, which fill and then continue filling the larger openings before sealing the template. The surface observed by SEM from a metallic film deposited onto either side of the template exhibits similar nanostructures. Filling of the small pores appears to limit the penetration of the metal ions into the template and the optical properties of the film do not appear sensitive to increased metal deposition. Additional metal deposition results in a thicker backing layer but no change in the resulting nanostructures.
The Raman signal from a thiophenol monolayer deposited onto the nanostructured (Fig. 2b) and backside (Fig. 2c) of the metallic film are dramatically different. In Figure 2d, the characteristic Raman spectrum of thiophenol is clearly seen as indicated by the peaks at 1572, 1022, 695 cm-1 associated with, for example, aromatic ring vibrational modes. In contrast, the rough back of the metal deposit does not generate any Raman scattering from thiophenol. The only signal discernable on the back is a low energy band at 215 cm−1 likely associated with the Ag surface. The batch-to-batch reproducibility of the SERS film is quite good. While there is some small variation in signals between batches, the observed enhancement is consistently of the same order of magnitude.
The electron micrographs support the idea that SERS enhancement on the nanostructured side originates from localized surface plasmons.13, 19 It is known that as nanoparticles decrease in size to below ca. 10 nm they no longer effectively scatter light, as absorption overtakes scattering processes.29 The difference in the enhancement observed on these two surfaces shows the importance of the localized surface plasmon resonance of nanostructures as opposed to nanoscale roughness from just a crevice, flake, or slight defect in a metal surface. The structure must support a localized plasmon resonance to generate the enhanced field. The highest SERS enhancements have been reported to occur between nanoparticles or in the crevice of nanoparticles that support a localized surface plasmon resonance.2, 13, 16, 20, 21, 30–32
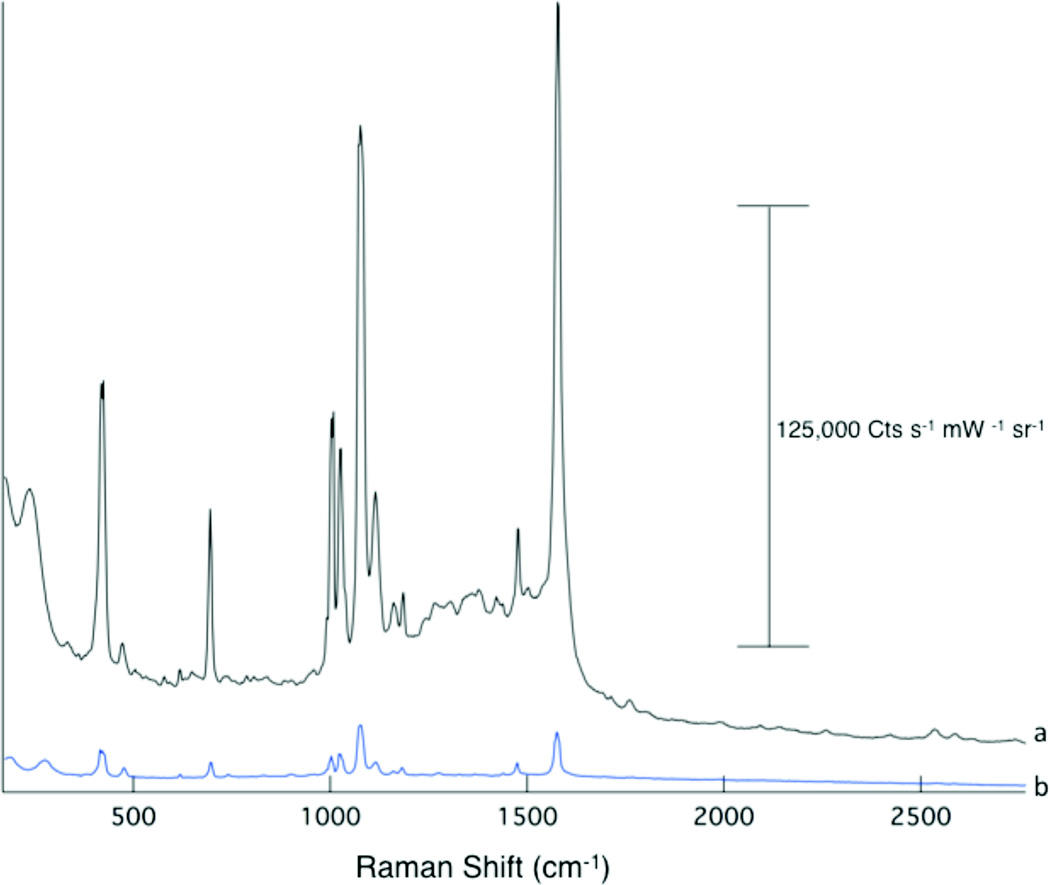
Figure 3 shows SERS spectra of thiophenol obtained from Ag and Au substrates, demonstrating that this substrate fabrication method is amenable to both metals. Consistent with previous work,28 Ag shows a greater SERS enhancement compared to a similarly prepared Au film. Further analysis was performed only on Ag substrates because of the significantly larger enhancement.
Figure 3.
Enhanced Raman scattering is observed from both Ag (a) and Au (b) films. The spectral are offset for clarity.
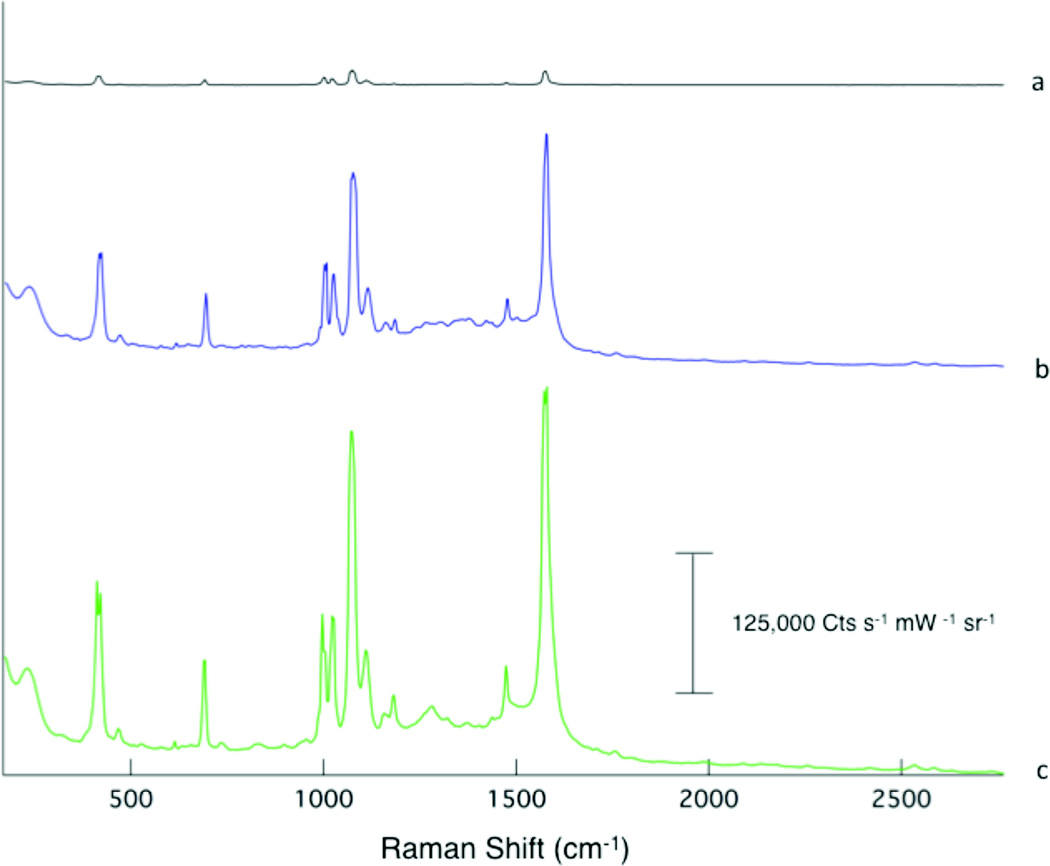
Raman measurements were obtained at various points during the fabrication of the SERS substrate to explore the origin of the observed enhancement. Figure 4a is the Raman spectrum observed from thiophenol deposited onto the nanostructured surface prior to dissolution of the AAO template. Upon dissolving the template in 0.1 M NaOH, rinsing with distilled water, and allowing the sample to dry; a 100x increase in signal is observed (Fig 4b). Re-soaking the film in thiophenol produced an additional 2x increase in the observed signal (Fig 4c). By resoaking the film, we were able to verify that removing the template generates additional SERS active sites.
Figure 4.
The Raman spectra are plotted from a monolayer of thiophenol deposited on the AAO-Ag film (a), the Ag nanostructured film following removal of the AAO template with NaOH (b), and after re-exposure of the film to thiophenol solution (c). The spectra are offset for clarity.
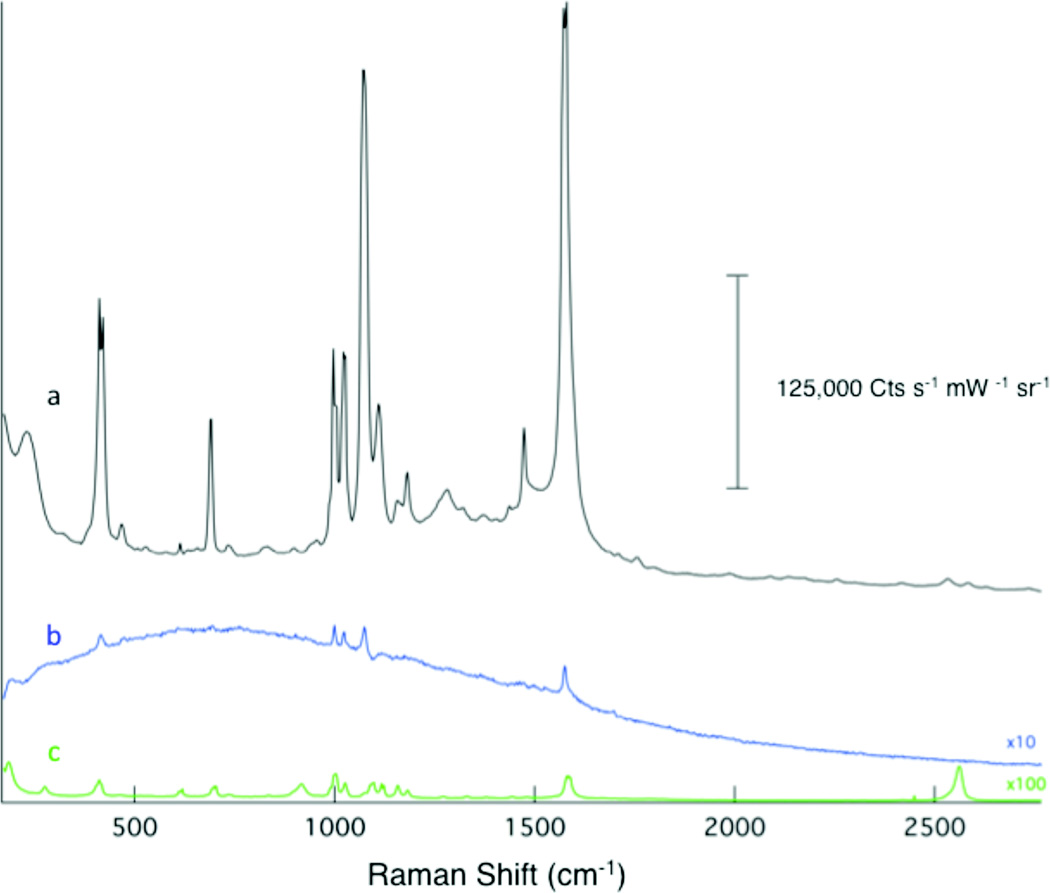
The observed enhancement factor is notoriously difficult to precisely quantify because the necessary comparison signal from a monolayer of thiophenol on a flat, non-enhancing surface is difficult to observe. In figure 5, we show the normalized signal obtained from our surface (Fig. 5a) in comparison with a monolayer of thiophenol on a commercial SERS substrate (Fig. 5b, Klarite 303, D3 Technologies) and neat thiophenol (Fig 5c). Our Ag film is clearly shows a much brighter signal. The commercial substrate was prepared with a thiophenol monolayer in the same manner as our SERS substrate. As noted above, Ag gives rise to higher enhancements than Au (e.g. Klarite); however, the comparison illustrates the magnitude of the observed SERS enhancement from our surfaces. Interestingly, the SERS intensity obtained from Au films prepared using our method (Fig. 3) also compare favorably with the commercial substrate.
Figure 5.
The Raman spectrum obtained from (a) our Ag SERS film is compared to the Raman response obtained from (b) a commercial SERS substrate and (c) neat thiophenol. The signal from the commercial substrate is multiplied 10x and the neat thiophenol by 100x to make the peaks discernable on the intensity scale of our substrate. The spectra are offset for clarity.
To calculate the enhancement factor for our surface, we have used a drop of neat thiophenol as a reference. Using the previously reported method,33 we measured the drop thickness by collecting Raman spectra through the drop to determine the volume of thiophenol giving rise to Raman scattering. We then used Pb UPD stripping to determine the surface area of accessible Ag sites on our substrate.34 Pb UPD was performed on the Ag film in the presence of the AAO template because the SERS film alone is difficult to measure directly. Using the highest reported packing density for thiophenol on a surface (1.1 nmol cm−2),33 we calculated the number of thiophenol molecules that give rise to the observed SERS signal. We functionalized the film in the template with thiophenol, rinsed and dried to remove any excess thiophenol molecules. The Raman signal was obtained, the template dissolved, and the Raman signal obtained again. Since no additional thiophenol was used, we conservatively assume the number of thiophenol molecules on the surface is unchanged. By comparing the counts per molecule on the SERS surface with those in neat thiophenol, we derive an average surface enhancement factor of 1.6 × 10⁶ for the surface with the template present, and 0.6 × 10⁸ when the template is removed. In order to sustain this high surface enhancement, a high density of highly enhancing sites must be present in our film.
Several effects may explain the dramatic changes in signal observed in Figure 4. The increased signal between the spectra in Figure 4b and 4c can be rationalized by an increase in surface coverage of the thiophenol upon re-soaking. The increase in signal between spectrum a and b is less intuitive.
The observed enhancement is larger than can be explained by the dispersion of light through the AAO filter. Measurements show the AAO filter transmits 33% of light to the surface, which cannot account a 100x change in signal. SERS is commonly described as varying according to the fourth power of the local electric field (E4).31 The SERS signal resulting from variation in the incident electric field (E0) can provide insight into the electromagnetic enhancements observed. We can qualitatively compare the local electric fields (Eloc) arising on the substrates using the relationship:
In the presence and absence of the AAO filter the intensity (I) of the peak at 1572 cm−1 provides a signal that represents the effective enhancement of the substrate. Using incident powers of 0.6 and 1.0 mW and the relation above, the local field in the presence of the filter corresponds 1.8 and 2.9, respectively. These changes are approximately linear with respect to the change in incident field strength. With the filter dissolved, of the Eloc determined, using 0.6 and 1.0 mW for E0, are 3.6 and 7.6, respectively. Here, the local fields are much stronger, suggesting increased interaction between nanostructures. In this case the enhancement is slightly non-linear. Calculations show that the E4 approximation is consistent for isolated nanospheres,35 and for coupled nanostructures when the plane-wave polarization is along the junction axis.36 It has been shown experimentally that this approximation breaks down in more complicated geometries.37 The heterogeneous surface structure, larger nanostructures, and arbitrary polarization will result in multi-pole and other effects giving rise to deviations in the E4 approximation as suggested by Schatz and coworkers calculations.36 Of import, the change in field dependence indicates increased coupling between nanostructures, resulting in more hotspots resonant with our excitation laser. The numerous gaps and crevices observed in the SEM images likely give rise to these additional hotspots when the template is removed, such that a few additional hotspots will generate the large increases in the observed enhanced signal.5
It has been shown that encasing metal nanoparticles in SiO2 or Al2O3 will diminish the field experienced on the particle surface resulting from the exponential decay in the field from the metallic surface. Shell- isolated nanoparticle-enhanced Raman scattering (SHINERS) takes advantage of a very thin coating to protect the metal surface; however, the authors reported that the effective enhancement decreases with increased coating thickness.38 The diminished field between structures suggests that the decreased signal observed in Figure 5a results from two effects: first, a decreased accessibility of the thiophenol to hotspots; but secondly, a decreased coupling of the fields between adjacent nanostructures. Diminished fields between nanostructures would diminish the enhancement experienced by our probe molecules residing in these junctions.
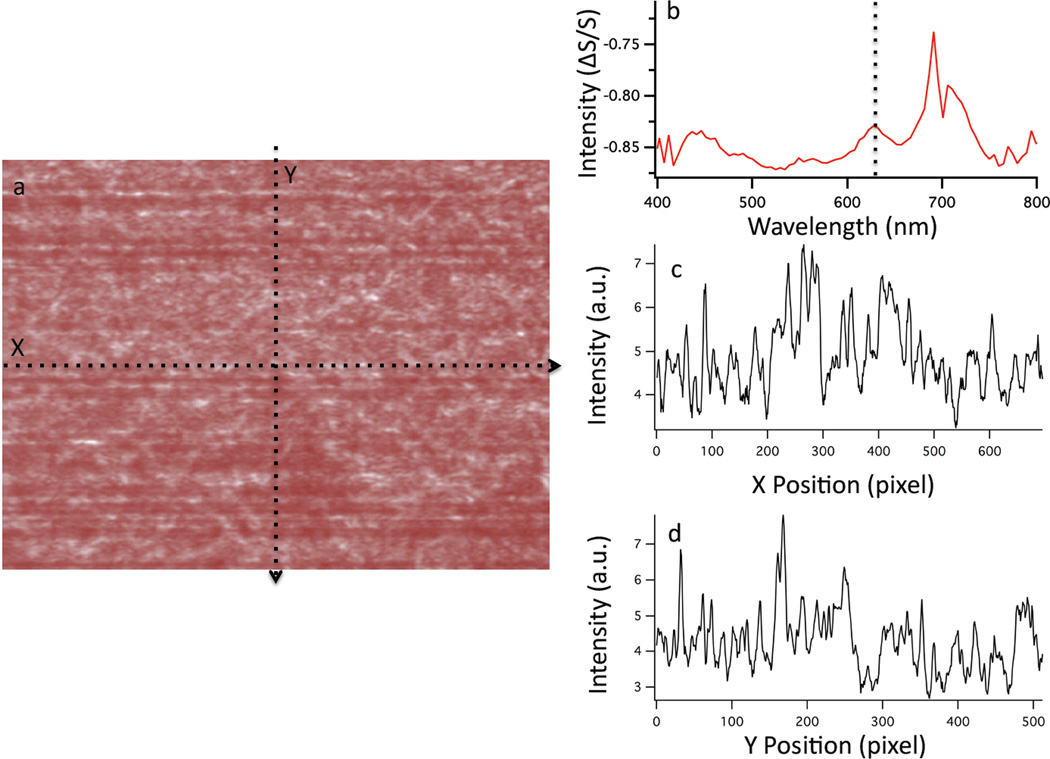
The extent of coupling between plasmonic structures clearly influences the magnitude and the frequency of the observed scattering. Hyperspectral dark-field microscopy measurements were performed on the SERS substrate as shown in Figure 6. The image shows the spatial variation of the dark-field scattering intensity observed at 633 nm from the SERS substrate. The scattering spectrum evinces a peak at 633 nm (Fig 6b), which correlates well with the large SERS signal obtained. Current understanding of the SERS electromagnetic enhancements dictates that the maximum intensity enhancement is achieved when the excitation laser is resonant with the LSPR,2 which is sensitive to number of factors, including the nanostructure aspect ratio, dielectric environment, and the presence of adsorbates.2, 15 The presence of the AAO filter may result in a shift in the plasmon resonance frequency; however, we were unable to detect the scattering from the nanostructured metal film with the AAO filter intact.
Figure 6.
The dark-field image at 633 nm of the SERS substrate is shown (a). The scattering spectrum from the surface, depicting a resonance near 633 nm (dotted line) is plotted in b. The intensity profile in the×and y direction are plotted in c and d, respectively. The relative standard deviation of the scattering intensity in these×and y profiles is 17% and 20%, respectively. The scattering spectrum shows a dip at 700 nm caused by a bad camera pixel observed in all samples.
Analysis of the scattering intensity profiles (Figs. 6c & 6d) exhibit a relative standard deviation of 17% and 20% in×and y, respectively. Given the heterogeneous surface structure of the SERS film, the relative uniformity of the scattering intensity is quite good. It is worth noting that the aggregation of multiple larger nanoparticles will increase the relative scattering intensity but has a diminishing effect on the transverse Plasmon resonance frequency.39 The longitudinal Plasmon is known to increase with increased coupling and is likely responsible for the scattering peak observed at 700 nm (Fig 6b).
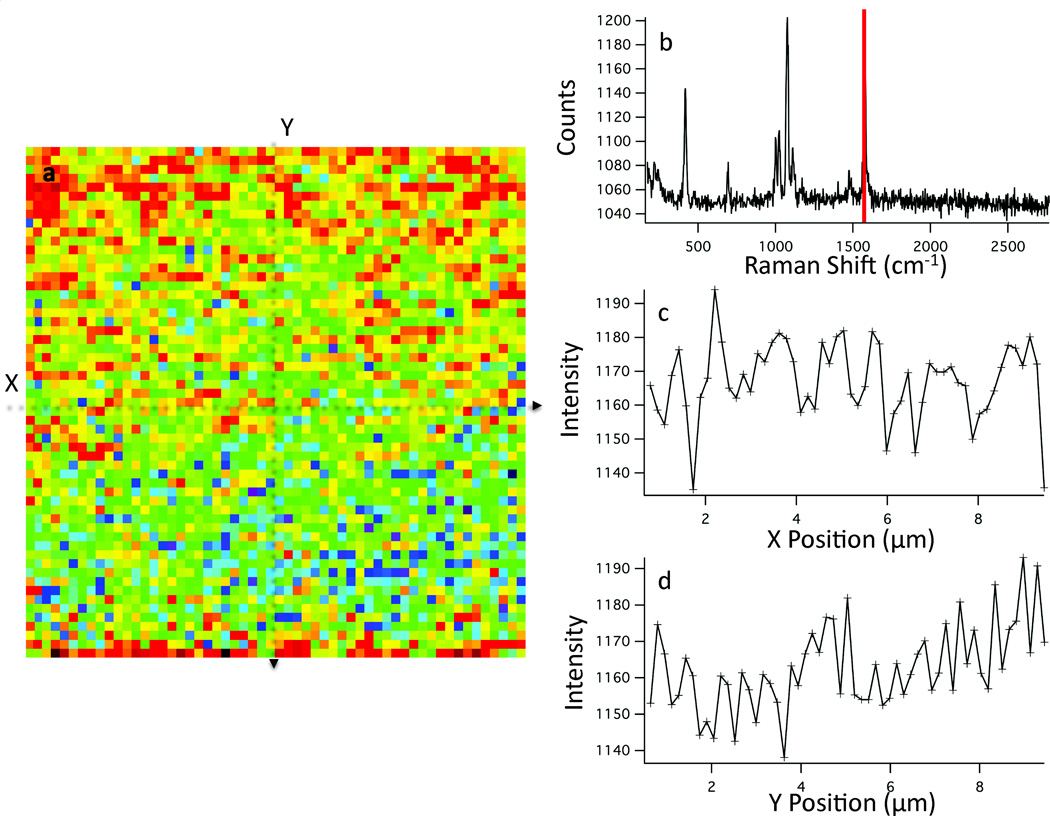
The observed scattering can be compared to the Raman intensities observed from mapping the thiophenol peak at 1572 cm−1 (Fig. 7a). The Raman intensity map in Figure 7 shows intensity variation similar to that observed in the dark-field scattering. The relative standard deviation of the intensity profiles from this map are 9.3% and 9.8% in×and y, respectively. The observed intensity fluctuation is lower in the Raman map than in the dark-field image.
Figure 7.
A heat map (a) of the 1572 cm−1 Raman band (red line, b) of thiophenol is shown. The spectrum from the center pixel is shown in b. The Raman intensity profiles in the×and y direction are plotted in b and c respectively. The background subtracted, relative standard deviation of these intensity profiles are 9.3% and 9.8% in the×and y direction, respectively.
The decreased RSD observed in the Raman map agrees with work in isolated nanoparticle aggregates, specifically that the enhancement of a molecule arises primarily from dimer interaction and that additional particles do not substantially increase the observed Raman enhancement.8 The SERS substrate reported here can be simplified as many particles agglomerated together. The crevices and gaps in the surface comprise individual junctions or hotspots. The lower RSD observed in the Raman map compared to the dark-field image suggests a more uniform coverage of thiophenol accessible hotspots relative to total nanostructure aggregation.
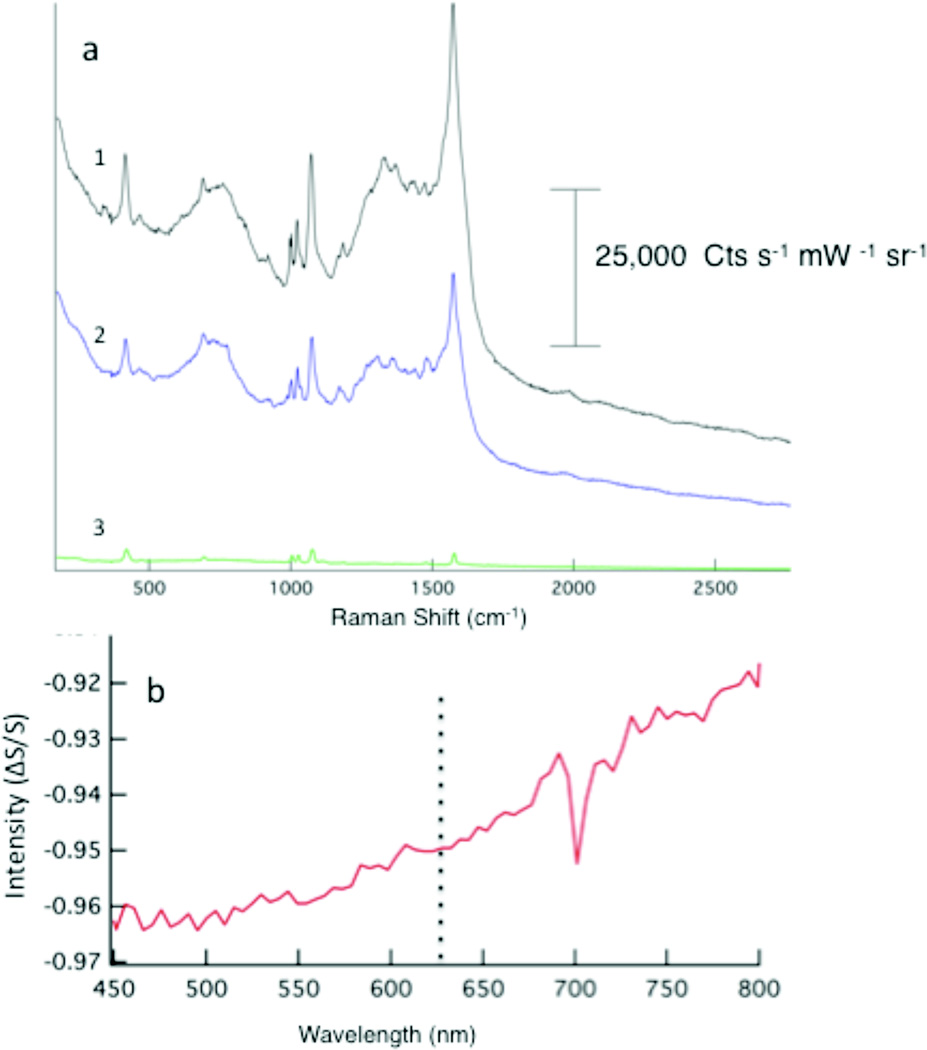
To further explore the role of nanoparticle coupling, we investigated the influence of water on the observed dark-field scattering spectrum and Raman intensity. Shown in Figure 8 are Raman spectra illustrating the impact of an aqueous environment. In Figure 8a, the observed Raman intensity in air (trace 1) is significantly diminished in the presence of water (trace 2). Upon drying in air for 1 h, the Raman intensity is observed to return (trace 3). It is known that water will red shift the Plasmon resonance frequency, and indeed, the dark-field scattering spectrum (Fig. 8b) suggests a shift in the LSPR to longer wavelengths. The overall scattering intensity, within the range of the system, is also decreased relative to the spectrum shown in Figure 6. The reversibility of the enhancement further supports environmental effects are involved in the mediating the coupling between nanostructures on our SERS surface.
Figure 8.
The effects of water on the observed Raman spectrum are shown (a). The dry film in air (1) diminishes in intensity in the presence of water (3). The intensity is observed to return as the film dries (2). The scattering spectrum of the wet film (b) shows a red shift in intensity in the presence of water.
The shift in the Plasmon resonance observed in the presence of water further supports our assertion that coupling between nanostructures resulting in hotspots is responsible for the observed enhanced signal. Previously it was shown that coupling between nanoparticles is shorted by conductive contact.40 In this report, the authors provided a straightforward test of plasmon coupling, specifically that the plasmon resonance will shift with a change in dielectric environment. The changes observed in the scattering spectrum upon the addition of water support the presence of coupled nanostructures in the SERS substrate.
The diminished intensity observed in the presence of water further illustrates an important factor for SERS analysis. The optimum excitation is that which overlaps with the plasmon resonance frequency in the specific sample environment. Design of substrates must account for the environment in which the substrate will be utilized.
Conclusions
Here we have presented a SERS substrate that exhibits a high level of enhancement from a monolayer of thiophenol. The fabrication strategy is straightforward and is the observed enhancements are highly reproducible. The combination of visible- near infrared dark-field and Raman scattering measurements suggest that the enhancements arise from a relatively uniform distribution of hotspots, nanojunctions with a plasmon resonance coincident with the laser excitation and accessible to the thiophenol probe. The observed changes in the plasmon and Raman measurements indicate that coupled nanostructures are responsible for the high enhancements observed. Additionally, this combination of optical spectroscopic modalities in a single instrument is demonstrated to be advantageous for the characterization of opaque nanostructured surfaces. In light of increased understanding of the physics involved in SERS enhancements, improved characterization methods will enable improved engineering for wideranging applications and the use of SERS for detection of trace analytes.
Acknowledgement
The authors acknowledge the Notre Dame Integrated Imaging Facility for providing access to the scanning electron microscope. We thank the Bohn research group, specifically Sean Branagan, for use of and assistance with the thermal evaporator used in these studies. The hyperspectral imaging camera was provided on loan by Surface Optics Corporation. The National Institutes of Health Award R00 RR024367 and the University of Notre Dame funded this research.
References
- 1.Fleischmann M, Hendra PJ, McQuillan AJ. Raman spectra of pyridine adsorbed at a silver electrode. Chem Phys Lett. 1974;26(2):163–166. [Google Scholar]
- 2.Stiles PL, Dieringer JA, Shah NC, Van Duyne RP. Surface-Enhanced Raman Spectroscopy. Annu Rev Anal Chem. 2008;1(1):601–626. doi: 10.1146/annurev.anchem.1.031207.112814. [DOI] [PubMed] [Google Scholar]
- 3.Moskovits M. SURFACE-ENHANCED SPECTROSCOPY. Reviews of Modern Physics. 1985;57(3):783–826. [Google Scholar]
- 4.Campion A, Kambhampati P. Surface-enhanced Raman scattering. Chemical Society Reviews. 1998;27(4):241–250. [Google Scholar]
- 5.Fang Y, Seong N-H, Dlott DD. Measurement of the Distribution of Site Enhancements in Surface-Enhanced Raman Scattering. Science. 2008;321(5887):388–392. doi: 10.1126/science.1159499. [DOI] [PubMed] [Google Scholar]
- 6.Xu HX, Bjerneld EJ, Kail M, Borjesson L. Spectroscopy of single hemoglobin molecules by surface enhanced Raman scattering. Phys. Rev. Lett. 1999;83(21):4357–4360. [Google Scholar]
- 7.Michaels AM, Jiang J, Brus L. Ag nanocrystal junctions as the site for surface- enhanced Raman scattering of single Rhodamine 6G molecules. J Phys. Chem. B. 2000;104(50):11965–11971. [Google Scholar]
- 8.Wustholz KL, Henry A-L, McMahon JM, Freeman RG, Valley N, Piotti ME, Natan MJ, Schatz GC, Duyne RPV. Structure-Activity Relationships in Gold Nanoparticle Dimers and Trimers for Surface-Enhanced Raman Spectroscopy. J. Am. Chem. Soc. 2010;132(31):10903–10910. doi: 10.1021/ja104174m. [DOI] [PubMed] [Google Scholar]
- 9.Singhal K, Kalkan AK. Surface-Enhanced Raman Scattering Captures Conformational Changes of Single Photoactive Yellow Protein Molecules under Photoexcitation. J. Am. Chem. Soc. 2009;132(2):429–431. doi: 10.1021/ja9028704. [DOI] [PubMed] [Google Scholar]
- 10.Qian X-M, Nie SM. Single-molecule and single-nanoparticle SERS: from fundamental mechanisms to biomedical applications. Chemical Society Reviews. 2008;37(5):912–920. doi: 10.1039/b708839f. [DOI] [PubMed] [Google Scholar]
- 11.Kneipp K, Wang Y, Kneipp H, Perelman LT, Itzkan I, Dasari R, Feld MS. Single molecule detection using surface-enhanced Raman scattering (SERS) Phys. Rev. Lett. 1997;78(9):1667–1670. [Google Scholar]
- 12.Love SA, Marquis BJ, Haynes CL. Recent Advances in Nanomaterial Plasmonics: Fundamental Studies and Applications. Appl. Spectrosc. 2008;62(12):346A–362A. doi: 10.1366/000370208786822331. [DOI] [PubMed] [Google Scholar]
- 13.Camden JP, Dieringer JA, Zhao J, Van Duyne RP. Controlled Plasmonic Nanostructures for Surface-Enhanced Spectroscopy and Sensing. Accounts Chem. Res. 2008;41(12):1653–1661. doi: 10.1021/ar800041s. [DOI] [PubMed] [Google Scholar]
- 14.Driskell JD, Shanmukh S, Liu Y, Chaney SB, Tang XJ, Zhao YP, Dluhy RA. The use of aligned silver nanorod Arrays prepared by oblique angle deposition as surface enhanced Raman scattering substrates. J. Phys. Chem. C. 2008;112(4):895–901. [Google Scholar]
- 15.Noguez C. Surface plasmons on metal nanoparticles: The influence of shape and physical environment. J. Phys. Chem. C. 2007;111(10):3806–3819. [Google Scholar]
- 16.Lee SJ, Guan ZQ, Xu HX, Moskovits M. Surface-enhanced Raman spectroscopy and nanogeometry: The plasmonic origin of SERS. J. Phys. Chem. C. 2007;111(49):17985–17988. [Google Scholar]
- 17.McFarland AD, Young MA, Dieringer JA, Van Duyne RP. Wavelength-scanned surface-enhanced Raman excitation spectroscopy. J. Phys. Chem. B. 2005;109(22):11279–11285. doi: 10.1021/jp050508u. [DOI] [PubMed] [Google Scholar]
- 18.Ciou S-H, Cao Y-W, Huang H-C, Su D-Y, Huang C-L. SERS Enhancement Factors Studies of Silver Nanoprism and Spherical Nanoparticle Colloids in The Presence of Bromide Ions. The Journal of Physical Chemistry C. 2009;113(22):9520–9525. [Google Scholar]
- 19.Stiles PL, Dieringer JA, Shah NC, Van Duyne RR. Surface-Enhanced Raman Spectroscopy. Annu Rev Anal Chem. 2008;1:601–626. doi: 10.1146/annurev.anchem.1.031207.112814. [DOI] [PubMed] [Google Scholar]
- 20.Alexander KD, Skinner K, Zhang SP, Wei H, Lopez R. Tunable SERS in Gold Nanorod Dimers through Strain Control on an Elastomeric Substrate. Nano Lett. 2010;10(11):4488–4493. doi: 10.1021/nl1023172. [DOI] [PubMed] [Google Scholar]
- 21.Fromm DP, Sundaramurthy A, Kinkhabwala A, Schuck PJ, Kino GS, Moerner WE. Exploring the chemical enhancement for surface-enhanced Raman scattering with Au bowtie nanoantennas. The Journal of Chemical Physics. 2006;124(6):061101–061104. doi: 10.1063/1.2167649. [DOI] [PMC free article] [PubMed] [Google Scholar]
- 22.Lee SJ, Morrill AR, Moskovits M. Hot spots in silver nanowire bundles for surface-enhanced Raman spectroscopy. J. Am. Chem. Soc. 2006;128(7):2200–2201. doi: 10.1021/ja0578350. [DOI] [PubMed] [Google Scholar]
- 23.Chang WS, Slaughter LS, Khanal BP, Manna P, Zubarev ER, Link S. One-Dimensional Coupling of Gold Nanoparticle Plasmons in Self-Assembled Ring Superstructures. Nano Lett. 2009;9(3):1152–1157. doi: 10.1021/nl803796d. [DOI] [PubMed] [Google Scholar]
- 24.Hrelescu C, Sau TK, Rogach AL, Jackel F, Laurent G, Douillard L, Charra F. Selective Excitation of Individual Plasmonic Hotspots at the Tips of Single Gold Nanostars. Nano Lett. 2011;11(2):402–407. doi: 10.1021/nl103007m. [DOI] [PubMed] [Google Scholar]
- 25.Stoerzinger KA, Hasan W, Lin JY, Robles A, Odom TW. Screening Nanopyramid Assemblies to Optimize Surface Enhanced Raman Scattering. J. Phys. Chem. Lett. 2010;1(7):1046–1050. doi: 10.1021/jz100095b. [DOI] [PMC free article] [PubMed] [Google Scholar]
- 26.Itoh T, Kikkawa Y, Yoshida K, Hashimoto K, Biju V, Ishikawa M, Ozaki Y. Correlated measurements of plasmon resonance Rayleigh scattering and surface-enhanced resonance Raman scattering using a dark-field microspectroscopic system. J. Photochem. Photobiol. A-Chem. 2006;183(3):322–328. [Google Scholar]
- 27.Carrier SL, Kownacki CM, Schultz ZD. Protein-ligand binding investigated by a single nanoparticle TERS approach. Chem. Commun. 2011;47(7):2065–2067. doi: 10.1039/c0cc05059h. [DOI] [PMC free article] [PubMed] [Google Scholar]
- 28.Lee KS, El-Sayed MA. Gold and silver nanoparticles in sensing and imaging: Sensitivity of plasmon response to size, shape, and metal composition. J. Phys. Chem. B. 2006;110(39):19220–19225. doi: 10.1021/jp062536y. [DOI] [PubMed] [Google Scholar]
- 29.van de Hulst HC. Light Scattering by Small Particles. New York: Dover; 1981. p. p 470. [Google Scholar]
- 30.Laurence TA, Braun G, Talley C, Schwartzberg A, Moskovits M, Reich N, Huser T. Rapid, Solution-Based Characterization of Optimized SERS Nanoparticle Substrates. J. Am. Chem. Soc. 2009;131(1):162–169. doi: 10.1021/ja806236k. [DOI] [PubMed] [Google Scholar]
- 31.Moskovits M. Top Appl Phys. Vol. 103. Berlin: Springer-Verlag Berlin; 2006. Surface-enhanced Raman spectroscopy: a brief perspective; pp. 1–17. [Google Scholar]
- 32.Alexander KD, Hampton MJ, Zhang SP, Dhawan A, Xu HX, Lopez R. A high-throughput method for controlled hot-spot fabrication in SERS-active gold nanoparticle dimer arrays. Journal of Raman Spectroscopy. 2009;40(12):2171–2175. [Google Scholar]
- 33.Lu J, Chamberlin D, Rider DA, Liu M, Manners I, Russell TP. Using a ferrocenylsilane-based block copolymer as a template to produce nanotextured Ag surfaces: uniformly enhanced surface enhanced Raman scattering active substrates. Nanotechnology. 2006;17(23):5792–5797. [Google Scholar]
- 34.Taylor CE, Pemberton JE, Goodman GG, Schoenfisch MH. Surface Enhancement Factors for Ag and Au Surfaces Relative to Pt Surfaces for Monolayers of Thiophenol. Appl. Spectrosc. 1999;53(10):1212–1221. [Google Scholar]
- 35.Kerker M. Estimation of surface-enhanced raman scattering from surface-averaged electromagnetic intensities. Journal of Colloid and Interface Science. 1987;118(2):417–421. [Google Scholar]
- 36.Ausman LK, Schatz GC. On the importance of incorporating dipole reradiation in the modeling of surface enhanced Raman scattering from spheres. J Chem Phys. 2009;131(8):10. doi: 10.1063/1.3211969. [DOI] [PubMed] [Google Scholar]
- 37.Le Ru EC, Grand J, Felidj N, Aubard J, Levi G, Hohenau A, Krenn JR, Blackie E, Etchegoin PG. Experimental verification of the SERS electromagnetic model beyond the vertical bar E vertical bar(4) approximation: Polarization effects. J. Phys. Chem. C. 2008;112(22):8117–8121. [Google Scholar]
- 38.Li JF, Huang YF, Ding Y, Yang ZL, Li SB, Zhou XS, Fan FR, Zhang W, Zhou ZY, WuDe Y, Ren B, Wang ZL, Tian ZQ. Shell-isolated nanoparticle-enhanced Raman spectroscopy. Nature. 2010;464(7287):392–395. doi: 10.1038/nature08907. [DOI] [PubMed] [Google Scholar]
- 39.Wei QH, Su KH, Durant S, Zhang X. Plasmon resonance of finite one-dimensional Au nanoparticle chains. Nano Lett. 2004;4(6):1067–1071. [Google Scholar]
- 40.Slaughter LS, Wu YP, Willingham BA, Nordlander P, Link S. Effects of Symmetry Breaking and Conductive Contact on the Plasmon Coupling in Gold Nanorod Dimers. ACS Nano. 2010;4(8):4657–4666. doi: 10.1021/nn1011144. [DOI] [PubMed] [Google Scholar]


