

Abstract
This study reports a high-resolution MRI approach to image basal blood flow and hypercapnia-induced blood-flow changes in the unanesthetized human retina on a 3-Tesla MRI scanner. Pseudo-continuous arterial-spin-labeling technique with static-tissue suppression was implemented to minimize movement artifacts and improve blood-flow sensitivity. Turbo spin-echo acquisition was used to achieve high spatial resolution free of susceptibility artifacts. The size, shape and position of a custom-made receive radiofrequency coil were optimized for sensitivity in the posterior retina. Synchronized eye blink and respiration to the end of each data readout minimized eye movement and physiological fluctuation. Robust high-contrast blood-flow MRI of the unanesthetized human retina was obtained at 500×800μm2 in-plane resolution. Blood flow in the posterior retina was 93±31mL/100mL/min (mean±SD, N=5). Hypercapnic inhalation (5% CO2) increased blood flow by 12±2% relative to air (P<0.01, N=5). This study demonstrates the feasibility of blood-flow MRI of the retina of unanesthetized human. Because blood flow is tightly coupled to metabolic function under normal conditions and it is often perturbed in diseases, this approach could provide unique insights into retinal physiology and serve as an objective imaging biomarker for disease staging and testing of novel therapeutic strategies. This approach could open up new avenue of retinal research.
Keywords: ASL, retinal vessels, choroid, high-resolution MRI, hypercapnia
INTRODUCTION
Blood flow (BF) in the brain is intricately coupled to basal metabolic function under normal physiological conditions, and it is often perturbed in disease states (1). Basal BF and its responses to stimulations have been utilized as imaging biomarkers for early detection, disease staging, and longitudinal monitoring of therapeutic intervention in the brain. Similar studies probing BF and neurovascular coupling in the retina are sparse by comparison, in part due to the lack of sufficiently high spatial resolution and quantitative BF imaging techniques for the retina in vivo. Abnormal basal BF and neurovascular coupling to stimulations may play an important role in many retinal diseases, including glaucoma and diabetic retinopathy, and retinal ischemia (see reviews (2,3)).
In vivo BF imaging of the retina has been reported using fluorescein angiography (4), indocyanin-green angiography (5), laser Doppler flowmetry (LDF) (6) and laser speckle imaging (7,8). While these BF techniques have made remarkable contributions to our understanding of normal retinal physiology and pathophysiology, they are qualitative and depth ambiguous. Choroidal vessels are behind the usually opaque retinal pigment epithelium. Moreover, optical scattering and disease-induced opacity, such as vitreal hemorrhage and cataract, could hamper efficacy of optical imaging techniques.
Magnetic resonance imaging (MRI), by contrast, provides quantitative BF images of the brain without depth limitation and BF MRI has been utilized for studying brain physiology and pathophysiology. BF can be measured quantitatively by dynamic susceptibility contrast MRI using an exogenous contrast agent (9), or by magnetically labeling the endogenous water in blood using the arterial spin labeling (ASL) technique (10-12). The dynamic susceptibility contrast MRI technique is efficient but it is incompatible with time-series BF functional MRI and high-resolution BF MRI because the long half-life of the contrast agent allows only one measurement per bolus injection, precluding time-series measurement and signal averaging to augment signal-to-noise ratio. The ASL technique, on the other hand, is totally non-invasive, and the labeled water has a favorable short half-life (~ blood water T1 of ~1 s), ideally suited for time-series and high-resolution BF MRI. Quantitative BF MRI also allows comparison across experimental groups.
High-resolution BF MRI of the retina in anesthetized rodents has been reported recently in normal retina (13) and retinal degeneration (14). BF MRI of the human retina is however more challenging because: i) magnetic field gradients on clinical scanners are weaker than animal scanners, making it difficult to achieve high spatial resolution to image the thin retina, ii) the eye is located in a region of large magnetic field inhomogeneity and is thus susceptible to signal drop off and image distortion when a typical echo-planar imaging technique is used for fMRI studies, and iii) eye motion in awake humans could constitute an additional challenge for BF MRI, which requires pair-wise subtraction. With the exception of a conference abstract (15), there are no reports of BF MRI studies of the human retina using a head-volume coil to our knowledge.
The goals of the present study were to explore the feasibility of imaging BF and BF responses by hypercapnic inhalation in the unanesthetized human retina using MRI. A custom-made receive-only eye coil was utilized to improve signal-to-noise ratio on a 3-Tesla clinical MRI scanner. Pseudo-continuous arterial spin-labeling technique (pCASL) (16) with background suppression and single-shot turbo spin-echo (TSE) acquisition were implemented. pCASL was used to improve BF sensitivity, background suppression was used to enhance sensitivity and minimize eye movement artifacts, and TSE was used to achieve high spatial resolution free of susceptibility-induced signal drop off and image distortion. Strategies (such as synchronized eye blink and inhalation) to minimize eye motion were implemented. Quantitative basal BF and hypercapnia-induced BF changes were analyzed.
MATERIALS AND METHODS
Subject preparations
Five healthy subjects (4 males, 1 females, and 24~45 years old) were studied with Institutional Review Board approval. Each subject was imaged in multiple sessions on different days. Multiple trials (scan with each trial lasting 8 mins) were acquired within each session. Subjects were instructed to maintain stable eye fixation on a target inside the magnet bore with synchronized eye blink to the end of data readout which generated a distinct sound as a cue. Subjects were also instructed to synchronize inhalation (or exhalation) only at the end of the data readout throughout the entire trial. With an inter-image repetition time of 4.6 s, such synchronized breathing and blinking were within comfort zones.
Basal BF measurements during air inhalation were acquired over 8 mins. For gas challenge, serial BF MRI was acquired during 4 mins air followed by 4 mins hypercapnia (5% CO2, 21% O2 and balance N2). Premixed gas was delivered via an inhalation face mask. The total scan duration for each trial was 8 mins. A break of 5-10 mins was given between trials.
Magnetic Resonance Imaging
MRI was performed on a 3T Phillips whole-body clinical scanner (Achieva, Philips Healthcare, Best, Netherlands) using the commercial body radiofrequency coil for transmission and a custom-built single-loop radiofrequency coil mounted on a pair of swimming goggles for reception (oval shape, 7×5 cm in diameter, right eye only). To demonstrate feasibility and to minimize partial-volume effect, only a single central axial slice bisecting the optic nerve head and fovea of the right eye was imaged.
BF was imaged using the pCASL technique with: RF pulse shape = Hanning window, RF pulse duration = 0.5 ms, flip angle = 18°, and interpulse pause = 0.5 ms, maximum labeling gradient = 6 mT/m, labeling duration = 2 s, and post-labeling delay = 1.5 s with balanced gradient scheme. The control images were acquired with a 180° phase shift to the labeling RF pulse. The ASL labeling plane was 7 cm inferior to the imaging plane. ASL background suppression employed two inversion pulses at 2061 and 3405 ms after the initial saturation pulse, which was placed before the labeling pulse (17). These two inversion times were optimized based on simulations using Matlab algorithms developed to minimize vitreous and retinal signal using the experimental parameters and assuming vitreous T1= 4163 ms and retina T1= 1015 ms which were assumed to be similar to those of the cerebrospinal fluid and gray matter at 3.0 T, respectively. Measurements of T1 values in the vitreous and retina will provide more accurate estimation of the blood flow value. These inversion delays were experimentally fine-tuned and confirmed to achieve necessary vitreous suppression and static tissue signal suppression.
Image acquisition utilized the single-shot TSE sequence with: TR = 4.6 s, TE = 30 ms, slice thickness = 6 mm, bandwidth = 12.8 kHz, TSE factor = 28, FOV = 50×43 mm, and matrix = 100×53 (resolution of 500×800 μm). The higher spatial resolution was placed along the readout direction, perpendicular to the posterior retina. Half-Fourier acquisition (52.5%) and linear profile ordering were used along the phase-encode direction, leading to a total TSE echo train length of 343 ms. Spatial-selective gradients were applied along with RF refocusing pulses to avoid aliasing artifacts along the phase-encode direction (18). Label and control images were acquired alternately with a temporal resolution of 9.2 s per paired image. A separate TSE scan without labeling module and inversion pulses with long TR = 15 s was performed to obtain M0 for BF calculation. This protocol showed no residual magnetization-transfer effect when the labeling plane was shifted to 7 cm superior to the imaging plane. Finally, the first refocusing pulse was 180° and the rest of the refocusing pulses were 160°. Due to the small FOV along the phase encode direction, only 28 refocusing pulses were applied during each TR cycle. Base on the safety monitor of the scanner, the SAR was 2.9W/Kg when TR = 4.6 s which was below the FDA recommended limit.
Data analysis
All images from each scan were first aligned using custom algorithms written in Matlab (MathWorks Inc, Natick, MA). Image intensity profiles across the retinal thickness were automatically drawn from the raw ASL images by radially projecting lines perpendicular to the retina (19) with 8 times spatial interpolation. Some interpolations were necessary for the profile analysis to be completely automated and such spatial interpolation was previously confirmed not to significantly alter peak width and height (19). Profiles at different time points were then co-registered to the averaged profile by minimizing the root-mean-square distances. Outlier images due to severe motion artifacts induced by unintended blinking during data readout were discarded (about 4% of the time-series images). Aligned images were played in bounced movie to ensure no residual motion or drift before further processing.
Voxel-by-voxel BF were quantified in units of mL/100mL/min to generate the BF map based on (20): , where ΔMASL is the difference of the control and label images. λ is the milliliter water per milliliter arterial blood (0.85) (21), blood T1,blood and T2,blood are 1.7 s at 37°C (22) and 275 ms at 3T (23). α, the arterial spin-labeling efficiency, was assumed to be 0.85 (24). αinv was 0.83 which corrected for the loss of perfusion signal due to the two background suppression pulses (25), TI is the post-labeling delay and M0 is the equilibrium signal intensity of vitreous calculated from the reference scan. The equilibrium signal intensity of vitreous was used as an intensity reference for pure water, avoiding the use of unknown retina-blood partition coefficient in the quantitative BF calculation.
Cross-correlation Z-score “activation” maps for display purpose were calculated via FSL software (26) by matching the BF signal time courses to the expected stimulus paradigm. Color statistical maps were overlaid on BF images. To objectively quantify BF data and minimize partial-volume effect (PVE), automated profile analysis was performed to generate the BF profiles across the thickness of the retina and along the length of the retina (19). BF values for the entire retinal thickness were determined as a function of the distance from the optic nerve head, where the BF values were taken at the peaks of the projection profiles. A region of interest (ROI) of the posterior retina was used to obtain the BF signal time courses and averaged BF values during air or hypercapnic inhalation. Data during transition (1 min) from air to hypercapnic inhalation was excluded from percent-change calculation.
All reported values and error bars on graphs were in mean ± standard deviation (SD). All statistical tests were employed one-way ANOVA with correction for correlated samples with a P < 0.05 indicating statistical significance unless otherwise stated.
RESULTS
The size and curvature of a custom-built receive-only RF coil were carefully optimized to achieve the highest SNR at the posterior retina. The RF coil was mounted onto a custom-made swimming eye goggle, providing comfort, stability and consistency. Retinal MRI free of movement artifacts was obtained by employed fixation strategy described above. Infrequent, minor movement and drift were successfully corrected with image co-registration.
Figure 1 shows an anatomical image, a representative pCASL control image, a time course of control and label images from the ROI of the posterior retina, and a quantitative BF map under basal condition from one subject. The perfusion signal ΔS from the entire retina typically ranged from 15 to 25% of raw MRI images. Quantitative BF image showed excellent BF contrast, with high BF localized to the posterior retina.
Figure 1.
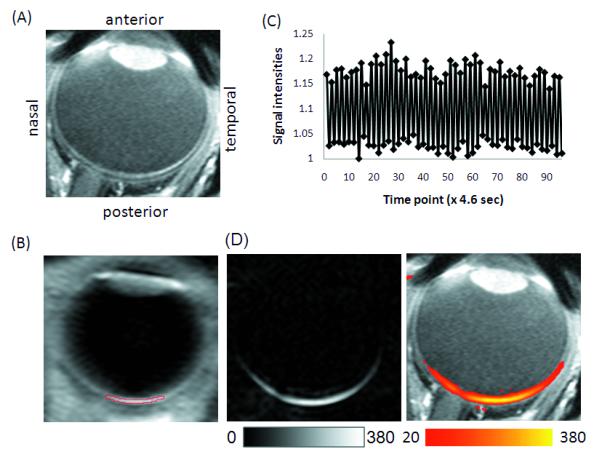
(A) T1-weighted scout image demonstrating the anatomical structure. (B) Representative control image from the pCASL scan with the ROI overlaid on the retina. (C) Time course of the control and label images from the ROI of the posterior retina as shown in (B). (D) Quantitative blood flow under basal condition in gray and color scale overlaid on a T1-weighted scout image. Scale bars indicate units of ml/100ml/mins.
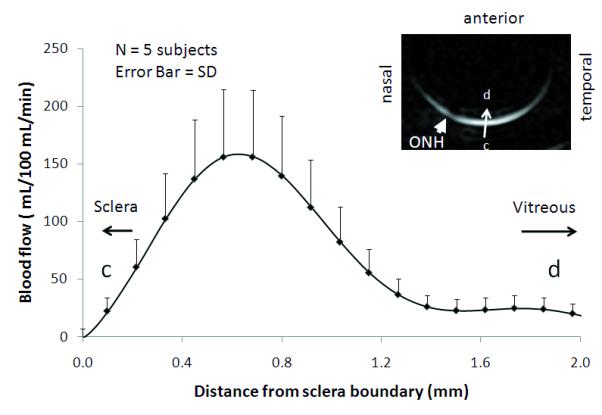
BF profiles were analyzed as a function of distance from optic nerve head (Figure 2). BF in the retina was markedly above noise level as indicated by the negligible BF values in the vitreous and sclera on either side of the BF profile. The average SNR of the basal blood flow from the posterior retina was 22 ± 9 (N = 3 subjects). Blood flow showed a strong spatially dependent, peaking around the fovea regions and dipped slightly around the optic nerve head relative to its surrounding, and dropping significantly at the distal edges of the retina. Quantitative BF profiles were also analyzed across the thickness of the retina (from sclera to vitreous) (Figure 3). The group-averaged BF value (peak) was 93 ± 31 mL/100mL/min, the group-averaged FWHM of the blood-flow profile was 709 ± 55 μm under basal condition.
Figure 2.

Group-averaged basal BF as a function of distance from the length of the retina as shown in the inset. ONH: optic nerve head.
Figure 3.
Group-averaged BF profiles under air inhalation across the retinal thickness from vitreous to sclera as shown in the inset.
BF percent-change correlation maps due to hypercapnic inhalation showed the BF responses highly localized to the retina (Figure 4, two repeated trials from one subject). Quantitative BF profiles across the thickness of the retina (from sclera to vitreous) showed hypercapnia evoked robust BF increases in the retina. Basal BF and hypercapnia-induced BF changes for individual subjects and averaged data are summarized in Figure 5 and Table 1. Hypercapnia (5%CO2 in air) increased blood flow by 12 ± 2% (P < 0.01) from 93 ± 31 (air) to 104 ± 35 ml/100ml/min. The mean FWHM of the blood-flow profile was 718 ± 60 μm under hypercapnic conditions, not statistically different from that under basal conditions (P > 0.05). No significant responses were detected in the lens and vitreous as expected. The rough measures of reproducibility by taking the standard deviations of multiple trials were 14.2% for basal BF and 14.5% for hypercapnic conditions (Table 1).
Figure 4.

(A) Hypercapnia-induced blood-flow activation maps from two repeated trials from the same subject. Color maps are overlaid on the blood flow images. Color bar indicates Z scores. (B) BF profiles under air (solid line curve) and hypercapnic inhalation (dotted line curve) across the retinal thickness from vitreous to sclera as shown in the inset.
Figure 5.
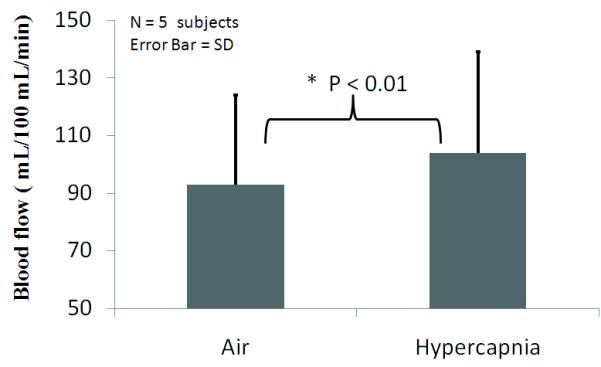
Group-averaged blood flow under air and hypercapnic (5% CO2) inhalation. Error bars are standard deviations for N = 5 subjects. P < 0.01.
Table 1.
Blood flow (mL/100mL/min, mean ± SD) of the human retina during air and hypercapnia (5% CO2 in air) inhalation from individual subjects obtained from profile analysis of the peak values for each trial individually. Studies of each session were performed on different days on the same subjects. Multiple fMRI trials were performed in each session except subject #5 to assess reproducibility.
| Subject ID | Gender | Age | Sessions | Trials | Air | Hypercapnia | % changes |
|---|---|---|---|---|---|---|---|
| 1a | Male | 24 | 4 | 5 | 143 ± 46b | 161 ± 45 | 14 ± 7 % |
| 2 | Male | 35 | 3 | 5 | 63 ± 9 | 73 ± 12 | 15 ± 5 % |
| 3 | Female | 25 | 3 | 4 | 70 ± 3 | 77 ± 3 | 10 ± 4 % |
| 4 | Male | 45 | 1 | 3 | 98 ± 6 | 113 ± 11 | 16 ± 6 % |
| 5 | Male | 24 | 1 | 1 | 92 | 99 | 7 % |
| Averagec | 12 | 19 | 93 ± 31 | 104 ± 35 | 12 ± 2 %* |
Standard deviations from each subject were taken across multiple trials.
This subject had a reproducible high blood flow, relative to others.
Averages and standard deviations were taken across all subjects (N = 5).
P < 0.01, one-way ANOVA with correction for correlated samples.
DISCUSSION
This study demonstrates a proof of concept that quantitative basal blood flow and its responses to hypercapnic challenge in unanesthetized human retina can be imaged using non-invasive MRI. A custom-designed eye surface coil improves SNR in the posterior retina compared to standard head volume coils, pseudo-continuous arterial spin-labeling techniqueimproves sensitivity for BF measurement, and high turbo-spin echo acquisition yields images free of susceptibility artifacts. Synchronized eye blink minimizes eye movement and synchronized respiration reduces physiological fluctuation, respectively. ASL blood-flow MRI is: i) non-invasive, ii) depth-resolved and unhindered by media opacity, iii) quantitative, allowing comparison across subjects, and iv) sensitive, capable of detecting changes associated with mild hypercapnic inhalation. MRI has the potential to provide a valuable tool to study how blood flow is regulated in the normal retina (i.e., neurovascular coupling), and how retinal diseases may affect basal blood flow and blood-flow regulation in vivo. Although improvement in spatial resolution is needed, this study sets the stage for further exploration of BF MRI of the human retina in normal and diseased states.
Potential issues
There are four potential confounds in imaging BF of the human retina using MRI, namely, spatiotemporal resolution, susceptibility artifacts, movement artifacts, and assumptions in the BF calculation.
Spatiotemporal resolution
The unique advantages of BF MRI include depth resolution, images unhindered by media opacity, and a large field of view, compared to many optical imaging techniques. Moreover, in contrast to most imaging approaches, MRI measures tissue perfusion of labeled water in the whole tissue within a voxel without the need to resolve individual vessels. The key disadvantages of BF MRI include poorer spatial and temporal resolution compared to optical imaging techniques. The need for synchronizing eye fixation to a target, particularly in some patients with eye diseases, may limit BF MRI application to the retina. PVE was significant and would likely result in underestimated BF values because the vitreous and sclera on either side of the retina had no significant BF. With the adult human eye of 25 mm in diameter, a central imaging slice of 6 mm yielded a significant PVE from the retinal curvature (61% of total retinal thickness including the choroid, assuming a spherical eyeball). Although the spatial resolution of 500 μm was high compared to typical brain studies, it yielded about one pixel across the human retinal thickness, which is 600 μm including the choroid (27) (see discussion below). The current resolution precludes imaging different BF layers within the retina. Future studies will need to improve spatial resolution and sensitivity to differentiate BF between the retinal and choroidal vasculatures.
Potential susceptibility artifacts
The eye is located close to air-tissue and bone-tissue interfaces and thus has severe magnetic field inhomogeneity. Single- and multi-shot echo-planar imaging of the retina was explored but unfortunately yielded severe susceptibility-induced image distortion and signal drop off (data not shown). TSE acquisition was thus implemented to achieve high spatial resolution MRI free of susceptibility artifacts. Specific absorption rate was not an issue with the pCASL TSE acquisition as the protocol was essentially identical to typical human brain BF measurements and was confirmed by the scanner specific absorption rate safety monitor.
Potential movement artifacts
High-resolution BF imaging of the retina may also be more susceptible to hardware drift and eye movement artifacts because: i) High-resolution imaging pulse sequence is more demanding on gradient performance of the scanner, which could lead to temperature-induced frequency and signal drift. We confirmed with our imaging protocols on phantoms that there was no significant drift due to hardware over half an hour of continuous scanning of the BF MRI protocol. ii) The thin retina is bounded by the sclera and the vitreous which have very different signal intensities than the retina. Mis-registration of the time-series images could thus lead to significant errors. We therefore applied background suppression to null the otherwise bright vitreous signal. iii) Finally, ASL BF MRI requires subtraction of paired images and is thus more susceptible to motion that may occur between acquisitions of the paired images. Thus, it is necessary to carefully evaluate ASL signal stability by evaluating time-loop movies and signal time courses to ensure no sudden jump or significant drift. With synchronized eye blink and respiration, movement and drift were small and residual eye movement could be corrected by image co-registration. All images were acquired in time series and co-registered if needed before signal averaging and cross-correlation analysis.
Quantitative BF calculation
Absolute quantification of BF is generally difficult and the commonly used MRI, positron emission tomography, LDF, and microsphere techniques have strengths and limitations. The pCASL MRI technique to measure BF of the retina has the following limitations. Firstly, the BF quantification formula used in this work is based on a simplified single blood compartment model, assuming that the labeled water does not cross the capillary wall or leave the voxel between labeling and signal acquisition. Secondly, BF calculation used estimated values for the blood labeling efficiency. Further validation of these parameters will improve the accuracy of BF quantification for human retina. BF MRI of the brain has been cross-validated with PET and autoradiographic techniques. Ultimately, ASL MRI of the retina needs to be cross validated with the microsphere technique in animal models. Improving accuracy of quantitative BF MRI remains an active area of research.
Human retinal thickness by BF profile
From BF profile across the retinal thickness, the FWHM was 709 ± 55 μm (including the choroidal vascular layer). Although this is expected to be slightly different anatomical thickness, it is informative to compare. Published thicknesses of the in vivo human neural retina (excluding the choroid) varied significantly, even within the Optical Coherence Tomography (OCT) literature – 236 μm (26) and 200-310 μm (27) around the fovea. While OCT can resolve laminar thickness of the neural retina, measuring choroidal thickness by optical imaging techniques remains challenging. Sparsely published in vivo human choroidal thickness has been reported to be 293-307 μm by partial coherence interferometry (28) and 318-335 μm by long-wavelength OCT (29). From these literatures, we estimated the total anatomical retinal thickness including the choroid from non-MRI measurement to be 500-650 μm (in the posterior retina) albeit strongly spatial dependent. By comparison, the rodent retinal thickness is 267 μm including the choroid (24), and the cat retinal thickness is 358 μm including the choroid (31), suggesting a scaling of retinal thickness with eye size.
Basal blood flow
Basal BF of the total retina, including the choroid was 93 ± 31 mL/100mL/min in awake human. To our knowledge, this is the first in vivo BF measurement in the unanesthetized human retina and there are no reports in the literature with which to compare. In animal model, basal BF of the rat retina has been reported to be 630 ± 100 mL/gram/min under 1% isoflurane using cASL MRI (13,14). The differences in blood flow of the retina between humans and rats could arise from many factors. They include species differences, spatial resolution differences (lower spatial resolution has more PVE, which yields lower BF), and the effect of isoflurane (used in rats) which is a vasodilator.
By comparison, in awake human, brain gray-matter BF was ~50 mL/100mL/min (10) using the same pCASL MRI technique. In anesthetized rats, brain gray-matter BF was 90 ± 13 mL/100g/min (28) and 110 ± 4 mL/100g/min (29) under essentially identical experimental conditions (i.e., ~1% isoflurane) as those reported for rat retina described above. The BF retina:brain ratio was reported to be 6.3:1 in rat and 2:1 in human (this study). The smaller BF retina:brain ratio in humans compared to animals could be due to comparatively lower spatial resolution, effect of isoflurane and/or species differences. Of note, destructive microsphere BF measurements in animal models that provided retinal and choroid BF values, reported that retinal BF was similar to cerebral BF in the gray matter whereas choroidal BF was about six to ten times higher than cerebral BF in rats (30) and monkeys (31).
BF MRI provides large field of view, in contrast to optical imaging techniques which have limited field of view constrained by illumination angle. Blood flow was observed to drop significantly at the distal edges of the retina, consistent with those reported previously in animal models (13,14). This is expected because the vascular density is highest around the optic nerve head but drops distally. Blood flow showed a strong spatial dependence, peaking around the foveal regions. This appears to contradict the notion that the fovea is free of retinal vessels and thus should have lower BF compared to surrounding region. A possible explanation is that the current spatial resolution precludes the fine resolution of the fovea and MRI BF signal of the macular ROI at current resolution is dominated by choroidal BF.
Blood flow dipped slightly around the optic nerve head relative to its surrounding as detected by MRI. It is surprising that BF in the optic nerve head ROI is less than the foveal ROI because optic nerve head is densely populated by large arteries and veins. It is possible that the ASL technique is generally less sensitive to large water-impermeable vessels and more sensitive to smaller vessels (such as arterioles, capillaries and venules) (32,33) due to a longer post-labeling used allowing labeled spins to leave large arteries and move into smaller vessels, and the labeled spins lose substantial contrast (with a time constant T1 of ~ 1.5 s) by the time they reach large draining veins. Being more sensitive to smaller vessels (34) is advantageous because it reflects local tissue perfusion and is more spatially specific to the sites of increased neuronal activities.
Blood flow changes
Hypercapnic (5% CO2 in air) inhalation increased BF of the unanesthetized human retina by 12 ± 2%. In isoflurane-anesthetized rats, hypercapnic inhalation increased BF by 16 ± 6 % using BF MRI (13). BF MRI of animal and human retinas showed consistent positive BF increases during hypercapnic inhalation. While there is evidence that hypercapnia elicits vasodilation in both retinal and choroid blood vessels using LDF and microsphere techniques (35-38), the literature are sparse and inconsistent. Inhalation of 10% CO2 in air showed no significant vasodilation in the retinal vessels (39). Inhalation of carbogen (95% O2 + 5% CO2) increased choroid BF by 12.5 ± 11.7% with large inter-subject variations (40). Pulsatile ocular blood flow tonography also reported significant choroidal BF increases (41).
By comparison, in the rat brain, hypercapnic (5% CO2 in air) inhalation increased cerebral BF varied over a wide range in anesthetized rats, ca., 25% (42) and 52% (29). Similar hypercapnia-induced changes in cerebral BF in awake humans have also been reported in the literature. Hypercapnia-induced BF increase in the retina is smaller than that in the brain, which could be due to PVE or the unique responses of the retina.
Finally, caution must be exercised when comparing BF measurements among LDF, microsphere and MRI techniques because they have different signal sources. Microsphere values may be susceptible to post-mortem artifacts, may vary depending on microsphere size and concentration (43). LDF typically measures a single point source within the probe sensitivity whereas BF in the retina has a spatial dependence. Retinal BF measured using LDF is limited to the optic nerve head and could be contaminated by choroidal BF because LDF has ambiguous depth resolution. Choroid BF is limited to the macular region where retinal vessels are absent. BF MRI offers a large field of view and not depth limited, but takes significantly longer to acquire. BF MRI may have the unique potential to image layer-specific, quantitative BF in human retina if higher spatial resolution can be achieved. In addition to BF, MRI also provides anatomical, oxygen tension and functional data. MRI has recently been applied to investigate structures of the retina (19,44), changes in tissue oxygenation using blood-oxygenation-level-dependent (BOLD) functional MRI associated with physiologic (19) and visual (45,46) stimulation in animal models. Changes in layer thickness and BOLD functional MRI responses to physiologic challenges in an animal model of retinitis pigmentosa in which the photoreceptors progressively degenerate have also been reported (19). Translating these approaches to image the retina may have important applications.
CONCLUSIONS
This study reports our initial experience on imaging basal blood flow and hypercapnia-induced blood-flow changes in the retina of unanesthetized humans. Future studies will need to improve sensitivity and spatiotemporal resolution, incorporate three-dimensional blood-flow and other (e.g., BOLD and anatomical) MRI methods, and apply multimodal MRI approach to study retinal diseases. With improvement in spatiotemporal resolution and sensitivity, MRI has the potential to provide unique information, with depth resolution, on how blood flow is regulated and how retinal diseases may affect blood flow and the neural tissues they subserve, as well as the ability to serve as an objective biomarker for staging disease, monitoring of therapeutic intervention, and testing novel therapeutic strategy. This approach could open up new avenues for retinal research and complement existing retinal imaging techniques.
Acknowledgments
Grant support: This work was supported by a Clinical Translational Science Award Pilot Grant (to TQD) and a Translational Technology Resource grant (to QP) (parent grant UL1RR025767). TQD received supports from the NIH/NEI (R01 EY014211 and EY018855), and the VISN7 Career Development Award and MERIT from the Department of Veterans Affairs.
REFERENCES
- 1.Raichle ME. Circulatory and metabolic correlates of brain function in normal humans. In: Plum F, editor. Handbook of Physiology-The Nervous System V: Higher Functions of the Brain. American Physiological Society; Bethesda: 1987. pp. 643–674. [Google Scholar]
- 2.Pemp B, Schmetterer L. Ocular blood flow in diabetes and age-related macular degeneration. Can J Ophthalmol. 2008;43(3):295–301. doi: 10.3129/i08-049. [DOI] [PubMed] [Google Scholar]
- 3.Pournaras CJ, Rungger-Brandle E, Riva CE, Hardarson SH, Stefansson E. Regulation of retinal blood flow in health and disease. Prog Retin Eye Res. 2008;27(3):284–330. doi: 10.1016/j.preteyeres.2008.02.002. [DOI] [PubMed] [Google Scholar]
- 4.Preussner PR, Richard G, Darrelmann O, Weber J, Kreissig I. Quantitative measurement of retinal blood flow in human beings by application of digital image-processsing methods to television fluorescein angiograms. Graefes Arch Clin Exp Ophthalmol. 1983;221:110–112. doi: 10.1007/BF02133848. [DOI] [PubMed] [Google Scholar]
- 5.Guyer DR, Yannuzzi LA, Slakter JS, Sorenson JA, Orlock S. The status of indocyanine-green videoangiography. Cur Opin Ophthalmol. 1993;4:3–6. doi: 10.1097/00055735-199306000-00002. [DOI] [PubMed] [Google Scholar]
- 6.Formaz F, Riva CE, Geiser M. Diffuse luminance flicker increases retinal vessel diameter in human. Current eye research. 1997;16:1252–1257. doi: 10.1076/ceyr.16.12.1252.5021. [DOI] [PubMed] [Google Scholar]
- 7.Cheng H, Duong TQ. Simplified laser-speckle-imaging analysis method and its application to retinal blood flow imaging. Opt Lett. 2007;32:2188–2190. doi: 10.1364/ol.32.002188. [DOI] [PMC free article] [PubMed] [Google Scholar]
- 8.Cheng H, Yan Y, Duong TQ. Temporal Statistical Analysis of Laser Speckle Image and its Application to Retinal Blood-Flow Imaging. Optics Express. 2008;16:10214–10219. doi: 10.1364/oe.16.010214. [DOI] [PMC free article] [PubMed] [Google Scholar]
- 9.Ostergaard L, Sorensen AG, Kwong KK, Weisskoff RM, Gyldensted C, Rosen BR. High resolution measurement of cerebral blood flow using intravascular tracer bolus passages. Part II: Experimental comparison and preliminary results. Magn Reson Med. 1996;36(5):726–736. doi: 10.1002/mrm.1910360511. [DOI] [PubMed] [Google Scholar]
- 10.Detre JA, Leigh JS, Williams DS, Koretsky AP. Perfusion imaging. Magn Reson Med. 1992;23:37–45. doi: 10.1002/mrm.1910230106. [DOI] [PubMed] [Google Scholar]
- 11.Calamante F, Thomas DL, Pell GS, Wiersma J, Turner R. Measuring cerebral blood flow using magnetic resonance imaging techniques. J Cereb Blood Flow Metab. 1999;19:701–735. doi: 10.1097/00004647-199907000-00001. [DOI] [PubMed] [Google Scholar]
- 12.Williams DS, Detre JA, Leigh JS, Koretsky AP. Magnetic resonance imaging of perfusion using spin inversion of arterial water. Proc Natl Acad Sci USA. 1992;89:212–216. doi: 10.1073/pnas.89.1.212. [DOI] [PMC free article] [PubMed] [Google Scholar]
- 13.Li Y, Cheng H, Duong TQ. Blood-flow magnetic resonance imaging of the retina. Neuroimage. 2008;39:1744–1751. doi: 10.1016/j.neuroimage.2007.10.030. [DOI] [PMC free article] [PubMed] [Google Scholar]
- 14.Li Y, Cheng H, Shen Q, Kim M, Thule PM, Olson DE, Pardue MT, Duong TQ. Blood-Flow Magnetic Resonance Imaging of Retinal Degeneration. Invest Ophthalmol Vis Sci. 2009;50:1824–1830. doi: 10.1167/iovs.08-2188. [DOI] [PMC free article] [PubMed] [Google Scholar]
- 15.Alsop DC, Maldjian JA, Detre JA. Internat Soc Magn Reson Med. Denver, CO.: 2000. In vivo MR perfusion imaging of the human retina; p. 162. [Google Scholar]
- 16.Dai W, Garcia D, de Bazelaire C, Alsop DC. Continuous flow-driven inversion for arterial spin labeling using pulsed radio frequency and gradient fields. Magn Reson Med. 2008;60:1488–1497. doi: 10.1002/mrm.21790. [DOI] [PMC free article] [PubMed] [Google Scholar]
- 17.Mani S, Pauly J, Conolly S, Meyer C, Nishimura D. Background suppression with multiple inversion recovery nulling: applications to projective angiography. Magn Reson Med. 1997;37(6):898–905. doi: 10.1002/mrm.1910370615. [DOI] [PubMed] [Google Scholar]
- 18.Buecker A, Adam G, Neuerburg JM, Glowinski A, van Vaals JJ, Guenther RW. MR-guided biopsy using a T2-weighted single-shot zoom imaging sequence (Local Look technique) J Magn Reson Imag. 1998;8:955–959. doi: 10.1002/jmri.1880080426. [DOI] [PubMed] [Google Scholar]
- 19.Cheng H, Nair G, Walker TA, Kim MK, Pardue MT, Thule PM, Olson DE, Duong TQ. Structural and functional MRI reveals multiple retinal layers. Proc Natl Acad Sci USA. 2006;103:17525–17530. doi: 10.1073/pnas.0605790103. [DOI] [PMC free article] [PubMed] [Google Scholar]
- 20.Chalela JA, Alsop DC, Gonzalez-Atavales JB, Maldjian JA, Kasner SE, Detre JA. Magnetic resonance perfusion imaging in acute ischemic stroke using continuous arterial spin labeling. Stroke. 2000;31(3):680–687. doi: 10.1161/01.str.31.3.680. [DOI] [PubMed] [Google Scholar]
- 21.Herscovitch P, Raichle ME. What is the correct value for the brain-blood partition coefficient for water? J Cereb Blood Flow Metab. 1985;5:65–69. doi: 10.1038/jcbfm.1985.9. [DOI] [PubMed] [Google Scholar]
- 22.Lu H, Clingman C, Golay X, van Zijl PC. Determining the longitudinal relaxation time (T1) of blood at 3.0 Tesla. Magn Reson Med. 2004;52:679–682. doi: 10.1002/mrm.20178. [DOI] [PubMed] [Google Scholar]
- 23.Stanisz GJ, Odrobina EE, Pun J, Escaravage M, Graham SJ, Bronskill MJ, Henkelman RM. T1, T2 relaxation and magnetization transfer in tissue at 3T. Magn Reson Med. 2005;54(3):507–512. doi: 10.1002/mrm.20605. [DOI] [PubMed] [Google Scholar]
- 24.Wu WC, Fernandez-Seara M, Detre JA, Wehrli FW, Wang J. A theoretical and experimental investigation of the tagging efficiency of pseudocontinuous arterial spin labeling. Magn Reson Med. 2007;58(5):1020–1027. doi: 10.1002/mrm.21403. [DOI] [PubMed] [Google Scholar]
- 25.Garcia DM, Duhamel G, Alsop DC. Efficiency of inversion pulses for background suppressed arterial spin labeling. Magn Reson Med. 2005;54(2):366–372. doi: 10.1002/mrm.20556. [DOI] [PubMed] [Google Scholar]
- 26.Smith SM, Jenkinson M, Woolrich MW, Beckmann CF, Behrens TE, Johansen-Berg H, Bannister PR, De Luca M, Drobnjak I, Flitney DE, Niazy RK, Saunders J, Vickers J, Zhang Y, De Stefano N, Brady JM, Matthews PM. Advances in functional and structural MR image analysis and implementation as FSL. Neuroimage. 2004;23(Suppl 1):S208–219. doi: 10.1016/j.neuroimage.2004.07.051. [DOI] [PubMed] [Google Scholar]
- 27.Peng Q, Zhang Y, Duong TQ. Proc Internat Soc Magn Reson Med. Stockholm, Sweden: 2010. MRI laminar resolution of the human retina; p. 688. [Google Scholar]
- 28.Liu ZM, Schmidt KF, Sicard KM, Duong TQ. Imaging oxygen consumption in forepaw somatosensory stimulation in rats under isoflurane anesthesia. Magn Reson Med. 2004;52:277–285. doi: 10.1002/mrm.20148. [DOI] [PMC free article] [PubMed] [Google Scholar]
- 29.Sicard KM, Duong TQ. Effects of Hypoxia, Hyperoxia and Hypercapnia on Baseline and Stimulus-Evoked BOLD, CBF and CMRO2 in Spontaneously Breathing Animals. NeuroImage. 2005;25:850–858. doi: 10.1016/j.neuroimage.2004.12.010. [DOI] [PMC free article] [PubMed] [Google Scholar]
- 30.Wang L, Fortune B, Cull G, McElwain KM, Cioffi GA. Microspheres method for ocular blood flow measurement in rats: size and dose optimization. Exp Eye Res. 2007;84:108–117. doi: 10.1016/j.exer.2006.09.005. [DOI] [PubMed] [Google Scholar]
- 31.Alm A, Bill A. Ocular and optic nerve blood flow at normal and increased intraocular pressures in monkeys (Macaca irus): A study with radioactively labelled microspheres including flow determinations in brain and some other tissues. Exp Eye Res. 1973;15:15–29. doi: 10.1016/0014-4835(73)90185-1. [DOI] [PubMed] [Google Scholar]
- 32.Duong TQ, Kim D-S, Ugurbil K, Kim S-G. Localized blood flow response at sub-millimeter columnar resolution. Proc Natl Acad Sci USA. 2001;98:10904–10909. doi: 10.1073/pnas.191101098. [DOI] [PMC free article] [PubMed] [Google Scholar]
- 33.Calamante F, Gadian DG, Connelly A. Quantification of perfusion using bolus tracking magnetic resonance imaging in stroke: assumptions, limitations, and potential implications for clinical use. Stroke. 2002;33(4):1146–1151. doi: 10.1161/01.str.0000014208.05597.33. [DOI] [PubMed] [Google Scholar]
- 34.Duong TQ, Kim D-S, Ugurbil K, Kim S-G. Localized blood flow response at sub-millimeter columnar resolution. Proc Nat Acad Sci. 2001;98:10904–10909. doi: 10.1073/pnas.191101098. [DOI] [PMC free article] [PubMed] [Google Scholar]
- 35.Alm A, Bill A. The oxygen supply to the retina. II. Effects of high intraocular pressure and of increased arterial carbon dioxide tension on uveal and retinal blood flow in cats. Acta Physiologica Scand. 1972;84:306–319. doi: 10.1111/j.1748-1716.1972.tb05182.x. [DOI] [PubMed] [Google Scholar]
- 36.Alm A, Bill A. The oxygen supply to the retina I. Effects of changes in intraocular and arterial blood pressures, and in arterial pO2 and pCO2 on the oxygen tension in the vitreous body of the cat. Acta PhysiolScand. 1972;84:261–274. doi: 10.1111/j.1748-1716.1972.tb05177.x. [DOI] [PubMed] [Google Scholar]
- 37.Friedman E, Chandra SR. Choroidal blood flow, III: effects of oxygen and carbon dioxide. Arch Ophthalmo. 1972;87:70–71. doi: 10.1001/archopht.1972.01000020072015. [DOI] [PubMed] [Google Scholar]
- 38.Cioffi GA, Granstam E, Alm A. Ocular circulation. In: Kaufman PL, Alm A, editors. Adler’s physiologgy of the eye Clinical application. St. Louis: Mosby: 2003. pp. 747–784. [Google Scholar]
- 39.Frayser R, Hickam JB. Retinal vascular response to breathing increased carbon dioxide and oxygen concentrations. Invest Ophthalmol Vis Sci. 1964;3:427–431. [PubMed] [Google Scholar]
- 40.Geiser MH, Riva CE, GDorner GT, Diermann U, Luksch A, Schmetterer L. Response of choroidal blood flow in the foveal region to peroxia and hyperoxia-hypercapnia. Current Eye Res. 2000;21:669–676. [PubMed] [Google Scholar]
- 41.Kergoat H, Faucher C. Effects of oxygen and carbogen breathing on choroidal hemodynamics in humans. Invest Ophthalmol Vis Sci. 1999;40(12):2906–2911. [PubMed] [Google Scholar]
- 42.Sicard K, Shen Q, Brevard ME, Sullivan R, Ferris CF, King JA, Duong TQ. Regional cerebral blood flow and BOLD responses in conscious and anesthetized rats under basal and hypercapnic conditions: implications for functional MRI studies. J Cereb Blood Flow Metab. 2003;23(4):472–481. doi: 10.1097/01.WCB.0000054755.93668.20. [DOI] [PMC free article] [PubMed] [Google Scholar]
- 43.Kuznetsova LV, Tomasek N, Sigurdsson GH, Banic A, Erni D, Wheatley AM. Dissociation between volume blood flow and laser-Doppler signal from rat muscle during changes in vascular tone. Am J Physiol. 1998;274:H1248–1254. doi: 10.1152/ajpheart.1998.274.4.H1248. [DOI] [PubMed] [Google Scholar]
- 44.Shen Q, Cheng H, Chang TF, Nair G, Shonat RD, Pardue MT, Toi VV, Duong TQ. Magnetic resonance imaging of anatomical and vascular layers of the cat retina. J Magn Reson Imaging. 2006;23:465–472. doi: 10.1002/jmri.20549. [DOI] [PMC free article] [PubMed] [Google Scholar]
- 45.Duong TQ, Ngan S-C, Ugurbil K, Kim S-G. Functional magnetic resonance imaging of the retina. Invest Ophthalmol Vis Sci. 2002;43:1176–1181. [PMC free article] [PubMed] [Google Scholar]
- 46.De La Garza B, Li G, Muir E, Shih YY, Duong TQ. BOLD fMRI of Visual Stimulation in the Rat Retina at 11.7 Tesla. NMR in Biomedicine. 2010 doi: 10.1002/nbm.1571. in press. [DOI] [PMC free article] [PubMed] [Google Scholar]