

Abstract
Obesity is associated with lower brain volumes in early Alzheimer’s disease, but its effects on hippocampal volumes are unclear, as weight loss is also associated with Alzheimer’s disease. To address this question, we applied an automated hippocampal mapping method to brain MRI scans for 162 patients with Alzheimer’s disease. We hypothesized that obesity, measured by body mass index, would be associated with lower hippocampal volumes in mildly affected patients. Statistical maps showed a selective pattern of hippocampal volume differences that were significantly associated with body mass index. Associations were detected in the anterior hippocampus, and confirmed by permutation testing. Cardiovascular risk factors, such as high body mass index, may promote additional neurodegenerative changes, and should therefore be considered in epidemiological studies and clinical trials.
Keywords: Alzheimer’s disease, body mass index, brain structure hippocampus
Introduction
Alzheimer’s disease is the most common cause of dementia in the elderly. The hippocampus, the key brain system responsible for memory function, is frequently atrophic in the disorder [1], with a regionally specific pattern of atrophy, typically beginning in the entorhinal and transentorhinal cortices but progressing to the whole hippocampus [2]. Understanding potential contributors to hippocampal atrophy will lend insight into the pathophysiology of Alzheimer’s disease, and into the preventable risk factors that influence its development or expression.
Earlier our group found that overweight and obesity, as reflected in higher body mass index (BMI), are associated with a distributed pattern of brain atrophy not only in cognitively normal elders but also in mild cognitive impairment and in Alzheimer’s disease [3,4]. Given this relationship, which for the Alzheimer’s group was replicated in two independent cohorts, we sought to understand which specific hippocampal differences were associated with the BMI in Alzheimer’s disease.
Despite our earlier findings that higher BMI is correlated with lower brain volumes in patients with cognitive impairments, there is strong evidence that low weight and rapid weight loss are associated with dementia progression. The loss of BMI, specifically weight loss, is not only associated with Alzheimer’s disease, but also with a fall in the healthcare and selfcare as the disease progresses [5-7]. It is not known how obesity relates to hippocampal deficits in Alzheimer’s disease. Higher BMI is associated with brain atrophy in the healthy elderly. Eventually brain atrophy and BMI are inversely correlated as the disease begins to erode both the brain mass and body mass.
To better understand the role of BMI as a risk factor for Alzheimer’s disease, we hypothesized that higher BMI would be related to lower hippocampal volume in individuals with clinically mild Alzheimer’s disease. If this is true, some of the atrophy may be preventable in principle, and the BMI should be considered in evaluating treatments to resist hippocampal atrophy. We further hypothesized that obesity-related hippocampal atrophy in Alzheimer’s disease would target the anterior hippocampus, which is affected by Alzheimer’s pathology and neuronal loss earlier than the posterior hippocampus and fornix.
This is in contrast to normal age-related atrophy, which typically targets the posterior hippocampal tail [2]. Investigating the determinants of hippocampal differences in a population of Alzheimer’s patients will provide further evidence on how adiposity may play a role in the presentation and anatomy of Alzheimer’s disease.
Materials and methods
Patients
We analyzed 162 baseline MRI scans from the Alzheimer’s Disease Neuroimaging Initiative (ADNI) public database. ADNI is a study that was launched in 2004 by the National Institute on Aging, the National Institute of Biomedical Imaging and Bioengineering, the Food and Drug Administration, private pharmaceutical companies, and nonprofit organizations, as a 5-year public–private partnership. All data obtained for this study are available in public (www.loni.ucla.edu/ADNI/). The study was conducted according to the Good Clinical Practice guidelines, the Declaration of Helsinki, and US 21 CFR Part 50–Protection of Human Subjects, and Part 56–Institutional Review Boards. A written informed consent was obtained from all participants before protocol-specific procedures were performed.
We analyzed the ADNI patients who met the following criteria: (i) baseline scans were available on the ADNI public database on 25 June 2009 (the date of download), (ii) had height and weight measurements taken at the time of the baseline scan, and (iii) were diagnosed with probably Alzheimer’s disease based on standard clinical and cognitive criteria at the time of baseline scan. At the date of download, the database included all baseline scans (Alzheimer’s patients, n = 200). Of the available 200 patients, 162 met the inclusion criteria for our study as 38 lacked height or weight data for BMI calculations (see Table 1).
Table 1. Demographics for the patients with Alzheimer’s disease.
| Sample size (n) | 162 (89 male/73 female) (mean ± SD) |
|---|---|
| Age (years) | 74.73 ± 7.34 |
| Body mass index (BMI) | 25.34 ± 3.88 |
| Education (years) | 14.75 ± 3.15 |
| Mini mental state exam (MMSE) | 23.41 ± 1.99 |
All patients underwent clinical and cognitive evaluations at the time of their MRI scan including the mini-mental state examination (MMSE) (Table 1). The MMSE, with scores ranging from 0 to 30, is a global measure of mental status based on five cognitive domains [8], with scores below 24 being typically associated with dementia. All the patients with Alzheimer’s disease met the National Institute of Neurological and Communicative Disorders and Stroke and the Alzheimer’s Disease and Related Disorders Association criteria for probable Alzheimer’s disease [9]. On an average, in this study patients with Alzheimer’s disease were considered to have mild-to-moderate, but not severe, Alzheimer’s disease, with mean baseline MMSE scores of 23.41 ± 1.99 points. Detailed inclusion and exclusion criteria can be found in the ADNI protocol [10,11].
All patients had their weight and height measurements taken at the time of their baseline MRI scan. The BMI was calculated using the following formula: weight (lb) × 703/[height (inches)]2 (Table 1).
Magnetic resonance imaging acquisition and preprocessing
High-resolution scans were acquired on 1.5 T scanners from GE, Siemens, or Philips with a standardized MRI protocol [12]. Each scan involved a three-dimensional sagittal magnetization-prepared rapid gradient-echo sequence with the following parameters: repetition time (2400 ms), flip angle (8°), inversion time (1000 ms), 24 cm field of view, a 192 × 192 × 166 acquisition matrix, a voxel size of 1.25 × 1.25 × 1.2 mm3, later reconstructed to 1 mm isotropic voxels. For details on image corrections used in the processing pipeline at the Mayo Clinic, please refer to [13].
To adjust global differences in brain positioning and scale, all scans were linearly registered to the International Consortium for Brain Mapping template [14] with a nine-parameter transformation using the Minctracc algorithm. Globally aligned images were resampled in an isotropic space of 220 voxels along each axis (x, y, and z) with a final voxel size of 1 mm3.
Hippocampal tracing
Hippocampi from 21 ADNI patients were delineated by a trained neuroanatomist using the Brainsuite software program (http://brainsuite.usc.edu/) to generate individual binary masks for the left hippocampus and right hippocampus. The cornu ammonis (CA1, CA2, and CA3), dentate gyrus, and parts of the uncus penetrated by the cornu ammonis were included; the subiculum was excluded. The detailed protocol for tracing the hippocampus may be found in the online supplementary material (Supplemental digital content 1, http://links.lww.com/WNR/A94). The initial tracings were validated in an earlier study [15] with two independent raters reliably delineating the hippocampus in 21 patients. As reported there, the relative volume overlap between two human raters was on an average 74.9% for the left and 74.3% for the right hippocampus, while the relative overlap between the algorithms and a rater not involved in training was 75.4% for the left and 71.9% for the right hippocampus. In terms of precision, the agreement between the two human raters is approximately 3% higher than the agreement between the algorithm and the rater not used to train it, with all values in the range of 83–89%. This shows that the errors in our algorithm are comparable with the differences between the two human raters.
Automated segmentation
We used a validated automated segmentation method, based on adaptive boosting (AdaBoost), to extract models of the hippocampus from each registered MRI scan [15]. AdaBoost is a machine learning method that uses a training set of expertly traced hippocampi (described above) to segment a structure in new images [16]. We used a training set of 21 MRI scans (7 patients with Alzheimer’s disease, 7 patients diagnosed with mild cognitive impairment, and 7 controls) to produce automated segmentations of the large testing set of 726 MRI scans; scans of only Alzheimer’s patients were analyzed in this study. The algorithm uses x, y, and z coordinates, image curvature, and image intensities and gradients in the training set scans to classify each voxel as hippocampus or nonhippocampus. The AdaBoost method incorporates approximately 18 000 features including intensity, position, gray/white matter, and cerebrospinal fluid tissue classifications. Images used in the training set were excluded from all analyses presented here.
Volumetric analysis
We used the automated segmentations to determine the left and right hippocampal volumes for each patient. Using these values, we calculated the mean volume of each hemisphere for each diagnostic group to test for group and hemispheric differences.
Statistical maps
Automatically generated segmentations of each individual’s hippocampi were converted into three-dimensional parametric surface maps using anatomical surface modeling software [17]. A three-dimensional medial curve was calculated from the centroid of each hippocampus. The radial distance from this medial axis to each surface point in the three-dimensional surface mesh was used to measure local atrophy [18]. Surface models of each individual’s hippocampi were then analyzed to create statistical maps indicating where the local volumetric differences were correlated with the BMI [18], based on a multiple regression at each surface point, after controlling for age and sex. Regions showing positive and negative associations were distinguished.
Color-coded P values describing the significance of differences in radial distances associated with the BMI were plotted onto average surface models. This allowed for a three-dimensional visualization of the point-wise significance level. All correlations were corrected for multiple comparisons using permutation tests, which provided an overall significance value for each statistical map. A primary significance threshold of P less than 0.01 was enforced for all significance maps. We then compared the suprathreshold area with a null distribution for this same area, estimated from 100 000 random permutations of the covariates [19].
Results
Our volumetric analysis showed three main findings: (i) the BMI was negatively correlated with hippocampal volume in patients with Alzheimer’s disease, (ii) the effects of the BMI on the hippocampal structure were regionally specific, targeting the anterior hippocampus, and (iii) in post-hoc tests, total hippocampal volumes were not significantly different among the standard BMI categories, despite numerically smaller mean volumes in the obese and overweight versus healthy BMI groups, respectively (Fig. 1, Table 2; P = 0.13 using analysis of variance). This suggests that there is more power to detect associations when the BMI is treated as a continuous variable, rather than dichotomized into the three traditionally used categories (normal, overweight, obese).
Fig. 1.
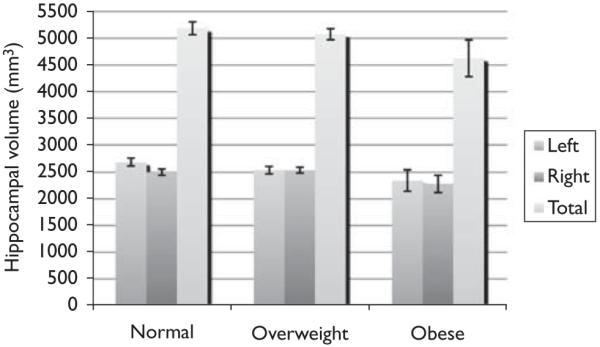
Average hippocampal volumes [(millimeter)3] are shown for 162 patients with Alzheimer’s disease. Error bars denote standard errors of the mean. Left, right, and total hippocampal volumes are graphed for normal, overweight, and obese groups.
Table 2. Mean hippocampal volumes are shown as mean values (and standard deviation), in cubic millimeters, for people in the three conventionally used body mass categories.
| Hippocampus | Healthy BMI (N = 82) | Overweight (N = 64) | Obese (N = 16) |
|---|---|---|---|
| Right side | 2502 (543) | 2536 (424) | 2280 (636) |
| Left side | 2683 (632) | 2539 (565) | 2342 (803) |
| Total | 5185 (1069) | 5076 (818) | 4623 (1376) |
BMI, body mass index.
The three-dimensional maps showed the hippocampal regions where atrophy was statistically associated with the BMI (Fig. 2). White and red colors indicate lower hippocampal volume in those with higher BMI (P < 0.05, uncorrected). Negative correlations between the BMI and hippocampal volume were significant for the left (Fig. 2; P = 0.0084, corrected) and right (Fig. 2; P = 0.0477, corrected) hippocampi. Positive correlations between the BMI and hippocampal volume were not statistically significant and are therefore not shown. The anterior region of the hippocampus, especially on the bottom half of the left side, was strongly associated with BMI whereas the most posterior region of the right side was not detectably related to BMI.
Fig. 2.
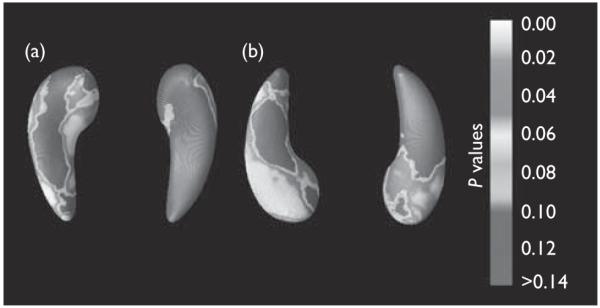
Three-dimensional maps show local differences in hippocampal structure associated with BMI in 162 patients with Alzheimer’s disease. (a) Shows the top view of the hippocampi, and (b) shows the view from below. The left hippocampus is on the left side of each pair.
Discussion
Overweight and obesity, as measured with BMI, were associated with regionally specific atrophy in the anterior hippocampus. This is an important finding for several reasons. First, it suggests that generalized BMI related atrophy, which we have identified in the earlier work, may also be localized to specific regions of the hippocampus. This explains some of the atrophy that is a characteristic neuroimaging signature of Alzheimer’s disease [4,20]. The specificity of this atrophy is notable as it targets the anterior hippocampus, which is affected in the early course of Alzheimer’s disease [21]. The anterior hippocampus may have been the place where more effects were detected because of the greater age-related and disease-related variabilities in that part of the structure. Patients with Alzheimer’s disease are more likely to show differences (and have greater variance as a group) in the anterior hippocampus because of the underlying disease process. Some studies report considerable age-related variation in the posterior hippocampus, distinct from the effects of Alzheimer’s pathology [2,22]. Even so, the posterior hippocampal structure is generally affected later in Alzheimer’s disease. As such, we would not expect to see BMI to correlate strongly with posterior hippocampal anatomy in either normal aging or in Alzheimer’s disease. The anatomic variance in the anterior hippocampus of our participants with Alzheimer’s disease may also be some-what less than in other cohorts with Alzheimer’s disease, as our patients were so early in their disease course, that is, with an average MMSE of 23.4 points.
Second, our findings add to the growing evidence that higher BMI may contribute to the atrophy caused by Alzheimer’s disease pathology. A higher BMI over the lifespan likely reflects a poorer cardiovascular health and a poorer diet, which may compound the brain atrophy because of Alzheimer’s disease. Midlife obesity is associated with future cognitive decline and Alzheimer’s risk [23]. Our patients had mild Alzheimer’s disease, as they were well-enough to participate in an imaging study. Inevitably, those with end-state dementia are often frail, have low BMI, and may not maintain minimally adequate caloric intake [24]. Consequently, the associations found here may be typical of early but not late Alzheimer’s disease, where the advancing disease may eventually promote loss in body and brain mass, causing a positive association between BMI and brain atrophy. As such, these results may be most relevant for those who are early in the course of Alzheimer’s pathophysiology.
Although associations between BMI and hippocampal volumes were significant in patients with Alzheimer’s disease, this relationship was not found in 204 matched healthy control participants from the same dataset (results not shown). If BMI only correlates with anterior hippocampal volume in patients with Alzheimer’s disease, cardiovascular risk factors may be compounding the level of atrophy caused by the disease, and may be affecting the brain’s ability to resist disease-related atrophy; this is plausible if high BMI causes neurovascular insufficiency. The BMI effect may not be detectable in healthy controls; further studies with larger samples are needed to confirm this.
We also investigated if cognitive scores from the MMSE differed among BMI groups, but there was no significant group difference (P value = 0.35, F statistic = 1.057). The MMSE is a clinical measure of the global cognitive function that is in many ways an outcome measure of the hippocampal volume [15,25]. That is, when hippocampal volume shrinks, it is often because of the underlying neuronal pathology, which leads to cognitive decline and results with a reduced MMSE score. Thus, adjusting for differences in MMSE scores in BMI studies and hippocampal volume may be difficult as MMSE tends to track hippocampal volume and is highly correlated with it, especially in disease.
Finally, this study shows how the radial atrophy mapping in the hippocampus can complement other whole-brain mapping techniques such as tensor-based morphometry in providing greater specificity on structural brain differences. Future studies may benefit from this approach, using tensor-based morphometry to identify atrophic regions that may then be examined in greater detail with structure-specific mapping methods.
The main strengths of this study were a well-defined cohort, high resolution MRI scans of the brain, and well-validated computational methods. The main weakness is lack of longitudinal information to determine whether obesity-related anterior hippocampal atrophy preceded clinical Alzheimer’s in the same patients. As the ADNI has a longitudinal design, studies relating BMI to atrophic rates over time will be possible in the future.
Conclusion
We have shown here that increased BMI is associated with specific anterior hippocampal atrophy in Alzheimer’s disease. This work has substantial importance in understanding Alzheimer’s pathophysiology, and in highlighting lifestyle modifications to resist factors such as high BMI that may promote the magnitude of atrophy in the brain.
Supplementary Material
Footnotes
Supplemental digital content is available for this article. Direct URL citations appear in the printed text and are provided in the HTML and PDF versions of this article on the journal’s Website (www.neuroreport.com).
Cyrus A. Raji and April J. Ho have contributed equally to this study
References
- 1.Laakso MP, Hallikainen M, Hanninen T, Partanen K, Soininen H. Diagnosis of Alzheimer’s disease: MRI of the hippocampus vs. delayed recall. Neuropsychologia. 2000;38:579–584. doi: 10.1016/s0028-3932(99)00111-6. [DOI] [PubMed] [Google Scholar]
- 2.Raji CA, Lopez OL, Kuller LH, Carmichael OT, Becker JT. Age, Alzheimer’s disease, and brain structure. Neurology. 2009;22:1899–1905. doi: 10.1212/WNL.0b013e3181c3f293. [DOI] [PMC free article] [PubMed] [Google Scholar]
- 3.Ho AJ, Raji CA, Becker JT, Lopez OL, Kuller LW, Hua X, et al. Obesity is linked with lower brain volume in 700 AD and MCI patients. Neurobiol Aging. 2010;31:1326–1339. doi: 10.1016/j.neurobiolaging.2010.04.006. [DOI] [PMC free article] [PubMed] [Google Scholar]
- 4.Raji C, Ho A, Parikshak N, Becker J, Lopez O, Kuller L, et al. Brain structure and obesity. Hum Brain Mapp. 2010;31:353–364. doi: 10.1002/hbm.20870. [DOI] [PMC free article] [PubMed] [Google Scholar]
- 5.Barrett-Connor E, Edelstein S, Corey-Bloom J, Wiederholt W. Weight loss precedes dementia in community-dwelling older adults. J Nutr Health Aging. 1998;2:113–114. [PubMed] [Google Scholar]
- 6.Buchman AS, Wilson RS, Bienias JL, Shah RC, Evans DA, Bennett DA. Change in body mass index and risk of incident Alzheimer disease. Neurology. 2005;65:892–897. doi: 10.1212/01.wnl.0000176061.33817.90. [DOI] [PubMed] [Google Scholar]
- 7.Wang SY. Weight loss and metabolic changes in dementia. J Nutr Health Aging. 2002;6:201–205. [PubMed] [Google Scholar]
- 8.Cockrell JR, Folstein MF. Mini-mental state examination (MMSE) Psychopharmacol Bull. 1988;24:689–692. [PubMed] [Google Scholar]
- 9.McKhann G, Drachman D, Folstein M, Katzman R, Price D, Stadlan EM. Clinical diagnosis of Alzheimer’s disease: report of the NINCDS-ADRDA Work Group under the auspices of Department of Health and Human Services Task Force on Alzheimer’s Disease. Neurology. 1984;34:939–944. doi: 10.1212/wnl.34.7.939. [DOI] [PubMed] [Google Scholar]
- 10.Mueller SG, Weiner MW, Thal LJ, Petersen RC, Jack C, Jagust W, et al. The Alzheimer’s disease neuroimaging initiative. Neuroimaging Clin N Am. 2005;15:869–877. xi–xii. doi: 10.1016/j.nic.2005.09.008. [DOI] [PMC free article] [PubMed] [Google Scholar]
- 11.Mueller SG, Weiner MW, Thal LJ, Petersen RC, Jack CR, Jagust W, et al. Ways toward an early diagnosis in Alzheimer’s disease: The Alzheimer’s Disease Neuroimaging Initiative (ADNI) Alzheimers Dement. 2005;1:55–66. doi: 10.1016/j.jalz.2005.06.003. [DOI] [PMC free article] [PubMed] [Google Scholar]
- 12.Jack CR, Jr, Bernstein MA, Fox NC, Thompson P, Alexander G, Harvey D, et al. The Alzheimer’s Disease Neuroimaging Initiative (ADNI): MRI methods. J Magn Reson Imaging. 2008;27:685–691. doi: 10.1002/jmri.21049. [DOI] [PMC free article] [PubMed] [Google Scholar]
- 13.Ho AJ, Stein JL, Hua X, Lee S, Hibar DP, Leow A, et al. Commonly carried allele within FTO, an obesity-associated gene, relates to accelerated brain degeneration in the elderly. Proc Natl Acad Sci U S A. 2009;107:8404–8409. doi: 10.1073/pnas.0910878107. [DOI] [PMC free article] [PubMed] [Google Scholar]
- 14.Mazziotta J, Toga A, Evans A, Fox P, Lancaster J, Zilles K, et al. A probabilistic atlas and reference system for the human brain: International Consortium for Brain Mapping (ICBM) Philos Trans R Soc Lond B Biol Sci. 2001;356:1293–1322. doi: 10.1098/rstb.2001.0915. [DOI] [PMC free article] [PubMed] [Google Scholar]
- 15.Morra JH, Tu Z, Apostolova LG, Green AE, Avedissian C, Madsen SK, et al. Validation of a fully automated 3D hippocampal segmentation method using subjects with Alzheimer’s disease mild cognitive impairment, and elderly controls. Neuroimage. 2008;43:59–68. doi: 10.1016/j.neuroimage.2008.07.003. [DOI] [PMC free article] [PubMed] [Google Scholar]
- 16.Freund Y, Schapire RE. A decision-theoretic generalization of online learning and an application to boosting. J Comput Sys Sci. 1997;55:119–139. [Google Scholar]
- 17.Thompson PM, Schwartz C, Toga AW. High-resolution random mesh algorithms for creating a probabilistic 3D surface atlas of the human brain. Neuroimage. 1996;3:19–34. doi: 10.1006/nimg.1996.0003. [DOI] [PubMed] [Google Scholar]
- 18.Thompson PM, Hayashi KM, De Zubicaray GI, Janke AL, Rose SE, Semple J, et al. Mapping hippocampal and ventricular change in Alzheimer disease. Neuroimage. 2004;22:1754–1766. doi: 10.1016/j.neuroimage.2004.03.040. [DOI] [PubMed] [Google Scholar]
- 19.Thompson PM, Hayashi KM, De Zubicaray G, Janke AL, Rose SE, Semple J, et al. Dynamics of gray matter loss in Alzheimer’s disease. J Neurosci. 2003;23:994–1005. doi: 10.1523/JNEUROSCI.23-03-00994.2003. [DOI] [PMC free article] [PubMed] [Google Scholar]
- 20.Jack CR, Jr, Petersen RC, Xu Y, O’Brien PC, Smith GE, Ivnik RJ, et al. Rate of medial temporal lobe atrophy in typical aging and Alzheimer’s disease. Neurology. 1998;51:993–999. doi: 10.1212/wnl.51.4.993. [DOI] [PMC free article] [PubMed] [Google Scholar]
- 21.Braak H, Braak E. Neuropathological stageing of Alzheimer-related changes. Acta Neuropathol. 1991;82:239–259. doi: 10.1007/BF00308809. [DOI] [PubMed] [Google Scholar]
- 22.La Joie R, Fouquet M, Mézenge F, Landeu B, Villain N, Mevel K, et al. Differential effect of age on hippocampal subfields assessed using a new high-resolution 3T MR sequence. Neuroimage. 2010;53:506–514. doi: 10.1016/j.neuroimage.2010.06.024. [DOI] [PubMed] [Google Scholar]
- 23.Gustafson D, Rothenberg E, Blennow K, Steen B, Skoog I. An 18-year follow-up of overweight and risk of Alzheimer disease. Arch Intern Med. 2003;163:1524–1528. doi: 10.1001/archinte.163.13.1524. [DOI] [PubMed] [Google Scholar]
- 24.Chui HC, Teng EL, Henderson VW, Moy AC. Clinical subtypes of dementia of the Alzheimer type. Neurology. 1985;35:1544–1550. doi: 10.1212/wnl.35.11.1544. [DOI] [PubMed] [Google Scholar]
- 25.Wolz R, Heckemann RA, Aljabar P, Hajnal JV, Hammers A, Lotjonen J, et al. Measurement of hippocampal atrophy using 4D graph-cut segmentation: application to ADNI. Neuroimage. 2010;52:109–118. doi: 10.1016/j.neuroimage.2010.04.006. [DOI] [PubMed] [Google Scholar]
Associated Data
This section collects any data citations, data availability statements, or supplementary materials included in this article.