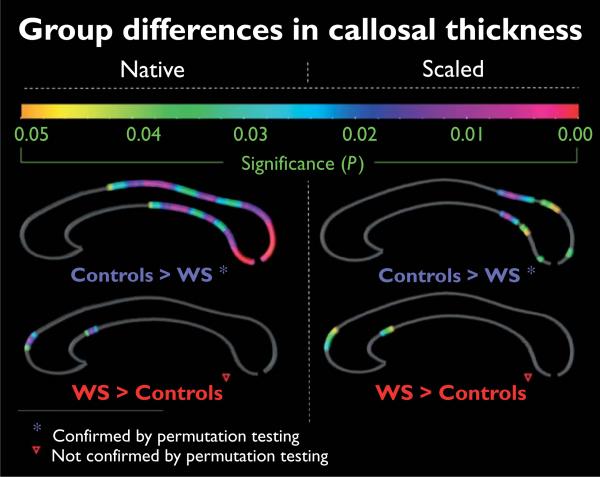
Fig. 3.
Group differences in callosal thickness. Illustrated are regions of significant differences in callosal thickness between Williams syndrome (WS) patients and controls. The color bar encodes the P value associated with the t-test performed at each distance value from upper and lower callosal boundaries. Permutation tests were significant for the comparison of controls > WS (both in native and scaled space), but not significant for the findings of WS > controls. Results shownin the left panelare based on analyses in native space; findings on the right refer to scaled space.

