Abstract
Purpose
To implement solid state 31P MRI (31P SMRI) in a clinical scanner to visualize bone mineral.
Materials and Methods
Wrists of seven healthy volunteers were scanned. A quadrature wrist 31P transmit/receive coil provided strong B1 and good signal-to-noise ratio (SNR). A 1H-31P frequency converter was constructed to enable detection of the 31P signal via the 1H channel. Data points lost in the receiver dead time were recovered by a second acquisition with longer dwell time and lower gradient strength.
Results
Three dimensional 31P images, showing only bone mineral of the wrist, were obtained with a clinical 3T scanner. In the best overall case an image with isotropic resolution of ~5.1 mm and SNR of 30 was obtained in 37 min. 31P NMR properties (resonance line width 2 kHz and T1 17–19 s) of in vivo human bone mineral were measured.
Conclusion
In vivo 31P SMRI visualization of human wrist bone mineral with a clinical MR scanner is feasible with suitable modifications to circumvent the scanners’ limitations in reception of short-T2 signals. Frequency conversion methodology is useful for implementing 31P SMRI measurements on scanners which do not have multinuclear capability or for which the multinuclear receiver dead time is excessive.
Keywords: bone, solid state MRI, 31P SMRI, UTE, osteoporosis, WASPI
INTRODUCTION
Osteoporosis affects roughly 10 million Americans over the age of 50 (1). In osteoporosis, resorbed bone is replaced by a lesser volume of normal bone, causing the loss of trabecular connectivity and an increase in cortical porosity. This results in serious long-term disability and death for a significant number of patients. Measurement of areal bone mineral density (BMD) and the associated T score by Dual Energy X-ray Absorptiometry (DXA) is presently the standard method for diagnosing osteoporosis. However, the areal BMD measured by DXA is dependent on bone size and does not distinguish between cortical and trabecular bone. Even though Quantitative Computed Tomography (QCT) and peripheral QCT (pQCT) enable the volumetric scans of skeletal sites and provide separate information on cortical and trabecular bone, the significantly larger dose of ionizing radiation associated with QCT and its higher cost compared to DXA restricts its use in routine clinical screening (2, 3); pQCT is relatively new and clinical experience with it is limited.
Magnetic resonance imaging can provide true three-dimensional volumetric measurement while completely avoiding exposure of the subject to ionizing radiation. However, the very short T2 and broad resonance of MR signals from 31P nuclei in bone mineral and protons in solid bone matrix make the MRI measurement difficult. Recently, three MRI methods that address these difficulties have been developed, namely, Ultra short TE (UTE) imaging (4–6); Solid State MRI (31P SMRI for its 31P version (7,8) and water and fat suppressed projection imaging, WASPI, for its 1H version (8–10)); and Sweep Imaging with Fourier Transformation (SWIFT) (11, 12). The 3D versions of these methods employ radial acquisition of free induction decays (FIDs). Two dimensional UTE uses slice selective half RF pulses and 2D radial acquisition of FIDs. Both 3D UTE and SMRI sequences employ non-selective RF excitation. The major difference between 3D UTE and SMRI is the timing of the RF excitation pulse relative to the projection gradient pulses and the sampling of the FID under either a rising gradient (UTE) or a constant gradient (SMRI). In UTE, the RF excitation pulse is applied before the projection gradients, while in SMRI, the projection gradient is applied and stabilized before an RF excitation pulse. These differences make SMRI more suitable for imaging short T2 signals (13). In the SWIFT sequence, the excitation pulse is divided into N sub-pulses with amplitude and frequency modulations equivalent to an adiabatic sweep through resonance, making possible the excitation of broad resonances with limited RF power. The data acquisition is performed immediately after each sub-pulse under a constant gradient, which is turned on before the first sub-pulse and kept constant until the end of the last data acquisition.
It has previously been shown in ex vivo bone specimens that solid state 31P MRI is as good as or better than DXA in measuring bone mineral density by validation against chemical analysis (7). That study utilized a Spectroscopy Imaging Systems (Varian/SISCO, Palo Alto, CA, USA) spectrometer, which includes solid state MR imaging and spectroscopy among its repertoire of measurements. A subsequent study demonstrated that it was possible, using a Bruker (Karlsruhe, Germany) electronics console interfaced to a clinical magnet, to obtain solid state 31P MR images of human volunteers (14). As a first step toward translating solid state MRI into a practical clinical tool, in the present study we implemented 31P SMRI in a Siemens 3T Trio scanner. The special considerations involved in acquiring very short T2 signals on a clinical MR scanner are discussed.
MATERIALS AND METHODS
Hydroxyapatite Phantoms, Bone Samples, and Study Subjects
All animal and human images were obtained in full compliance with federal regulations and the guidelines of the respective clinical research committees of the relevant institutions.
Hydroxyapatite powder (Aldrich Chemical Company, Inc, Milwaukee, WI, USA) was densely packed into plastic tubes (inside diameter 14 mm, length 40 mm) and used in phantoms for assessing SNR and spatial resolution. To analyze the image resolution, two such tubes were bound together with a plastic spacer between them to create a resolution phantom. The space separating the two HA columns (taking into account the tube wall thickness and the spacer) was 2.9 mm.
Whole pig legs, disarticulated at the knee, were obtained from ~3 month old Yorkshire pigs (Animal Research, Children’s Hospital, Boston, MA, USA) following euthanasia of the animal. The legs were intact and kept frozen until scanned by MRI to test imaging protocols.
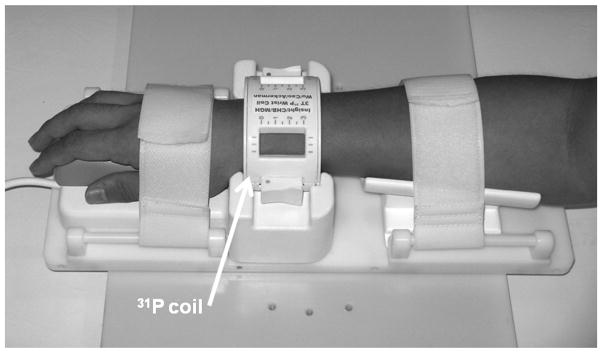
Seven healthy volunteers (5 males and 2 females), ages 28–60 years, participated in this study. During MRI scanning, the volunteer lay still in the scanner, with the right or left wrist (their choice) positioned at about 15° to B0 in the horizontal plane (for comfort) inside a 31P MRI transmit/receive quadrature birdcage coil from InsightMRI (Leominster, MA, USA). The coil package includes a fixturing system for comfortably constraining the wrist (Fig. 1) and an enclosure containing a quadrature hybrid transmit/receive switch and a low noise narrowband preamplifier. The coil has an elliptical shape to better conform to the shape of the human wrist. The shape and relatively tight fit permits a high filling factor to maximize the signal-to-noise ratio. The coil was designed to be positioned near the isocenter of the magnet (to simplify the radial reconstruction), without compromising patient comfort (and causing involuntary movements due to pressure points). To securely hold the patient’s arm, a unique fixturing system was developed to secure the hand and forearm, thereby indirectly, though securely, fixing the position of the wrist. 31P spectra, T1 measurements, and images of bone mineral were acquired with three pulse sequences: single pulse, progressive saturation, and SMRI (acquisition of FIDs and 3D radial coverage of k-space), respectively.
Figure 1.
A 31P quadrature low pass birdcage transmit/receive coil for human wrist imaging. The enclosure containing the passive T/R switch, quadrature hybrid, preamplifier and scanner interface is not shown.
The detailed SMRI method is described in (7). Briefly, this method utilizes a projection MRI pulse sequence consisting of a single, fixed-amplitude magnetic field gradient pulse, during which an excitation RF pulse is issued after a suitable delay following the start of the gradient pulse to allow eddy currents to decay. The free induction decay (FID) is acquired as soon as possible after the RF pulse. This sequence is repeated for a set of gradient directions distributed in a uniform pattern about the unit sphere.
In the following sections, the implementation of the 31P SMRI in a Siemens 3T Trio clinical scanner is described.
MR Signal Excitation
A strong B1 field is required to excite the broad resonance of the solid MR signals, which the body coil of clinical scanners cannot provide. A 31P quadrature low-pass birdcage coil was constructed for human wrist imaging, which provides hard pulses as short as 10 μs for a 10° flip angle and high filling factor for better signal to noise ratio (Fig. 1).
MR Signal Acquisition
In quantitative solid state MR imaging or spectroscopy measurements based on FIDs, it is critical to reduce the receiver dead time to as short a time as possible to minimize distortion or substantial loss of the initial FID samples. The SMRI pulse sequence therefore uses a single very short, intense, rectangular RF excitation pulse with no gradient switching of any kind between the RF pulse and signal acquisition. Sampling of the signal is initiated as soon as possible following the end of the RF pulse. To minimize the delay between the end of the RF pulse and the start of data sampling, the scanner’s lower bound for this delay was reduced from the default value of 20 μs to 10 μs with the assistance of the scanner manufacturer’s engineers. Because no slice selection is possible, a 3D data set must be acquired. To minimize the electronic delay for the switching of the transmit/receive (T/R) switch, the standard PIN diode T/R circuit was eliminated. Transmitter-receiver signal isolation was achieved with the use of a quadrature hybrid connecting the transmitter, receiver and the two ports of the quadrature wrist coil. Additional transmitter isolation was achieved by inserting several stacks of back-to-back 1N914B switching diodes in series with the transmitter output. Just enough diodes were used to completely eliminate any receiver noise. Back-to-back diodes to ground were placed in front of the preamplifier to complete the T/R switch. These diodes are switched passively by the transmit pulse and need no external drive signal; the switching speed is on the order of nanoseconds.
Frequency Converter
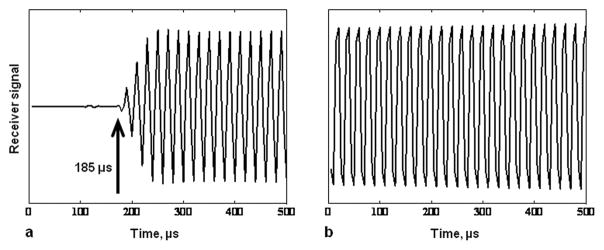
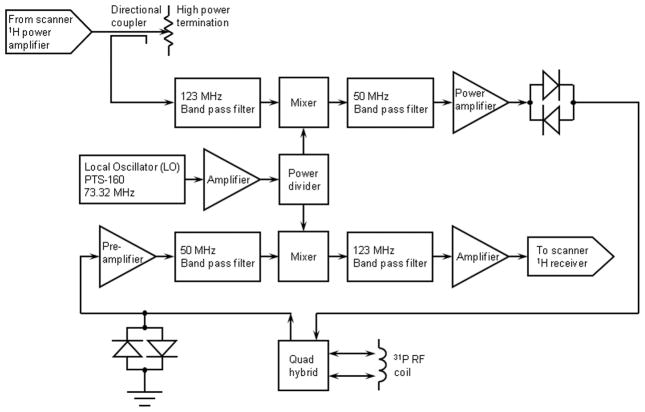
Even with the reduction in the software receiver dead time and elimination of the PIN diode T/R switch, it was initially found that the intrinsic receiver recovery time of the 31P channel of the scanner is over 200 μs, far too long for SMRI (Fig. 2a). This is intrinsic to the design of the multinuclear receiver channel and/or the digital signal processing (it is similar for other heteronuclei as well). A frequency converter was therefore developed to excite and observe the 31P signal through the 1H channel, taking advantage of the very short receiver recovery time of the 1H channel. Details of this design are presented in Fig. 3. The 1H transmit pulse from the scanner is directed into a Bird Electronic (Solon, OH, USA) 50 ohm high power termination, sampled with a Bird Electronic RF directional coupler (with an RF rather than DC output). The sampled 1H transmitter pulse is mixed with a local oscillator (LO) frequency to translate the pulse to the 31P frequency with all amplitude and phase characteristics preserved. The 31P pulse is amplified by an Electronic Navigation Industries (Rochester, NY, USA) LPI-10 RF power amplifier (1 kW maximum output) and sent to the coil for 31P MR excitation. The LO frequency is provided by a Programmed Test Sources (Littleton, MA, USA) PTS-160 frequency synthesizer phased locked to the 10 MHz reference clock of the scanner. The external RF power amplifier is gated (blanked) by the pulse sequence to suppress the noise from the RF power amplifier final stage. The unblanking pulse is timed to allow enough time prior to the RF pulse for the RF power amplifier to reach full gain, and following the RF pulse to squelch amplifier noise in time for the switching transients to die away before data is acquired. The timings must take into account the small but significant differential delays between the RF and digital logic channels of the scanner and frequency converter circuitry. The 31P MR signal is amplified, mixed with the local oscillator frequency to translate it to the 1H frequency, again with all amplitude and phase characteristics preserved. The signal is then applied to the scanner 1H receiver. Although this bypasses the standard SAR monitoring of the scanner, careful testing of the RF coil prior to IRB approval of the study demonstrated that the SAR is very small (the 31P frequency is well below the 1H frequency and the pulse sequence has a low mean RF power level).
Figure 2.
Scanner receiver dynamic response to a continuous RF signal from a synthesizer. a. The response of the 31P channel of the Siemens Trio 3T scanner receiver to which a continuous wave fixed amplitude signal was applied from a synthesizer. The attenuated output of the synthesizer was applied to the point at which the RF coil is connected, the transmitter was disconnected, and an acquisition was conducted. The receiver is completely blocked 185 μs after the receiver was turned on and is completely recovered after about 275 μs. b. Using the frequency converter scheme which detects the 31P signal via the proton channel of the scanner (see the text and Figure 3), receiver blocking is reduced to about 5 μs.
Figure 3.
Simplified schematic block diagram of the frequency converter circuit for 31P SMRI. A 1H transmit pulse from the scanner is mixed with a local oscillator (LO) frequency from an external synthesizer to translate the pulse to the 31P frequency, which is amplified by an external RF power amplifier and sent to the coil for 31P excitation. The 31P MR signal detected by the coil is amplified by a low noise narrow band preamplifier, mixed with the LO frequency to translated it to the 1H frequency, and routed to the scanner 1H receiver. Crossed diode symbols represent multiple diode pairs. Other amplifiers, attenuators, filters, bias tees, etc., are not shown.
After the development of the frequency converter, and with additional consultation with the scanner manufacturer’s engineers, it was discovered that the excessive receiver delay is caused by electronic switching between RF sidebands in the internal frequency converter of the scanner, and that following the initial multinuclear acquisitions during the execution of the pulse sequence, subsequent acquisitions occur without excessive delay. The problem only occurs for certain nuclei, including 31P. This suggests that this problem can be circumvented in the future with modifications in the pulse sequence and processing algorithms to discard initial acquisitions and retain only those which are acquired with short receiver delay. However, we describe the frequency conversion methodology because it enables the measurements for scanners without multinuclear capability or for which the RF hardware limitations cannot otherwise be circumvented.
The 31P preamplifier is an Advanced Receiver Research (Burlington, CT, USA) low noise (0.5 dB noise figure) custom-tuned low-magnetic communications preamplifier modified with 1N914B crossed (back-to-back) passively switched (by RF level) silicon diodes to ground on the input for preamp protection, and preamp bias power provided from the preamp RF output connection as is standard for clinical scanner preamps. A stack of multiple crossed diodes in series was connected at the RF power amplifier output to eliminate any residual amplifier noise detected in the receiver signal. To reduce the number of cables required, 12 volts DC is imposed on the center conductor of the cable connecting the preamplifier output to the frequency converter to provide preamplifier bias. The various amplifiers, filters, attenuators and signal routing in the frequency converter ensure that maximal dynamic range and sufficient unwanted sideband suppression are achieved, while keeping low level RF signals within safe limits for the scanner and RF power amplifier.
The actively switched PIN diodes normally employed in the transmit/receive (T/R) switch in clinical scanners are relatively slow in switching speed, due to the inherent properties of the PIN junction as well as to the switching speed of the PIN diode drive signal. The above scheme eliminates all PIN diode switching along with the increased dead time contributed by this type of T/R switch. Typical conventional switching diodes like the 1N914B switch in ns. Transmit/receive isolation is determined in the modified design by the isolation of the quadrature hybrid (roughly 20 dB) and the passive switching diodes in the transmitter and receiver circuits.
The success of this design was demonstrated by the following experiment. A CW (continuous wave) sine wave signal from a frequency synthesizer at a slight offset to the nominal 31P frequency was applied through an attenuator (ranging from 60–100 dB) to the quadrature hybrid where the RF coil would be connected. The scanner (1H) RF pulse amplitude was set to zero. The output signal from the converter was sent to the 1H receiver of the scanner and recorded by the scanner. There was no observable distortion of the received synthetic signal at the beginning of the recorded trace (Fig. 2b), and a 31P signal linear dynamic range (thermal noise floor to 1 dB compression) of greater than 106 was achieved.
The RF ring-down time of the coil also affects the receiver dead time. When the T/R coil is well tuned and matched, the ring-down time is longer, which increases the total time the receiver is blocked (Fig. 4). This problem is more significant in 31P SMRI than in proton WASPI, since the 31P frequency is 2.5 times lower. One interpretation of coil quality factor Q is that it is numerically equal to the number of RF cycles in the exponential time constant L/R for the ring down (Q = 2π f L/R). For similar 1H and 31P coil Qs, the 31P coil will take 2.5 times longer to ring down. At typical values of Q, L/R ~ 1/6 μs. In this study, we used 20 μs for the total 31P receiver dead time, including the RF ring-down time which occurs roughly simultaneously with the receiver recovery. The software delay between the end of the RF pulse and the start of data acquisition was therefore set to 20 μs.
Figure 4.
Effect of coil loading on the receiver recovery time. a. 31P magnitude spectrum of a vial of 85% phosphoric acid, which loads the coil severely, shortens the coil ring-down and reduces the Q to 37. The software receiver dead time delay was set to 10 μs. b. 31P magnitude spectrum of a vial of hydroxyapatite, which does not load the coil and maintains the Q at 115. With the software receiver dead time delay set to 10 μs the coil ring-down creates a strong artifact in the spectrum. c. Same as b, except that the receiver dead time delay is increased to 20 μs, which blocks the coil ring-down signal and permits acquisition of a distortion-free spectrum.
Image Reconstruction with Missing Data Points recovered by a Second Acquisition
To observe the short T2 signal, fast acquisition (dwell time as short as 5 μs) is required to provide a broad acquisition spectral width. Even with the shortest achievable receiver dead time (e.g., 10 μs for 1H and 20 μs for 31P), the first few FID samples corresponding to the positions in the k-space close to the origin are still lost. Reconstructing an image without any correction for this loss means that the time domain data is shifted in k-space, in a manner not equivalent to simply translating the time origin (which would be correctable in post-processing), but rather as data points that are moved radially toward the origin, resulting in the Fourier transform being multiplied by position-dependent phase factors. The intensity of the resulting image, which is a magnitude mapping of the Fourier transform of the time domain data, would hence be seriously distorted by the various phase shift factors at different space positions (15).
The approach to correcting this problem by placing sampled data in the correct k-space positions and assigning zeros to the k-space positions of missing data is equivalent to taking a convolution of the true image with a radial sinc function, which would depress the baseline of the image, resulting in a dark halo surrounding the image, and would distort the signal intensity.
Instead, our approach is to recover the missing data directly by means of a single additional acquired data set, in which the dwell time tdw is increased by a factor C, so that the new dwell time Ctdw is equal to the receiver dead time, making all data detectable except for the very first one (k-space origin). The sample exactly at the origin of k-space does not contribute to the reconstruction, so it does not matter if it is lost. The gradient strength is reduced in the second acquisition by that same factor C, making the second set of data points correspond precisely to the missing k-space points near the origin. The second acquisition requires many fewer projections than the first (regular) set because the previously missing data does not extend far into k-space when the minimal receiver dead time is applied. In the reconstruction, the second data set is re-sampled onto the same Cartesian coordinate system of the first data set. The second acquisition adds a trivial amount of time to the overall scan duration. Because the additional k-space points are measured in the second acquisition farther down the material’s intrinsic T2 decay curve than they would have been in the main acquisition, these points carry a somewhat greater T2 weighting; however this does not seriously impact the overall measurement accuracy or introduce observable artifacts (15).
Imaging Resolution
The resolution-limiting factors of SMRI are the projection pixel size Δxp and intrinsic pixel size Δxi.
Δxp is determined by the imaging parameters (15):
| [1] |
where FOV is the field of view and P the number of projections. FOV is determined by the acquisition spectral width WS, the projection gradient strength G, the reconstruction matrix size Mmat and the actual number of data points used in the reconstruction Nps:
| [2] |
Δxi is determined by the inherent MR properties of the imaged nuclei, mainly the resonance line width WL, and the applied projection gradient strength G:
| [3] |
The overall resolution can be expressed as Δxall:
| [4] |
The point spread function (PSF) is a useful concept to analyze resolution limitations (16):
| [5] |
where I(x) is the object, I(x) is its image and h(x) the PSF. The symbol denotes * convolution. In this study, a one dimensional profile was generated from the transverse image of the two-tube phantom acquired by 31P SMRI and deconvolved to obtained the corresponding h(x) using the blind deconvolution method with MATLAB (Mathworks Inc, Natick, MA, USA). The width of h(x) was then compared with Δxall.
T1 Measurements
The T1 of bone mineral has been known to be long (14). To make the T1 measurement in a single scanning session duration tolerable to the subject, the measurement was carried out either by spectroscopy or SMRI with sharply reduced number of projections. Since inversion-recovery is not practical in measuring T1 of MR signals with very short T2, progressive saturation was used. TRs were 0.5, 1, 2, 3, 5 s in both measurements. For spectroscopy measurement, one hundred dummy scans were applied before each data acquisition to ensure MR steady states. Twenty acquisitions at each TR were averaged. For SMRI measurements, the number of projections was 184 with G = 28 mT/M, and dwell time = 7 μs, without acquisition average.
The 31P SMRI experiments were carried out with a Siemens 3T Trio whole body scanner, with a maximum available gradient strength of 30 mT/m.
RESULTS
The 31P resonance line width of hydroxyapatite was 2.0 kHz (Fig. 5a), and the T1 was 1.5 s. Based on these results, images of 31P SMRI of the two-tube phantom (Figs. 5b and c) were obtained with the following protocol: FOV 150 mm; excitation pulse 10 μs for 10° flip angle; dwell time 7 μs; gradient strength 28 mT/m; projection number 8148; receiver dead time 20 μs; TR 50 ms. The second data acquisition to recover k-space points missed in the receiver dead time of the regular acquisition was carried out with lower gradient strength (7 mT/m), longer dwell time (20 μs), and fewer projections (20) while the other parameters were the same as those in the regular acquisition. The total scan time was about 7 min for both acquisitions combined.
Figure 5.
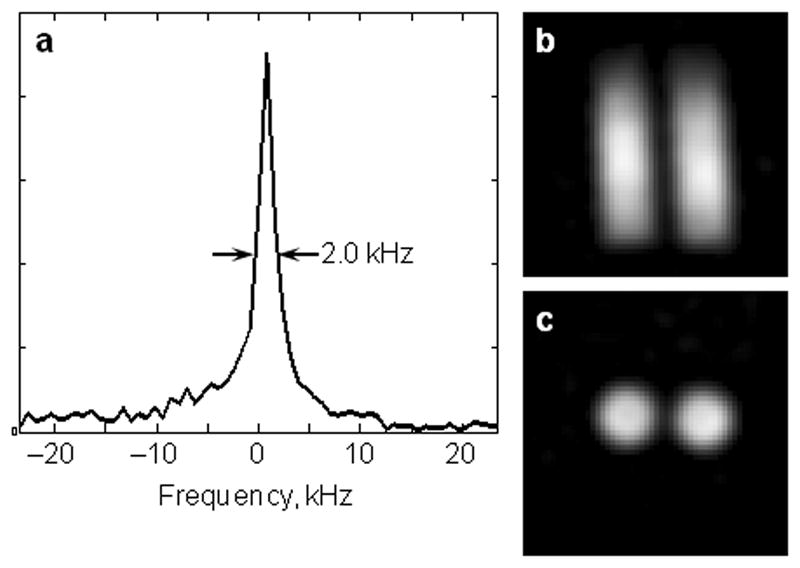
31P spectrum and solid state MRI (SMRI) of hydroxyapatite. a. 31P magnitude spectrum of a vial of hydroxyapatite (HA). The full width at half maximum of the resonance is 2.0 kHz. b. Coronal slice of the 31P image of the two-tube phantom. The inside diameter of each HA tube is 14 mm and the space between the two columns of HA is 2.9 mm. c. Transverse slice of the 31P image of the two-tube phantom.
Images of the two-tube phantom were reconstructed in two different ways: a) without any correction of the time domain data; b) with correction of the time domain data position in k-space and with the second data set to compensate for the missing data points. The results in Fig. 6 demonstrate good correction of the artifact due to missing data points.
Figure 6.
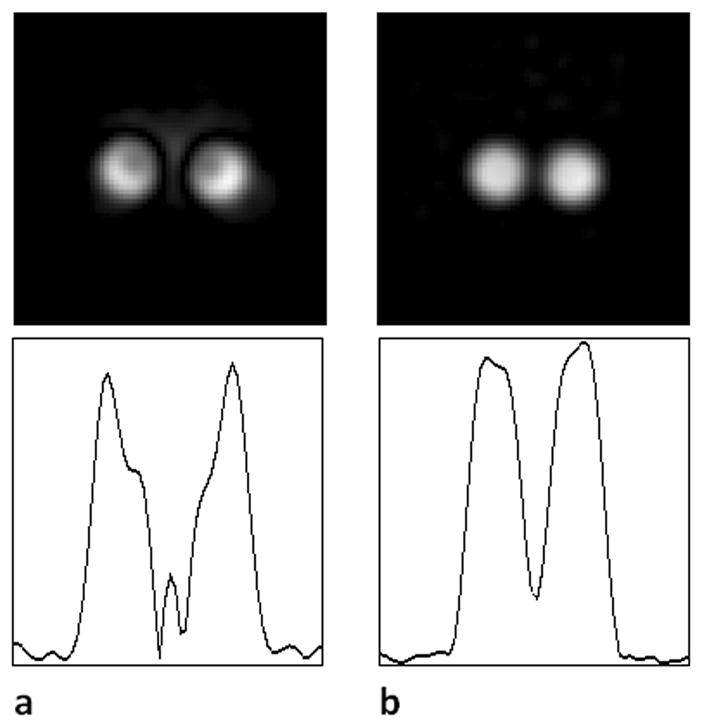
31P image reconstruction with and without the recovered data missed in the receiver recovery. The receiver dead time delay was 20 μs, and the dwell time was 7 μs in both panels. Therefore, three data points were lost in the receiver dead time during the regular acquisition. Upper row: Transverse slice from the 31P SMRI of the two-tube phantom. Lower row: Line profile across the corresponding image. a. Image reconstructed without any correction of time domain data or recovery of missing points; the first sampled data point is positioned at the origin of k-space. The image is severely distorted. b. Image reconstructed with the data in correct k-space positions and with missing points recovered (second data set). The artifacts in a disappear.
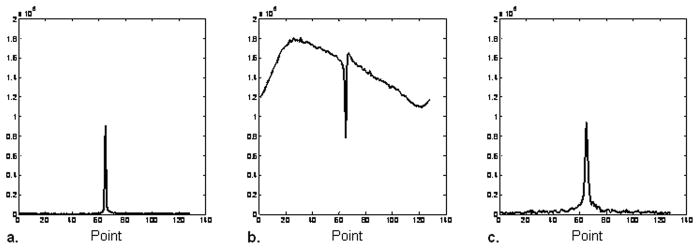
The line profile of the image of the two-tube phantom in Fig 6b was generated across the center of the transverse view (Fig. 7a), which showed that the intensity of the gap between the two tubes dipped, but did not reach the background level. A deconvolution operation of the line profile was performed (Fig. 7b) and the PSF was obtained and plotted in Fig 7c. The full width at half maximum of the PSF was measured as 5.0 mm. According to Eqs. 1 and 3, for FOV = 150 mm and P = 8148, projection pixel size Δxp was 3.0 mm; and for WL = 2 kHz and G = 28 mT/m, intrinsic pixel size Δxi was 4.1 mm. The Δxall was 5.1 mm according to Eq. 5, in very close agreement to the measured 5.0 mm value.
Figure 7.
Point spread function of 31P SMRI. a. Line profile through a transverse slice of the 31P SMR image of the two-tube phantom. b. Deconvolved axial profile of the 31P SMRI obtained using blind deconvolution. c. The combined point spread function of the system (including intrinsic spectral width of the HA) and reconstruction. The full width at half maximum is 5.0 mm.
In vivo 31P MR study of seven volunteers is summarized in Table 1.
Table 1.
Details of 31P images of healthy volunteers
| Image | Age, yr | Gender | Gradient, mT/M | Dwell, μs | Number of Projections | Resolution, mma | Duration, min:s | Cortical SNR | Note |
|---|---|---|---|---|---|---|---|---|---|
| 1 | 27 | Male | 27.96 | 7.0 | 184 | 21 | 1:32–15:20 | 9–23 | b |
| 2 | 28 | Female | 5.0 | spectroscopy | c | ||||
| 3 | 47 | Male | 27.96 | 7.0 | 998 | 8.8 | 4:35 | 33 | d |
| 4 | 40 | Male | 27.96 | 7.0 | 8148 | 5.1 | 37:0 | 30 | e |
| 5 | 33 | Male | 30.11 | 6.5 | 8148 | 4.8 | 37:0 | 17 | f |
| 6 | 25 | Female | 30.11 | 6.5 | 8148 | 4.8 | 37:0 | 18 | |
| 7 | 60 | Male | 30.11 | 6.5 | 8148 | 4.8 | 37:0 | 16 |
Computed from imaging parameters.
T1 measurements with TR: 0.5, 1, 2, 3, 5 s. Scan duration varied from 1 min 32 s (TR=0.5 s) to 15 min 32 s (TR=5 s), SNR varied from 9 (TR=0.5 s) to 23 (TR=5 s). T1 = 19.2 s.
T1 measurements using 31P spectroscopy. T1 = 17.2 s (see text).
Spatial resolution insufficient for usable image quality.
Shown in Fig. 9.
Shown in Fig. 10. Δxi was improved to 3.7 mm due to stronger gradient strength, Δxp remained at 3.0 mm, Δxall was improved to 4.8 mm.
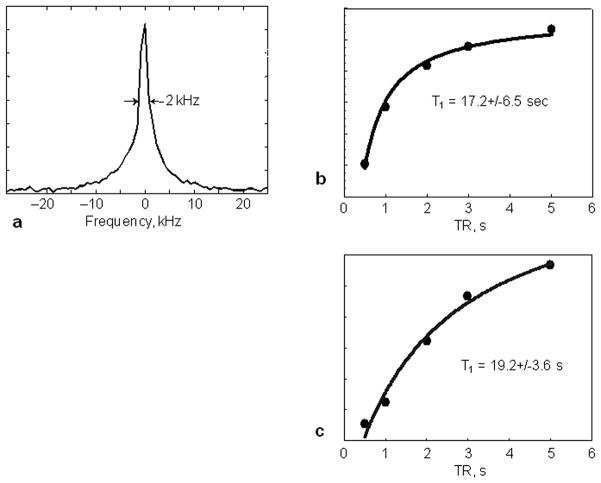
The 31P resonance line width and T1 of bone mineral of two subject was measured in vivo as ~2.0 kHz and ~17.2 s (by spectroscopy) – 19.2 s (by SMRI) at 3T, respectively (Fig. 8, Tab. 1). The bone mineral line width is similar to that of HA, but the T1 is much longer. Three dimensional 31P images of the bone mineral of human wrists were obtained with the same protocol used in the imaging of the two-tube phantom, except that the TR was 275 ms due to the longer T1 of human bone mineral, which resulted in a longer acquisition time (37 min). The SNR is about 30 (Fig. 9).
Figure 8.
31P resonance line width and T1 of human bone mineral measured in vivo.
a. Single pulse 31P spectrum showing a full width half maximum resonance line width of 2 kHz from the wrist of a 28-year-old female volunteer.
b. Spectroscopy progressive saturation T1 measurement from the same volunteer of a. yields an in vivo human bone mineral 31P T1 of 17.2 s.
c. SMRI progressive saturation T1 measurement from a 27-years-old male volunteer yields 31P T1 of bone mineral of 19.2 s.
Figure 9.
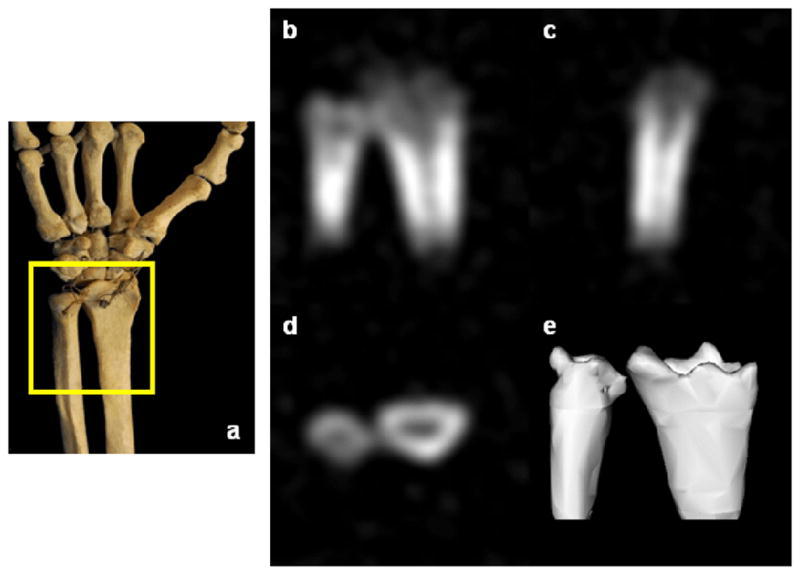
In vivo 31P SMRI of bone mineral of the wrist of a healthy 41-year-old male volunteer. a. Schematic view of the scanned region. b–d. Posterior-anterior, lateral, transverse image slices. e. Three-dimensional isosurface rendering of the full data set.
Since the intrinsic pixel size is the dominating factor over the projection pixel size for the overall resolution, 31P images with the available maximum gradient strength 30.11 mT/M were performed while keeping the FOV and the number of projections the same. The resulted wrist images were with higher resolution. According to Eq. 3, the Δxi was reduced from 4.1 mm (G = 28 mT/M) to 3.7 mT/M. The overall resolution ΔxA was improved from 5.1 mm to 4.8 mm.(Fig. 10). However, the SNRs are reduced to 16–18 (Table 1).
Figure 10.
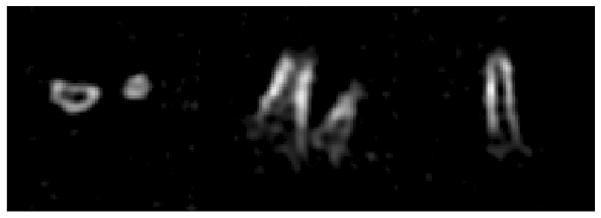
In vivo 31P SMRI of bone mineral of the wrist of a healthy 60 year old male volunteer, 30.11 mT/m gradient, 37 min scan, cortical SNR = 16, overall resolution: 4.8 mm.
Left: Transversal view.
Middle: Coronal view.
Right: Sagittal view.
DISCUSSION
The results demonstrate that despite the low intrinsic SNR, long T1 and broad spectral linewidth of the 31P isotope in bone, as well as the technical barriers to measuring short T2 signals with clinical scanners, 31P MRI of bone mineral in humans is feasible. Synthetic hydroxyapatite powder, which resembles bone mineral chemically, is a useful phantom material for setting up scans and for measuring the spatial resolution in the image. The resonance line width of hydroxyapatite and human bone mineral are similar (about 2 kHz FWHH), corresponding to a T2 of 160 μs. The achievable SNR of the images of the HA tubes and human wrists demonstrated that the difficulty caused by the short T2 of the 31P signal from HA and the bone mineral is largely overcome by the utilization of a strong B1 provided by the wrist coil and a shortened receiver dead time by using the proton channel of the scanner with a frequency converter.
The intrinsic pixel size for 31P was 4.1 mm. The gyromagnetic ratio γP of 31P is 2.5 times smaller than that of the proton, γH, which means that a 2.5× stronger gradient strength is required for 31P to achieve the same intrinsic pixel size as that of 1H images. In this study, due to the limitation of the maximum gradient strength of 30 mT/m, the intrinsic pixel size (4.1 mm) is the dominating factor over the projection pixel size (3.0 mm) for the overall resolution (Δxall ~5.1 mm). The measured PSF (FWHM ~ 5.0 mm) confirmed this. If the applied gradient strength could be higher, such as 40 mT/m (available in many 3 T clinical scanners), the intrinsic pixel size will be 2.9 mm. A stronger gradient strength would reduce the FOV from the current 150 mm to 105 mm (at 3.0 T), hence reducing the Δxp from 3 mm to 2 mm and the overall resolution Δxall from 5.1 mm to 3.5 mm.
In quantitative solid state MR imaging or spectroscopy measurements based on FIDs, it is critical to reduce the receiver dead time to minimize distortion or complete loss of the initial FID samples. The limiting initial value of the time or k-space signal corresponds to the total area under the spectrum or image, respectively. It is therefore essential to capture the early points with high fidelity to achieve accurate quantitative measurements. For example, a 31P spectroscopic resonance (no gradient or inhomogeneity present) with a 2.0 kHz FWHH (typical of bone apatite) has a T2* of 160 μs if the lineshape is approximated by a Lorentzian function. A receiver dead time or sampling delay of 70 μs yields an amplitude of the first sampled FID value which is 65% of the true value of this signal in spectroscopy. During imaging, a gradient is present, and T2* is far shorter by a large factor, making the amplitude error far worse. Although it is possible to reconstruct an image of a short-T2 substance acquired with a large dead time or sampling delay, the SNR and quantitative accuracy of that image will be severely degraded compared to the image obtained when the k-space data near the origin is properly acquired. Acquisition schemes based on echoes can in principle measure the data at the k-space origin, but in practice it is difficult for in vivo 31P MRI of bone mineral by clinical scanners to achieve a true echo time short enough to capture the k-space values near the origin without severe distorted by T2 and T2* decay. This decay arises from the inherent resonance offset distribution due to 31P chemical shift anisotropy and heteronuclear proton coupling. The “echo time” of the UTE sequence is actually a sampling delay, and does not represent a time at which these dephasing processes are rephrased. Likewise, the use of slice selection or self-refocusing pulses, whose durations can be on the order of or longer than T2 and T2*, further degrades the quantitative accuracy.
Following the end of an RF pulse, the coil rings down with stored RF energy, and the scanner receiver is briefly overloaded. There is also a finite time required for the transmit/receive (T/R) switch to change from transmit mode to receive mode. This requires modification of the T/R switch to permit faster switching, reducing the ring down time by possibly lowering of the coil Q, and reducing the software-imposed minimum recovery delay so that signals may be sampled sooner following the RF pulse than normally permitted.
Reconstructing the image with recovered data corrects the artifacts which most seriously affect quantitative measurements such as bone mineral or matrix density. The most common means of correcting for receiver dead time or sampling delay is to place sampled data points in their correct k-space positions and assign zeros to the k-space positions of missing data. The baseline distortion created by this procedure is less severe in 31P SMRI than in 1H SMRI, since the sinc broadening function decays as 1/k (17) where
| [6] |
and
| [7] |
In UTE, the gradient is turned on after the RF excitation pulse. This timing scheme has a significant effect on spatial resolution and SNR because many or a majority of the data points are not acquired under the maximum gradient strength. For example, if the maximum gradient is 30 mT/m, and the slew rate is 100 mT/m/ms, it will take 75 μs to reach the maximum strength, which is roughly half the T2 of bone mineral, and there is extra time (receiver dead time) before the gradient ramp begins. This will reduce the overall spatial resolution. Therefore we expect that the SMRI method will provide better spatial resolution and quantitative accuracy for short T2 imaging than UTE.
Applying the RF excitation pulse while the readout gradient is on and after it has stabilized helps to capture early k-space points with high fidelity. The loss of these points is due to the electronic recovery time of the receiver, T/R switch, preamp and coil. These are the same irrespective of whether or not a gradient is present. Turning on the gradient following the end of the RF pulse imposes complexity, instability and consequent possibility of degradation and artifacts in the reconstruction because of the need for regridding or nonuniform sampling intervals. Sampling in the present of a fully stable and constant gradient for all k-space points eliminates these potential sources of image degradation. Because the RF pulse amplitude is very high and the pulse is short, the excitation profile is not substantially affected from view to view.
In addition to the much lower SNR of 31P compared to 1H, the long 31P T1 of bone mineral (about 17–19 s at 3.0 T) represents a major challenge. Both factors result in long scan times. In addition to utilizing phase-array coils and parallel acquisition methods, there are two kinds of tradeoffs/optimizations that relate SNR, scan duration and spatial resolution one can consider. In the first tradeoff, TR could be made shorter while increasing the number of k-space radii acquired for the same overall scan duration, while keeping the flip angle at the Ernst optimum (18). However, the intrinsic spectral linewidth of the 31P resonance limits the spatial resolution for a given gradient strength. Likewise, the number of k-space radii limits the spatial resolution of the reconstruction. Because the gradient strength used in this study is close to the maximum stable gradient strength of the scanner, and since the number of k-space radii has been chosen to match the linewidth limitation, there is not a great deal to be gained by shortening TR in this situation. In the second tradeoff, if the goal is to measure the mean bone mineral density over a sizable volume, such as 6×6×6 cm3, and the bone mineral is distributed across the entire volume, the resolution can be reduced to 6 mm, the number of projections reduced to 1964, resulting in a total acquisition time of 9 min for the same TR = 275 ms used in this study. Although DXA and CT have much higher spatial resolution than 6 mm, the results of these bone density measurements are typically summarized as a single number (the BMD score) averaged over a whole bone or large volume of bone. The implication for MR-based BMD measurement is that a very small number of pixels will suffice in order to measure a BMD value; for example, DXA or qCT images are ultimately reduced to a single score reflecting the average BMD over the spine or hip. Even in the limiting case of measuring the entire FOV as a single pixel (spectroscopic limit) (19), it is conceivable that clinically useful bone mineral density data of a large volume might be obtainable by solid state MRI with very short scan times. A detailed treatment of the choice of number of radii, intrinsic linewidth and spatial resolution for 3D radial acquisitions is found in (15).
In conclusion, visualizing human wrist bone mineral by 31P SMRI with a clinical MR scanner is feasible. The short T2 difficulty associated with 31P signal of bone mineral can be overcome with the coil and T/R system meeting the requirements of strong B1 field and short receiver recovery time. In the case of the scanner used in this study, a significant advantage in reduction of the receiver recovery time was gained by using a frequency converter to enable 31P reception via the faster-recovering 1H channel, although other means to reduce the receiver recovery time may be possible. A gradient strength of 40 mT/m is sufficient to achieve 31P bone image resolution of about 3.5 mm.
Acknowledgments
Grant Sponsors: This work was supported by grants R01-EB004012 (National Institute of Biomedical Imaging and Bioengineering) and P41-RR14075 (National Center for Research Resources), the Peabody Foundation, the Athinoula A. Martinos Center for Biomedical Imaging, the Orthopaedic Surgery Foundation of the Children’s Hospital, Boston, and the MIND Institute. Andreas Potthast, Michael Hamm and Philipp Hoecht of Siemens Medical Systems (Erlangen, Germany) provided considerable assistance with scanner technical issues including the means to modify the receiver dead time parameter. We thank Melvin J. Glimcher for discussions on the composition and biology of bone.
Grant Sponsors: NIBIB-NIH, NCRR-NIH
References
- 1.U.S. Department of Health and Human Services. Bone health and Osteoporosis: A Report of the Surgeon General. 2004. [Google Scholar]
- 2.Kanis JA, Delmas P, Burckhardt P, Cooper C, Torgerson D. Guidelines for diagnosis and management of osteoporosis. Osteoporos Int. 1997;7:390–406. doi: 10.1007/BF01623782. [DOI] [PubMed] [Google Scholar]
- 3.Engelke K, Adams J, Armbrecht G, Augat P, Bogado C, Bouxsein M, Felsenberg D, Ito Masako, Prevrhal S, Hans DB, Lewiecki EM. Clinical use of quantitative computed tomography and peripheral quantitative computed tomography in the management of osteoporosis in adults: the 2007 ISCD official positions. J Clin Densitom. 2008;11:123–62. doi: 10.1016/j.jocd.2007.12.010. [DOI] [PubMed] [Google Scholar]
- 4.Tyler DJ, Robson MD, Henkelman RM, Young IR, Bydder GM. Magnetic resonance imaging with ultrashort TE (UTE) pulse sequences: technical considerations. J Magn Reson Imaging. 2007;25:279–289. doi: 10.1002/jmri.20851. [DOI] [PubMed] [Google Scholar]
- 5.Anumula S, Magland J, Wehrli SK, Zhang H, Ong H, Song HK, Wehrli FW. Measurement of phosphorus content in normal and osteomalacic rabbit bone by solid-state 3D radial imaging. Magn Reson Med. 2006;56:946–52. doi: 10.1002/mrm.21050. [DOI] [PubMed] [Google Scholar]
- 6.Anumula S, Wehrli SL, Magland J, Wright AC, Wehrli FW. Ultra-short echo-time MRI detects changes in bone mineralization and water content in OVX rat bone in response to alendronate treatment. Bone. 2010;46:1391–1399. doi: 10.1016/j.bone.2010.01.372. [DOI] [PMC free article] [PubMed] [Google Scholar]
- 7.Wu Y, Ackerman JL, Chesler DA, Li J, Neer RM, Wang J, Glimcher MJ. Evaluation of bone mineral density using three dimensional solid state phosphorus-31 NMR projection imaging. Calcif Tissue Int. 1998;62:512–8. doi: 10.1007/s002239900471. [DOI] [PubMed] [Google Scholar]
- 8.Wu Y, Chesler DA, Glimcher ML, Garrido L, Wang J, Jiang HJ, Ackerman JL. Multinuclear solid state three dimensional MRI of bone and synthetic calcium phosphates. Proc Nat Acad Sci USA. 1999;96:1574–8. doi: 10.1073/pnas.96.4.1574. [DOI] [PMC free article] [PubMed] [Google Scholar]
- 9.Wu Y, Ackerman JL, Chesler DA, Graham L, Wang Y, Glimcher MJ. Density of organic matrix of native mineralized bone measured by water and fat suppressed proton projection MRI. Magn Reson Med. 2003;50:59–68. doi: 10.1002/mrm.10512. [DOI] [PubMed] [Google Scholar]
- 10.Wu Y, Hrovat MI, Ackerman J, Reese TA, Cao H, Ecklund K, Glimcher MJ. Bone matrix imaged in vivo by water and fat suppressed proton projection MRI (WASPI) of animal and human subjects. J Magn Reson Imaging. 2010;31:954–963. doi: 10.1002/jmri.22130. [DOI] [PMC free article] [PubMed] [Google Scholar]
- 11.Idiyatullin D, Corum C, Park JY, Garwood M. Fast and quiet MRI using a swept radiofrequency. J Magn Reson. 2006;181:342–349. doi: 10.1016/j.jmr.2006.05.014. [DOI] [PubMed] [Google Scholar]
- 12.O’Connell RD, Moeller S, Idiyatullin D, Corum C, Garwood M. theoretical sensitivities of SWIFT and the ideal sequence (delta pulse-acquire0 for ultra-short T2. Abstracts, Eighteenth Scientific Meeting, International Society of Magnetic Resonance in Medicine; Stockholm, Sweden. May 1–7, 2010; p. 2975. [Google Scholar]
- 13.Carl M, Chiang J-T, Bydder G, King K. Bloch simulations of UTE, WASPI and SWIFT for imaging short T2 tissues. Abstracts, Eighteenth Scientific Meeting, International Society of Magnetic Resonance in Medicine; Stockholm, Sweden. May 1–7, 2010; p. 694. [Google Scholar]
- 14.Wu Y, Ackerman JL, Chesler DA, Wang J, Glimcher MJ. In vivo solid state 31P MRI of human tibia at 1.5 T. Seventh Scientific Meeting, International Society of Magnetic Resonance in Medicine; Philadelphia, PA. May 22–28, 1999. [Google Scholar]
- 15.Wu Y, Dai G, Ackerman JL, Hrovat MI, Glimcher MJ, Snyder BD, Nazarian A, Chesler DA. Water and fat suppression projection MRI (WASPI) of rat femur bone. Magn Reson Med. 2007;57:554–67. doi: 10.1002/mrm.21174. [DOI] [PubMed] [Google Scholar]
- 16.Liang Z-P, Lauterbur PC. Principles of Magnetic Resonance Imaging. IEEE Press; 2000. p. 91. [Google Scholar]
- 17.Liang Z-P, Lauterbur PC. Principles of Magnetic Resonance Imaging. IEEE Press; 2000. p. 15. [Google Scholar]
- 18.Ernst RR, Bodenhausen G, Wokaun A. Principles of nuclear magnetic resonance in one and two dimensions. Clarendon Press; 1987. p. 124. [Google Scholar]
- 19.Cao H, Nazarian A, Ackerman JL, Snyder BD, Rosenberg AE, Nazarian RM, Hrovat MI, Dai G, Mintzopoulos D, Wu Y. Quantitative 31P NMR spectroscopy and 1H MRI measurements of bone mineral and matrix density differentiate metabolic bone diseases in rat models. Bone. 2010;46:1582–1590. doi: 10.1016/j.bone.2010.02.020. [DOI] [PMC free article] [PubMed] [Google Scholar]


