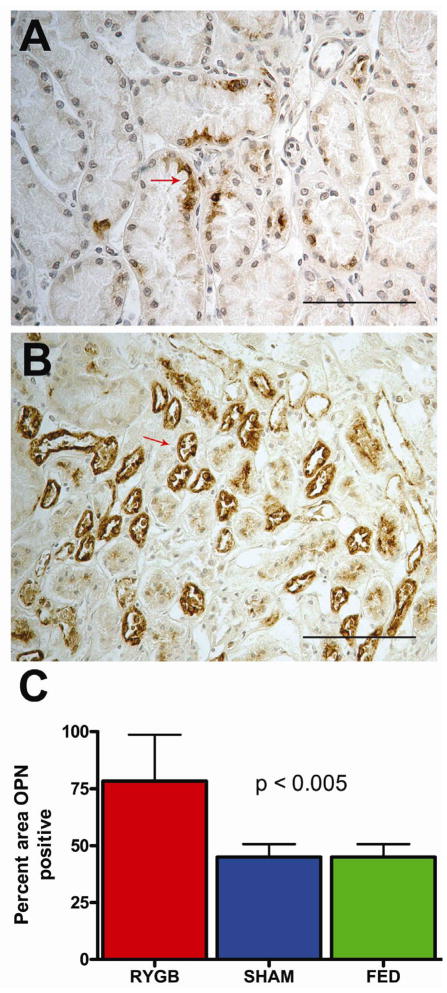
Figure 3.
Immunohistochemical detection of osteopontin (OPN) from obese rodent kidney sections. Representative OPN staining from Sham control (A) compared to RYGB surgery (B). 400x magnification with scale bar = 100 μm. RYGB group had more % area positive OPN staining (C) from renal inner medulla than Sham or Fed controls (P<0.005). ). Values represent mean ± SD of the total OPN stained renal tissue area analyzed by ANOVA (p<0.01) and Fisher’s (p<0.01).

