Abstract
The surface presentation of peptides by major histocompatibility complex (MHC) class I molecules is critical to CD8+ T cell mediated adaptive immune responses. Aminopeptidases are implicated in the editing of peptides for MHC class I loading, but C-terminal editing is thought due to proteasome cleavage. By comparing genetically deficient, wild-type and over-expressing mice, we now identify the dipeptidase angiotensin-converting enzyme (ACE) as playing a physiologic role in peptide processing for MHC class I. ACE edits the C-termini of proteasome-produced class I peptides. The lack of ACE exposes novel antigens but also abrogates some self-antigens. ACE has major effects on surface MHC class I expression in a haplotype-dependent manner. We propose a revised model of MHC class I peptide processing by introducing carboxypeptidase activity.
The surface presentation of peptides by major histocompatibility complex (MHC) class I molecules is critical to transplant rejection and to virtually all CD8+ T cell adaptive immune responses. The loading of MHC class I with peptides is a multi-step process1-3. The majority of class I peptides begin as proteasome degradation products of cytosolic proteins4. Once transported to the endoplasmic reticulum (ER) by TAP (transporter associated with antigen processing), peptides are not selected randomly by class I molecules, but are chosen by length and sequence5, with peptidases editing the raw peptide pool4,6. Aminopeptidases, particularly ERAP (ER aminopeptidase associated with Ag processing), have been implicated in MHC class I peptide processing7,8, but it is generally thought that the proteasome, and not carboxypeptidases, makes the final cut of the C-termini for MHC class I peptides9,10. Recently, nardilysin and thimet oligopeptidase were found to trim the C-termini11, but these enzymes work partly in a proteasome-independent manner and their contribution to the general MHC class I peptide repertoire is not clear.
Angiotensin converting enzyme (ACE) is a zinc-dependent carboxyl dipeptidase that belongs to the gluzincin family. The enzyme plays an important role in blood pressure regulation through its C-terminal cleavage of angiotensin I to angiotensin II, but ACE has wide substrate specificity, including such diverse peptides as bradykinin, substance P and Ac-SDKP12,13. Typically, ACE is a cell membrane-associated type I ectoenzyme13. However, functionally active ACE is found in the ER14. ACE is expressed by many different tissues, and professional antigen presenting cells (APCs), such as macrophages and dendritic cells (DCs), make ACE15–17. It has been reported that ACE can digest peptides for MHC class I presentation14,18,19, but this work was performed under conditions of ACE over-expression and the natural, physiologic role of ACE in this process is unclear. Here, by studying mice with high, normal or no ACE expression, we show that, under physiologic conditions, ACE edits the C-termini of class I peptides.
RESULTS
ACE expression is increased with APC maturation
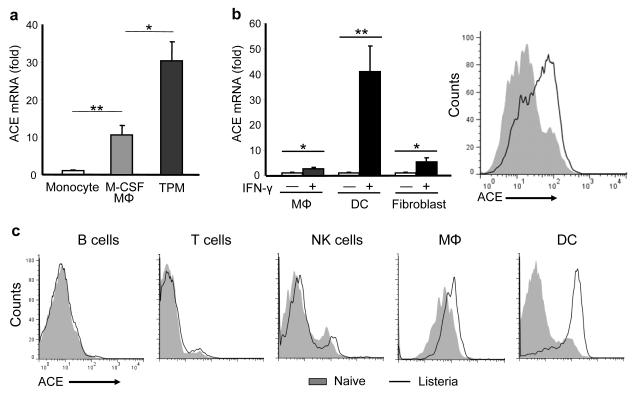
To test whether ACE participates in antigen presentation, we first evaluated ACE expression in the differentiation of monocytes to macrophages, since the antigen presentation machinery is usually upregulated when APCs mature. Wild-type bone marrow CD11b+ Ly6Chi Ly6G− F4/80lo monocytes were cultured with M-CSF for 4 days, by which time almost all the cells showed a macrophage morphology and upregulation of F4/80. The differentiation of monocytes to macrophages resulted in a ten-fold increase of ACE mRNA (Fig. 1a). ACE mRNA was further increased in thioglycollate-induced peritoneal macrophages (TPMs), an inflammatory macrophage type which expresses more MHC class II, CD80 and CD86 than M-CSF induced macrophages (Supplementary Fig. 1). Interferon-γ (IFN-γ) is a strong stimulant to upregulate antigen processing and presentation, which is accompanied by the upregulation of many components of the MHC class I pathway20. We found that IFN-γ upregulated ACE mRNA in TPMs and skin-derived fibroblasts, and profoundly induced ACE mRNA and ACE protein in bone marrow-derived DCs (Fig. 1b). Further, stimulation with the TLR4 ligand lipopolysaccharide (LPS) moderately upregulated ACE expression in DCs (Supplementary Fig. 2). However, such upregulation was not found with the TLR3 ligand Poly(I:C). Finally, when wild-type mice were infected with Listeria monocytogenes, ACE was significantly upregulated in splenic DCs and red-pulp macrophages (Fig. 1c) but not in T and B cells after 2 d. Thus, under several different conditions, maturation of APCs was associated with increased ACE expression.
Figure 1.
ACE is upregulated with APC maturation. (a) ACE mRNA abundance in monocytes, M-CSF-induced Mφ and thioglycollate-induced Mφ (TPM) were quantitated by real-time PCR; expression in monocytes was set as 1. (b) Left: ACE mRNA abundance was evaluated in TPMs, splenic DCs and skin fibroblasts with or without IFN-γ stimulation for 4 h. Right: splenic DCs with (line) or without (shaded) 24 h IFN-γ stimulation were stained for ACE expression and analyzed by flow cytometry. (a,b), data are pooled from three independent experiments and represent means + s.e.m. *P<0.05; **P<0.005. (c) Two days after listeria infection, C57BL/6 mice were sacrificed and splenocytes were analyzed for cell type and ACE expression by flow cytometry. Histograms are representative of data from 5 pairs of mice.
ACE affects surface MHC class I expression
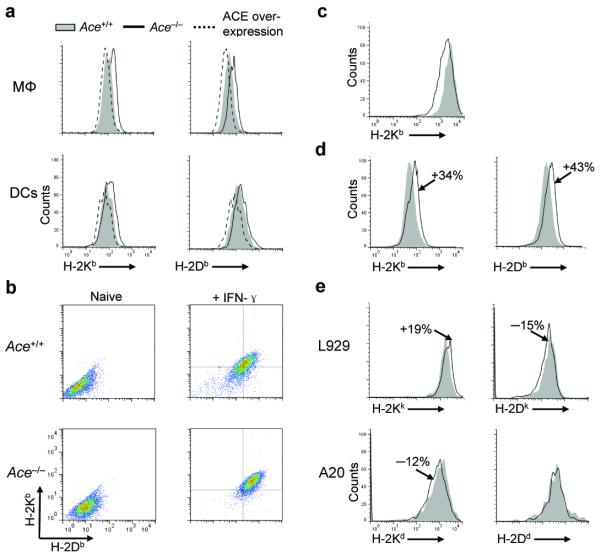
Individual MHC class I molecules select peptides with a preferred consensus motif and thus bind distinctive peptide repertoires5. If ACE affects the peptide repertoire, then the enzyme may affect surface expression of class I proteins. Surface Kb and Db amounts were assessed using ACE-deficient cells from Ace−/− mice21, ACE wild-type cells (Ace +/+) and ACE over-expressing cells. For the latter, we used cells from 2 unique mouse strains: ACE 10 (ref. 22) and Pd (see Methods), which overexpress ACE in macrophages and DCs, respectively (Supplementary Fig. 3). Among the peritoneal F4/80hi macrophages and the splenic CD11chi DCs, there was a 17% increase of mean fluorescence intensity of Kb and a 31% increase of Db in the Ace −/− cells compared to their Ace +/+ counterparts (Fig. 2a). In contrast, both molecules were decreased in ACE over-expressing cells (16% for Kb and 22% for Db). A similar Kb and Db increase was observed in Ace −/− total splenocytes (Supplementary Fig. 4a). Furthermore, IFN-γ-treated Ace −/− skin-derived fibroblasts expressed significantly more surface Kb and Db than IFN-γ-treated Ace +/+ cells (Fig. 2b). Thus, analysis of mice having high, normal or no ACE expression indicates an inverse relationship between ACE abundance and quantity of surface class I.
Figure 2.
The effects of ACE on surface MHC class I expression. (a) Surface Kb and Db expression on peritoneal Mφ from Ace −/−, Ace +/+ and ACE 10 mice or splenic DCs from Ace −/−, Ace +/+ and Pd mice. Representative histograms of samples from at least 5 mice in each group. (b) Surface Kb and Db expression on skin-derived fibroblasts from Ace +/+ and Ace −/− mice with or without IFN-γ priming. Representative dot plots of fibroblasts from 3 pairs of mice. (c) Surface Kb expression on L.Kb cells transfected with the Ace (line) or mAce (shaded) construct. Data are representative of 3 independent experiments. (d) Splenocyte Kb and Db expression in C57BL/6 mice after treatment with (line) or without (shaded) ramipril for 6 d. Representative histograms of 6 pairs of mice. (e) Kk and Dk expression on L929 fibroblasts (n=3), as well as Kd and Dd expression on A20 B cells (n=5), were evaluated after the cells were transfected with either a construct encoding ACE (line) or mACE (shaded).
To confirm the relationship between ACE and class I expression, we first transfected L.Kb cells with an ACE expression construct or with an ACE cDNA, termed mACE, in which the two ACE catalytic domains were rendered inactive by point mutations. The catalytically active ACE decreased Kb surface expression by 20% when compared to the cells expressing mACE (Fig. 2c). Moreover, when wild-type C57BL/6 mice were administered the pharmacologic ACE inhibitor ramipril for 6 d, splenocyte Kb and Db expression increased by 34% and 43%, respectively (Fig. 2d). To investigate whether ACE can also affect the presentation of other MHC class I molecules, we overexpressed ACE in K haplotype L929 cells and D haplotype A20 cells. This resulted in a 19% increase of Kk, a 15% decrease of Dk and a 12% decrease of Kd, while Dd barely changed (Fig. 2e). After BALB/c mice were treated with ramipril, splenic DC Kd and Dd increased by 12% and 9%, while Ld was unaffected (Supplementary Fig. 4b). Thus, ACE has major effects on surface MHC class I expression in a haplotype-dependent manner.
Peptide supply and MHC class I stability
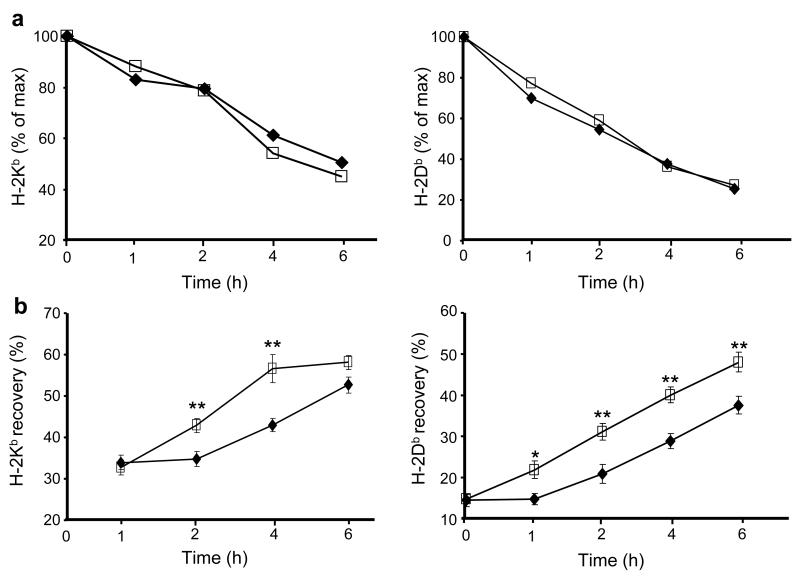
To understand the mechanism for surface MHC class I modulation, we first measured class I-peptide stability by testing surface MHC class I dissociation after treating cells with brefeldin A. This study showed that the rate of loss of surface Kb and Db was similar in total peritoneal cells from either Ace −/− or Ace +/+ mice (Fig. 3a). Next, we measured the de novo appearance of cell surface class I. For this test, existing cell surface class I-peptide complexes were stripped by short-term acid treatment. Cells were then moved back to normal media and the time dependent recovery of cell surface class I molecules was measured (Fig. 3b). The rate of recovery in Ace −/− cells was 10-20% faster than in Ace +/+ cells. These data suggest that part of the reason for increased surface class I expression in Ace −/− cells may be faster assembly of new peptide-MHC complexes but not increased peptide-dependent class I stability in these cells.
Figure 3.
ACE-deficient cells have normal peptide-MHC class I stability but increased peptide supply. (a) Peritoneal cells from Ace +/+ (◆) and Ace −/− (□) mice were cultured with brefeldin A. At the indicated time points, cells were stained for either Kb or Db and analyzed by flow cytometry. Data are plotted as the percentage of similarly cultured cells without brefeldin A. (b) Peritoneal cells from Ace +/+ (◆) and Ace −/− (□) mice were treated with mild acid and then cultured in normal medium. Cells were analyzed for Kb and Db restoration. Data are plotted as percentage of cells not treated with acid. (a,b) Data represent means ± s.e.m. of 5 pairs of mice. *P=0.02; **P≤0.01.
ACE edits the MHC class I peptide repertoire
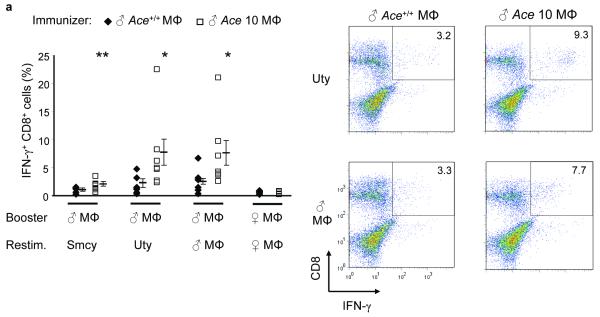
Because ACE abundance directly affect the surface expression of peptide-MHC class I complexes, we next assessed the nature of the peptides presented by MHC class I when ACE expression changes. One means of detecting differences in the MHC class I peptide repertoire is by cross immunization23. Specifically, we immunized Ace +/+ female mice with peritoneal macrophages from male Ace +/+ or male ACE 10 mice. The advantage of gender disparity is to measure the female CD8+ T cell responses to the HY Smcy and Uty peptides, the Y-chromosome-specific Db epitopes24. At 10 d, the females were sacrificed and splenocytes were expanded in culture with cells equivalent to those used to immunize the animals (booster). After 7-day culture, a further restimulation consisted of APCs (female Ace +/+ macrophages) loaded with either the Smcy or Uty peptides. Five hours later we measured the peptide-specific IFN-γ secreting CD8+ T cells by intracellular staining and flow cytometry (Fig. 4a). There was a 2-fold increase for Smcy and a 3-fold increase for Uty in the CD8+ T cell response from the female mice immunized with ACE 10 cells, as compared to those immunized with Ace +/+ cells. These data would be consistent with a difference in the numbers of Db-presented Uty or Smcy peptides on male Ace +/+ and ACE 10 immunizing macrophages. Indeed, when we examined surface Uty presentation using the Uty-specific CTL clone CTL-10 (25), there was a significant increase of Db-Uty presentation on ACE 10 macrophages compared to Ace+/+ macrophages (Supplementary Fig. 5). When the splenocytes from the immunized Ace+/+ female mice were restimulated, not with peptides, but with male macrophages equivalent to those used in the original immunization, there was again a higher response in the females immunized, expanded and restimulated with male cells from ACE 10 mice than Ace+/+ mice. However, when both the boost and the restimulation were with female macrophages from either Ace+/+ or ACE 10 mice, there was no CD8+ T cell response. These data suggest that ACE overexpression in the ACE 10 cells changes (and in this case increases) the presentation of the Uty and Smcy epitopes, but that it does not create any novel epitopes, as indicated by the lack of response of cells from the immunized female Ace +/+ mice to restimulation with female ACE 10 cells.
Figure 4.
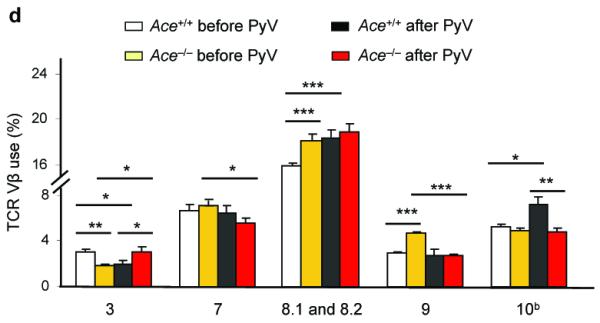
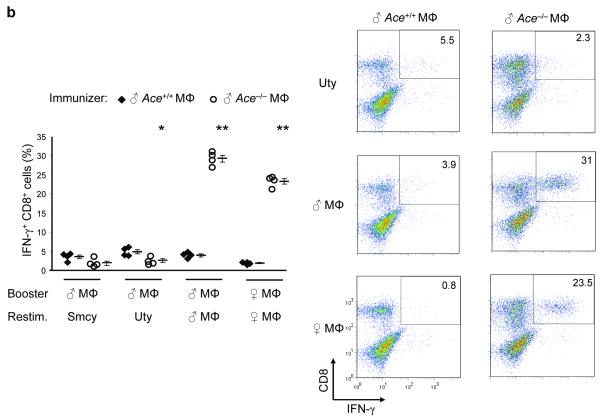
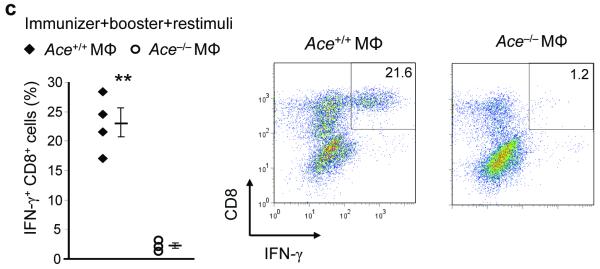
The effects of ACE on CD8+ T cell repertoire. (a) Female Ace+/+ mice were immunized with Mφ from either male Ace +/+ or ACE 10 mice. Splenocytes were expanded in vitro by stimulating with the indicated cells equivalent in ACE expression to the immunizing cells (booster). Restimulation (Restim.) consisted of either APCs loaded with the indicated HY peptides or with male or female Mφ equivalent in ACE expression to the immunizing cells. The percentage of IFN-γ secreting CD8+ T cells was measured. Right, representative histograms of the CD8+ T cell response. The immunizing cells are labeled at the top while the y-axis shows the restimulus. (b) Female Ace +/+ mice were immunized with Mφ from either male Ace +/+ or Ace −/− mice. The splenocytes were boosted and restimulated similar to panel a. IFN-γ secreting CD8+ T cells were measured. (c) Ace −/− mice were immunized, boosted and restimulated with Mφ from either Ace +/+ or Ace −/− mice of the same gender. IFN-γ secreting CD8+ T cells were measured. (d) TCR Vβ usage was measured in splenic CD8+ T cells before and after infection with polyomavirus (PyV). Vβ chains with different usage patterns between Ace +/+ and Ace −/− are shown. Data are the average of 6 Ace +/+ mice and 4 Ace −/− mice. *P<0.05; **P<0.01; ***P<0.005.
Using a similar approach, we next investigated self-antigen presentation by Ace −/− cells. Now, the female Ace+/+ mice immunized with male Ace −/− cells showed a CD8+ T cell response to the Uty and Smcy peptides that was only 50% that of female Ace+/+ mice immunized with male Ace+/+ cells (Fig. 4b). However, when restimulation was performed with male macrophages, there was a much stronger response in the female Ace+/+ mice immunized with Ace −/− cells (29% IFN-γ+) as compare to those immunized with Ace +/+ cells (4% IFN-γ+). Further, when female Ace+/+ mice were immunized with male Ace −/− cells, but expanded and restimulated with female Ace −/− cells, there was also a very robust CD8+ T cell response (23% IFN-γ+), which was not seen in female Ace +/+ mice immunized with male Ace+/+ cells and then expanded and restimulated with female Ace +/+ cells (1% IFN-γ+). A similar result was obtained when, instead of macrophages, the immunizing and stimulating cells were total splenocytes (Supplementary Fig. 6a). That female Ace −/− cells elicit such a strong response from female Ace+/+ mice implies that the Ace−/− cells present a surface repertoire containing some novel peptides. Supporting this argument, the final yield of CD8+ T cells from Ace+/+ mice immunized and boosted with Ace−/− cells was substantially more than equivalent mice treated with Ace+/+ cells (Supplementary Fig. 6a,b).
A potential concern of the above data is that, while the Ace −/− mice are highly inbred to C57BL/6, it is conceivable that the cross immunization response may be directed at different minor histocompatibility loci. To test this, we asked whether, in vivo, ACE inhibitor treatment would change the class I peptide repertoire of Ace +/+ cells. Specifically, Ace +/+ mice were immunized and their splenocytes were boosted with Ace−/− macrophages from mice of the same gender as the recipients. However, for the final restimulation step, we used either Ace+/+ cells from syngeneic mice or Ace+/+ cells from syngeneic mice treated with ramipril for 6 d (Supplementary Fig. 7). Although less robust than the response to Ace−/− cells, the cells from Ace+/+ mice treated with ramipril activated a very significant population of CD8+ T cells, which was not observed when using cells from untreated Ace+/+ mice (9.1% vs. 1.4%). Thus, pharmacologic inhibition of ACE activity caused a significant shift in the presented class I peptide repertoire of syngeneic cells, mimicking the Ace−/− phenotype.
To further investigate if peptides presented by MCH class I proteins are responsible for the cross immunization results, we examined whether the CD8+ T cell response of Ace+/+ mice to the Ace−/− cells could be inhibited when the restimulating Ace−/− cells were pre-blocked with antibody specific to H-2Db. As shown in Supplementary Fig. 7, antibody (Clone B22.249) inhibited this response by almost 60%. We assume a significant part of the remaining activity was due to Kb presentation, which was not blocked in the experiment. Thus, the magnitude of the effect seen with anti-Db compliments the pharmacologic approach in showing that the immune response is not directed towards minor histocompatiblity loci but towards antigens presented by MHC class I molecules.
To further investigate whether Ace−/− mice express all peptide epitopes present in wild-type mice or whether some wild-type epitopes are lost, Ace−/− mice were immunized, boosted and restimulated with macrophages from either Ace+/+ or Ace−/− mice (Fig. 4c). In all instances, immunizing cells were the same gender as recipients. While Ace−/− mice immunized with Ace−/− cells showed essentially no response (about 1% IFN-γ+ CD8+ T cells), equivalent mice immunized with Ace+/+ cells showed a very strong response (22% IFN-γ+). Also, the final yield of CD8+ T cells from Ace−/− mice was substantially more when immunized and boosted with Ace+/+ macrophages, as compared to those with Ace−/− cells (Supplementary Fig. 6c). As all mice are on a C57BL/6 background, these data support the conclusion that the surface peptide repertoire of Ace+/+ and Ace−/− cells are different from each other.
Another way to assess presentation of peptides is to examine T cell receptor (TCR) diversity. If the presence or the absence of ACE is associated with different processing of peptide antigens, this may be reflected by differences in TCR Vβ usage. To examine this, we measured the CD8+ T cell Vβ repertoire using splenocytes isolated from Ace+/+ and Ace−/− mice. We also examined Vβ usage after acute mouse polyomavirus (PyV) infection (Supplementary Fig. 8), since we previously found that ACE has different effects on the expression of PyV Large T antigen versus Middle T antigen14. Differences were found in Vβ chain usage both before and 8 d after PyV infection between Ace+/+ and Ace−/− mice (Fig. 4d). For example, before infection, Vβ chain 3 is more frequent in CD8+ T cells from Ace+/+ mice than Ace−/− mice. However, after infection, this reverses, with Ace−/− mice expressing a higher percentage of Vβ chain 3. Differences in usage were noticed with Vβ chains 3, 7, 8.1/8.2, 9 and 10b.
ACE edits self-antigens
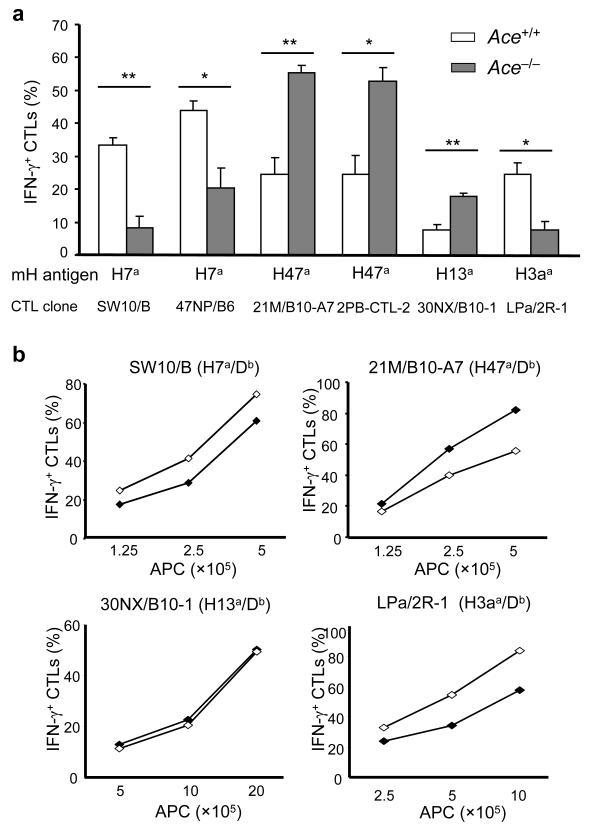
The general changes of MHC class I peptide repertoires between Ace+/+ and Ace−/− mice led us to examine their difference in the presentation of individual peptides. We thus measured a panel of minor histocompatibility (mH) antigens specifically expressed by C57BL/6 mice. The quantity of individual mH antigens was assessed by antigen-specific CTL clones. When this was performed using IFN-γ-primed fibroblasts from Ace /+ and Ace−/− mice, we observed that the Ace−/− cells were profoundly deficient in presented H7a and H3aa antigens, but expressed increased amounts of H47a and H13a (Fig. 5a). Consistent with this, when macrophages from ACE 10 mice were compared to equivalent Ace+/+ cells, ACE 10 cells presented more H7a and H3aa, but less H47a (Fig. 5b). Expression of H13a was equivalent between ACE 10 and Ace+/+. These results indicate that ACE can directly affect self-antigen presentation with positive or negative effects.
Figure 5.
The effect of ACE in editing self-antigens. (a) IFN-γ primed skin fibroblasts from Ace +/+ or Ace −/− mice were individually coincubated with CTL clones specific to different minor H (mH) antigens. The percentage of IFN-γ+ cells among total CTL (CD8+) cells was determined by flow cytometry. Data are the means + s.e.m. of fibroblasts from 4 pairs of mice. *P<0.02; **P<0.005. (b) The indicated number of bone marrow-derived Ace +/+ (◆) and ACE 10 (◇) Mφ were incubated with the CTL clones. The percentage of IFN-γ+ CTLs was determined by flow cytometry. The data shown are representative of 3 independent experiments.
ACE affects the presentation of viral antigens
We also measured the impact of ACE on the presentation on polyomavirus-derived antigens. Eight days after the infection of Ace+/+ and Ace−/− mice, the splenic CD8+ T cell responses to three dominant or subdominant PyV antigens were measured (LT359-368 (Db), MT246-253 (Kb) and LT638-646 (Db), Fig. 6a)26. Compared to Ace+/+ littermates, Ace−/− mice showed reduced responses to the dominant LT359-368 and subdominant MT246-253, but an increased response to the subdominant epitope LT638-646.
Figure 6.
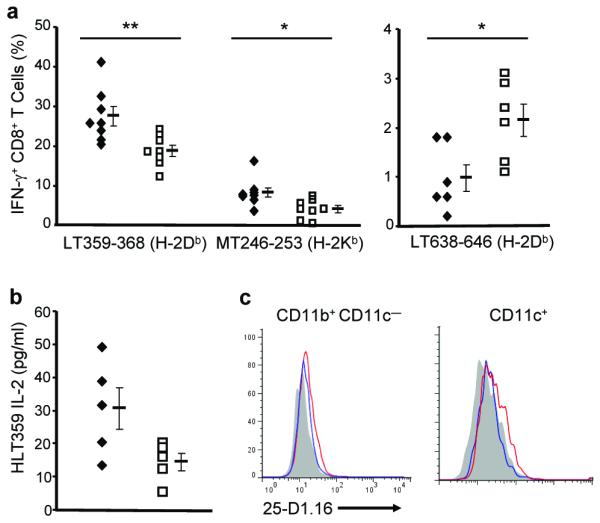
The impact of ACE in presenting viral antigens. (a) Ace +/+ (◆) and Ace −/− (□) mice were intraperitoneally infected with PyV, and splenic CD8+ T cell responses to the indicated PyV epitopes were measured 8 d post-infection by flow cytometry. * P = 0.02; ** P < 0.01. (b) 3 d after PyV.OVA-I infection, the surface expression of Db-LT359-368 on Ace +/+ (◆) and Ace −/− (□) splenocytes was measured using the HLT359 hybridoma. P = 0.063. (c) The surface expression of Kb-SIINFEKL on splenic CD11b+ CD11c− and CD11c+ cells was measured 3 d after PyV.OVA-I infection using the 25-D1.16 antibody. Naïve cells (shaded), Ace +/+ cells (red) and Ace −/− cells (blue). Data are representative of 5 pairs of mice from 3 independent experiments.
To directly measure the presentation of viral antigens by APCs, we infected mice with PyV.OVA–I, which expresses the ovalbumin Kb-dominant SIINFEKL within the sequence of the PyV Middle T antigen27. Three days post-infection, we fixed the splenocytes and measured the presentation of Db-LT359-368 by incubating with the available hybridoma HLT359 (Fig. 6b). Splenocytes from PyV.OVA–I infected Ace−/− mice elicited decreased responses, which is consistent with the readout of the LT359-368 specific T cell response. We also measured the surface Kb-SIINFEKL expression on the splenocytes using the antibody 25-D1.16. Cells were co-stained with anti-CD11b and anti-CD11c to distinguish APCs (Fig. 6c). Not surprisingly, CD11c+ DCs were more efficient in presenting SIINFEKL than CD11b+CD11c− myeloid cells. However, both populations of Ace−/− cells were less efficient in presenting SIINFEKL than their Ace+/+ counterparts. Thus, we conclude that ACE can also affect class I presentation of virally expressed antigens.
ACE works as a carboxyl dipeptidase on proteasome products
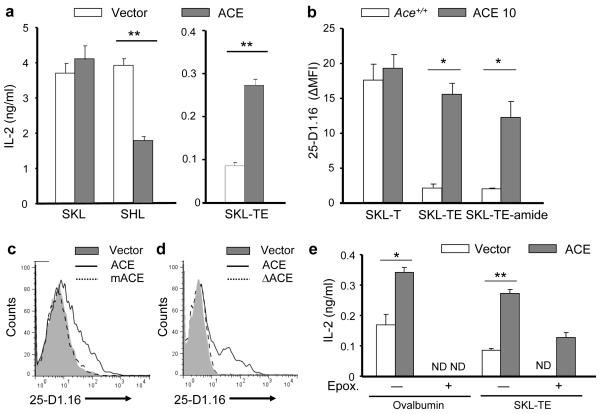
To understand the biochemical activity of ACE in the setting of antigen processing, we made use of the SIINFEKL (SKL) as the model epitope (a scheme of the peptides used in these experiments is listed in Supplementary Table 1). When L.Kb cells were transfected with an SKL minigene, ACE co-transfection did not affect the presentation of SKL (Fig. 7a). However, when the penultimate lysine of SKL was replaced with histidine, a residue more easily cleaved by ACE28, ACE co-transfection decreased the SHL presentation as tested by B3Z hybridoma cells29. ACE expression also significantly enhanced the presentation of SKL-TE, a C-terminal 2-mer extended SKL precursor. Not surprisingly, the ACE over-expressing ACE 10 macrophages were more efficient in processing the SKL-TE peptide than Ace+/+ macrophages (Fig. 7b and Supplementary Fig. 9a). C-terminal amide modification can block monopeptidase activity. However, ACE 10 macrophages processed SKL-TE-amide almost as efficiently as SKL-TE, while the ability to present the 1-mer extended SKL-T was comparable between ACE 10 and Ace+/+ macrophages. These experiments verified that ACE works as a carboxyl dipeptidase in MHC class I antigen processing. ACE did not work as an aminopeptidase because Ace−/−, Ace+/+ and ACE 10 macrophages were equivalent in the processing of N-terminal extended E-SKL and LE-SKL when these were nucleofected as minigenes (Supplementary Fig. 9b). Further, the use of N-terminal extended SKL precursors showed that ACE expression does not appear to change the basic machinery of antigen presentation.
Figure 7.
ACE works as a carboxyl dipeptidase on proteasome products. (a) L.Kb cells were transfected with minigenes expressing the indicated peptides. Cells were also co-transfected with an ACE-expressing construct or an empty vector. The efficiency of antigen presentation was tested by measuring the IL-2 expression of co-incubated B3Z hybridoma cells. Data are pooled from 4 independent experiments. (b) Mφ from Ace +/+ and ACE 10 mice were pulsed with the indicated peptides. SKL presentation was evaluated using the antibody 25-D1.16. Data (ΔMFI) were calculated as the raw MFI minus the background MFI, which was determined by staining the naïve cells. Data are pooled from 3 independent experiments. (c) L.Kb cells were transfected with the SKL-TE minigene. Cells were co-transfected with an empty vector or a construct expressing wild-type ACE or catalytic domain mutated ACE (mACE). SKL presentation was evaluated 24 h later. (d) TAP-deficient RMA-S cells were nucleofected with a minigene expressing the ER-directed SKL-TE14. Cells were co-transfected with an empty vector or the construct expressing wild-type ACE or N-terminal signal truncated ACE (ΔACE). SKL presentation was evaluated. The histograms are representative of 3 independent experiments for c,d. (e) L.Kb cells were co-transfected with constructs expressing ovalbumin or SKL-TE, and an empty vector or an ACE-expressing construct. Some cells were treated with the proteasome inhibitor epoxomicin (Epox.) after transfection. SKL presentation was examined by B3Z cell IL-2 expression. ND indicates non-detectable. Data are pooled from at least three independent experiments; *P<0.02; **P<0.005.
To directly assess the catalytic activity of ACE in processing SKL, SHL and C-terminal extended precursors, we incubated the individual peptides with recombinant human ACE for 1 h and subjected the digestion products to liquid chromatography-mass spectrometry (LC-MS) analysis. ACE did not produce appreciable N-terminal truncated fragments from any of these peptides. While the C-terminal 2 amino acids (2-mer) of SKL could be mildly removed by ACE in vitro, the efficiency of ACE in degrading SHL to SIINFE was much superior (KcatSHL/ KcatSKL = 3.98, Supplementary Fig. 10a). ACE could not digest SKL-T or SKL-TEWT, but it could remove the C-terminal 2-mer of SKL-TE and SKL-TEW (Supplementary Fig. 10b,c). For all peptides tested, ACE did not remove the C-terminal 1-mer, 3-mer or 4-mer. These data are consistent with what we observed in the in vivo peptide processing assays presented above and indicate that ACE is a carboxyl dipeptidase.
To verify that ACE edits MHC class I peptides through its catalytic domains and can function in the ER, we generated mutated ACE cDNA constructs that were either functionally inactive or could not enter the ER. The mACE protein, discussed previously, was made by mutating the two zinc-binding motifs of the ACE catalytic domains from HEMGH to KEMGK30. mACE protein appears to be expressed in transfected cells equivalent to wild-type ACE in flow cytometry analysis (Supplementary Fig. 11a). Only ACE but not mACE enhanced the presentation of SKL from SKL-TE in L.Kb cells (Fig. 7c). Secondly, we made a truncated ACE (ΔACE) by removing the first 29 amino acids, which is the hydrophobic signal peptide13. ΔACE is catalytically active because, once transfected, the protein helps L.Kb cells to process SKL-TE (Supplementary Fig. 11b). However, only ACE but not ΔACE can enhance the presentation of ER-directed SKL-TE in TAP-deficient RMA-S cells (Fig. 7d).
It is the proteasome that makes the bulk of the raw peptide pool for MHC class I presentation. However, some proteinases have been shown to expose antigenic peptides in a proteosome-independent manner11. We thus studied the relative contribution of the proteasome and of ACE to the processing of either ovalbumin protein or SKL-TE. When both ovalbumin and ACE were expressed in L.Kb cells, ACE increased the presentation of SKL (Fig. 7e). However, when proteasome activity was blocked with the inhibitor epoxomicin, this totally abrogated SKL presentation from ovalbumin, whether or not ACE was present. In contrast, when SKL-TE was expressed in L.Kb cells, ACE coexpression enhanced SKL presentation, and this was reduced, but not eliminated with epoxomicin, consistent with published data showing that the proteasome can cleave C-termini of extended peptide precursors9. These data suggest that ACE trims peptides produced first by proteasome activity.
DISCUSSION
Here, we show that the surface MHC class I peptides presented by ACE deficient and wild-type cells are different. This conclusion is supported by cross immunization studies, analysis of TCR Vβ usage, expression patterns of minor histocompatibility antigens and the examination of viral antigen presentation. A role for ACE in processing MHC class I peptides was shown in macrophages, DCs and fibroblasts. These data suggest that, under physiologic conditions, ACE actively participates in the intracellular peptide processing for MHC class I presentation. Further, ACE serves a unique antigen processing function in mice since other enzymes apparently cannot compensate for the absence of ACE.
Previous studies have examined C-terminal cleavage of MHC class I peptide precursors when proteasome activity was inhibited9,31,32,33. These studies led to the belief that only the proteasome affects the C-termini of MHC class I peptides and thus argued against the involvement of carboxypeptidases. However, in light of a recent publication11 and now by the analysis presented here, this idea seems untenable. While we are not certain why previous studies did not detect carboxypeptidase activity, one possibility is that perhaps, unlike ERAP, ACE expression may be extremely low in the cell lines originally used to study this question. For example L cells (a common cell line used in such studies) have 2 logs less ACE mRNA, as compared to macrophages and DCs (data not shown). These experiments also neglected the possibility of inducible carboxypeptidase in professional APCs, especially in the setting of inflammation.
The predominant action of ACE is to cleave C-terminal dipeptides from oligopeptide substrates. ACE has wide substrate specificity. Some studies have shown that ACE can even remove C-terminal tripeptides (from substance P) and cleave N-terminal tripeptides (from luteinizing hormone-releasing hormone)34. However, the in vivo significance of these unusual ACE catalytic activities is not known. What is clear is that ACE can cleave peptides ranging from three amino acids (HHL)13 to over 40 amino acids (amyloid β peptide)35. Because of this property, ACE may not work as a “molecular ruler” in editing peptides for MHC class I loading, as is postulated for ERAP36.
We tested the correlation between ACE expression and surface MHC class I expression, and found that out of 7 MHC class I molecules, 4 (Kb, Db, Kd and Dk) showed significant inverse correlation to ACE abundance. Expression of MHC class I on the cell surface depends on the assembly of peptide-MHC class I complexes in the ER and their stability. In ACE-deficient cells, the augmented Kb and Db expression was probably due to a more abundant peptide supply rather than to a slower dissociation rate of peptide-MHC class I complexes. This inverse correlation between ACE and peptide supply is not seen when studying ERAP or TAP. The unusual effect of ACE may result from the mechanism of TAP peptide selection. Sequencing of MHC class I peptide motifs revealed that the C-terminus is usually the conservative anchor residue5. TAP has substrate selection when transporting peptides from the cytosol to the ER37,38. Mouse TAP, in particular, prefers peptides with hydrophobic residues at their C-termini39,40, which in most cases matches class I specificity. Thus, when an ER carboxypeptidase exists, it may be more destructive than constructive in shaping the quantity of peptides suitable for MHC class I presentation. Nonetheless, for any individual epitope, ACE action may increase, decrease or presumably not affect expression. In our studies, ACE-deficient mice immunized with wild-type cells produced a robust CD8+ T cell response to antigens found on wild-type cells. This strongly indicates that a wild-type set of epitopes rely on ACE for exposure. Indeed, the induction of ACE in APCs by either IFN-γ or L. monocytogenes implies a physiologic advantage during immunologic challenge. Given the terrific sensitivity of T cells for detecting presented epitopes, the advantage of increasing peptide diversity may outweigh the disadvantage of a somewhat reduced number of particular epitopes.
Finally, we note that either ACE depletion or ACE over-expression changes immunogenicity. Millions of patients take ACE inhibitors. Whether the concentrations of these drugs are sufficient to have any effects on surface class I levels or class I peptide presentation will be important to study.
METHODS
Mice
Ace −/− mice and ACE 10 mice were described previously21,22. Both lines were backcrossed to C57BL/6 for 10 or more generations. To make Pd mice, ACE cDNA was cloned in pBS, an expression vector that was previously modified to contain the 5.3 kd CD11c-promoter41 (generous gift of C. Ried, University of Munich). C57BL/6 transgenic Pd mice were generated by the core facility of Emory University. C57BL/6 and BALB/c mice were purchased from Jackson Laboratory. Some mice were treated with ramipril (8 mg/kg/day) (Sigma) in water. Procedures and animal experiments were approved by the Institutional Animal Care and Use Committee at Cedars-Sinai Medical Center.
Cells
TPMs were prepared as described14. Fresh bone marrow was cultured with either M-CSF or GM-CSF and IL-4 for 7 d to expand bone marrow-derived Mφ or DCs respectively. Splenic DCs were purified using CD11c+ magnetic beads (Miltenyi Biotec). Monocytes were sorted from bone marrow. Skin-derived fibroblasts were prepared by incubating minced tissue twice in a buffer consisting of collagenase (0.3 mg/ml), trypsin (0.05%) and EDTA (0.53mM) at 37°C for 45 min. Single cells were prepared and resuspended in MEM media supplemented with 10% FBS and cultured under standard conditions.
Antibodies
The following antibody clones were used: AF6-88.5 (anti-H-2Kb), KH95 (anti-H-2Db), AF3-12.1.3 (anti-H-2Kk), 15-5-5 (anti-H-2Dk), SF1-1.1 (anti-H-2Kd), 34-2-12 (anti-H-2Dd), 28-14-8 (anti-H-2Ld), 16-10A1 (anti-CD80), GL1 (anti-CD86), AF6-120.1 (anti-I-Ab), 53.6.7 (anti-CD8), M1/70 (anti-CD11b), N418 (anti-CD8a), BM8 (anti-F4/80) and XMG1.2 (anti-IFN-γ). All the antibodies above were purchased from either eBioscience, BioLegend or Pharmingen. The H-2Db-specific antibody clone B22-249 is from Cedarlane. The polyclonal rabbit-anti-ACE antibody was described previously42. The 25D-1.16 antibody was made by R. Germain (US National Institute of Health). The FITC-conjugated mouse TCR Vβ Screening Panel kit was from BD Pharmingen. It was co-stained with PE-conjugated anti-CD8a. The stained samples were analyzed on a Beckman Coulter CyAn ADP and data were analyzed with FlowJo software.
Real-time quantitative PCR
ACE expression was quantified by RT-PCR using QuantiTect SYRB Green dye (Qiagen). DNA amplification was carried-out using an Icycler (Bio-Rad). We used the ACE primer set 5′-TAGGCTGCCTCCTTTATGTG-3′ and 5′-GTGGTCACGGATTAATGCTC-3′. ACE and GAPDH primer sets were synthesized by Invitrogen. The relative quantities of ACE as compared to the internal control, GAPDH, were calculated and an amplification plot with fluorescence signal vs cycle number was drawn.
MHC class I supply and surface stability
The rate of MHC class I surface expression was measured by monitoring MHC class Iexpression after incubating cells in ice cold acid stripping buffer (0.131M sodium citrate, 0.066M sodium phosphate and 1% BSA, pH 3) for 2 min. The cell suspension was neutralized by adding 10-fold volume of cold IMEM medium and washed two times. Cells were then cultured in IMEM supplemented with 10 mM HEPES pH 7.4, 0.5 mM sodium pyruvate and β-mercaptoethanol for recovery. For measurements of the dissociation of surface peptide-MHC class I complexes, cells were cultured in the same medium used for acid stripping recovery but containing 7 μg/ml brefeldin A (eBioscience). We also established parallel cell cultures without any treatment as the control maximum (100%) for each time point. At different time points, cells were stained with FITC-conjugated H-2Kb and PE-conjugated H-2Db, as well as 7-AAD, and subjected to flow cytometry analysis.
Immunization and CD8+ T cell response
Female mice of one strain were immunized intraperitoneally with 1 × 10⁷ male TPMs from another strain, or as control, from mice of the same strain. 10 d after immunization, 2.4 × 10⁷ splenocytes from the recipients were expanded-boosted in one well of 6-well plate with 2 × 10⁶ Mφ from either male or female mice of the strain used as the immunizer. The cultures included 20 U/ml of IL-2 (eBioscience). After 7 d, dead cells were removed and lymphocytes were purified by Ficoll fractionation (GE Healthcare). The harvested lymphocytes were counted and anti-CD8+ staining was used with flow cytometry to estimate the yield of the CD8+ T cells. In the presence of brefeldin A, the CD8+ T cell responses of the immunized mice were measured by flow cytometry for inducible IFN-γ production after a 5 h exposure to the indicated peptides or cells. For testing the CD8+ T cell responses to HY peptides, 5 μM of the relative HY peptide and Mφ from female Ace +/+ mice (as APCs) were coincubated. When using splenocytes as the immunizer, 2 × 10⁷ splenocytes were injected intraperitoneally. 10 d later, the splenocytes from the immunized mice were expanded as above but with 1 × 10⁷ irradiated splenocytes from mice of the same genotype used as the immunizer and 50 U/ml of IL-2. After 5 d, a subsequent reboosting was followed with freshly irradiated splenocytes and 20 U/ml of IL-2 for another 7 d. Then, LPS-stimulated CD8+ T cell-depleted splenocytes were used as the restimuli for testing inducible CD8+ T cell IFN-γ production. For inhibition of presentation by H-2Db, Ace −/− cells used for restimulation were pre-incubated for 20 min at 4 °C with antibody B22.249 (23) before being cultured together with Ficoll-purified CD8+ T cells.
Cell transfection
ACE, ovalbumin and GFP expressing constructs and peptide minigenes were made as described15. L929 and L.Kb cells were transiently transfected with FuGENE HD (Roche); A20 cells were transfected with DEAE-dextran (Millipore). For testing surface MHC class I changes after ACE expression, cells were co-transfected with either the ACE-expressing construct or the empty vector and a GFP expressing plasmid to allow identification of transfected cells. Mφ were transfected with a nucleofector (Lonza). Cells were harvested 24-48 h later for further assays.
Antigen presentation assays
To evaluate the presentation of mH antigens, Mφ or IFN-γ primed fibroblasts were co-incubated with mH antigen-specific CTL clones (kind gifts from D. Roopenian, the Jackson Laboratory). Cells were co-cultured for 1 h, after which 7 μg/ml brefeldin A was added and cells were incubated for an additional 5 h. Cells were then surface stained with anti-CD8+ antibody followed by IFN-γ intracellular staining (eBioscience) and flow cytometry analysis. For testing ACE in processing ovalbumin-related antigens, DNA constructs were transfected into L.Kb cells. In some of the experiments, 1 μM epoximicin (Cayman Chemical) was added 8 h after transfection. After 24 h, cells were washed, and fixed with paraformaldehyde and neutralized with glycine. After further washing, B3Z hybridoma cells were then seeded. Supernatants were collected 20 h later for IL-2 ELISA (eBioscience).
Listeria and polyoma virus infection
Listeria monocytogenes strain EGD was a gift from R. Ahmed (Emory University). 3 × 10⁴ CFU cells were injected intravenously and after 48 h, mice were sacrificed and a splenic single cell suspension was prepared for ACE and cell subpopulation staining. Polyomavirus (PyV) strain A2 and PyV.OVA–I were described previously (38). PyV.OVA–I was generated by inserting the SIINFEKL coding sequence into the gene of Middle T antigen. For testing TCR Vβ usage, 2 × 10⁶ PFU of PyV were injected intraperitoneally (i.p.) and after 8 d, splenocytes were prepared. For testing CD8+ T cell responses to PyV antigens, 1 × 10⁵ PFU of PyV were injected i.p. Eight days later, splenocytes from the infected mice were restimulated with individual PyV peptides and IFN-γ+ CD8+ T cells were quantitated. For examining the presentation of viral antigens on APCs, 1 × 10⁶ PFU of PyV.OVA–I were injected i.p. and 3 days later, splenocytes were harvested and fixed. 5 × 10⁶ splenocytes were coincubated with 4 × 10⁵ hybridoma HLT359 cells for 20 h and supernatant IL-2 was evaluated by ELISA. Some of the splenocytes were directly stained with antibody 25-D1.16, anti-CD11b and anti-CD11c, and SIINFEKL presentation was examined by flow cytometry.
Peptides
Smcy (KCSRNRQYL) and Uty (WMHHNMDLI) peptides were purchased from AnaSpec. All other peptides were synthesized and HPLC purified by LifeTein or Peptide 2.0.
Peptide digestion and mass spectrometry
SKL related peptides were incubated with 0.01 unit of recombinant human ACE (EMD Chemicals) for 0.5 h or 1 h in 50 μl reaction buffer (75 mM NaCl, 1 μM ZnCl2 and 12.5 mM Tris-HCl, pH 7.4) at 37 °C. One unit of ACE is defined as the amount of enzyme that will cleave 1 nmol MCA-RPPGFSAFK(DNP)-OH per min. Reaction was stopped by adding 10 μM EDTA and moving onto ice. Liquid chromatography–mass spectrometry (LC-MS) experiments were performed by the UCLA Molecular Instrumentation Center. Briefly, LC-MS was performed with a Waters Acquity UPLC connected to a Waters LCT-Premier XE Time of Flight Instrument controlled by MassLynx 4.1 software. The mass spectrometer was equipped with a Multi-Mode Source operated in the electrospray mode. Peptide samples were separated using an Acquity BEH C18 1.7 um column (2.1 × 50 mm) and were eluted with a gradient of 2 – 50% solvent B over 10 min (solvent A: water, solvent B: acetonitrile, both with 0.2% formic acid (vol/vol)). Mass spectra were recorded from a mass of 300–2000 daltons.
Statistics
P value was generated using two-tail Student’s T test.
Supplementary Material
ACKNOWLEDGMENTS
We thank S. Fuchs and E. Bernstein for vector construction, D. Roopenian and G. Christianson (Jackson Laboratories) for generously providing the minor H CTL clones and assisting in culturing, G. Khitrov (UCLA) for assistance in LC-MS, G. E. Hammer (UCSF) for technical assistance for immunization and Q. Xu for RT-PCR assistance. We also thank S. McLachlan for sharing A20 cells and C. Ried, (University of Munich) for the CD11c promoter DNA. We appreciate the administrative support from B. Taylor. This work was supported by the National Institutes of Health grant R01 DK 039777 to K. E. Bernstein.
Footnotes
AUTHOR CONTRIBUTIONS X.Z.S. conceived of the study and designed the experiments. X.Z.S. and S.B. contributed major input in performing the experiments with minor input from C.L., D.O-D. and X.C.. A.E.L. provided intellectual advice and all the reagents for the experiments related to polyomavirus. K.E.B. provided intellectual advice and coordinated the project. X.Z.S. and K.E.B. wrote the manuscript.
COMPETING FINANCIAL INTERESTS The authors declare no competing financial interests.
REFERENCES
- 1.Jensen PE. Recent advances in antigen processing and presentation. Nat Immunol. 2007;8:1041–1048. doi: 10.1038/ni1516. [DOI] [PubMed] [Google Scholar]
- 2.Wearsch PA, Cresswell P. The quality control of MHC class I peptide loading. Curr Opin Cell Biol. 2008;20:624–631. doi: 10.1016/j.ceb.2008.09.005. [DOI] [PMC free article] [PubMed] [Google Scholar]
- 3.Purcell AW, Elliott T. Molecular machinations of the MHC-I peptide loading complex. Curr Opin Immunol. 2008;20:75–81. doi: 10.1016/j.coi.2007.12.005. [DOI] [PubMed] [Google Scholar]
- 4.Rock KL, York IA, Goldberg AL. Post-proteasomal antigen processing for major histocompatibility complex class I presentation. Nat Immunol. 2004;5:670–677. doi: 10.1038/ni1089. [DOI] [PubMed] [Google Scholar]
- 5.Rammensee HG, Friede T, Stevanoviíc S. MHC ligands and peptide motifs: first listing. Immunogenetics. 1995;41:178–228. doi: 10.1007/BF00172063. [DOI] [PubMed] [Google Scholar]
- 6.Saveanu L, Carroll O, Hassainya Y, van Endert P. Complexity, contradictions, and conundrums: studying post-proteasomal proteolysis in HLA class I antigen presentation. Immunol Rev. 2005;207:42–59. doi: 10.1111/j.0105-2896.2005.00313.x. [DOI] [PubMed] [Google Scholar]
- 7.Serwold T, Gonzalez F, Kim J, Jacob R, Shastri N. ERAAP customizes peptides for MHC class I molecules in the endoplasmic reticulum. Nature. 2002;419:480–483. doi: 10.1038/nature01074. [DOI] [PubMed] [Google Scholar]
- 8.Saric T, et al. An IFN-gamma-induced aminopeptidase in the ER, ERAP1, trims precursors to MHC class I-presented peptides. Nat Immunol. 2002;3:1169–1176. doi: 10.1038/ni859. [DOI] [PubMed] [Google Scholar]
- 9.Mo XY, Cascio P, Lemerise K, Goldberg AL, Rock K. Distinct proteolytic processes generate the C and N termini of MHC class I-binding peptides. J Immunol. 1999;163:5851–5859. [PubMed] [Google Scholar]
- 10.Rammensee HG. Peptides made to order. Immunity. 2006;25:693–695. doi: 10.1016/j.immuni.2006.10.008. [DOI] [PubMed] [Google Scholar]
- 11.Kessler JH, et al. Antigen processing by nardilysin and thimet oligopeptidase generates cytotoxic T cell epitopes. Nat Immunol. 2011;12:45–53. doi: 10.1038/ni.1974. [DOI] [PubMed] [Google Scholar]
- 12.Hooper NM. Angiotensin converting enzyme: implications from molecular biology for its physiological functions. Int J Biochem. 1991;23:641–647. doi: 10.1016/0020-711x(91)90032-i. [DOI] [PubMed] [Google Scholar]
- 13.Corvol P, Williams TA, Soubrier F. Peptidyl dipeptidase A: angiotensin I-converting enzyme. Methods Enzymol. 1995;248:283–305. doi: 10.1016/0076-6879(95)48020-x. [DOI] [PubMed] [Google Scholar]
- 14.Shen XZ, Lukacher AE, Billet S, Williams IR, Bernstein KE. Expression of angiotensin-converting enzyme changes major histocompatibility complex class I peptide presentation by modifying C termini of peptide precursors. J Biol Chem. 2008;283:9957–9965. doi: 10.1074/jbc.M709574200. [DOI] [PMC free article] [PubMed] [Google Scholar]
- 15.Harmer D, Gilbert M, Borman R, Clark KL. Quantitative mRNA expression profiling of ACE 2, a novel homologue of angiotensin converting enzyme. FEBS Lett. 2002;532:107–110. doi: 10.1016/s0014-5793(02)03640-2. [DOI] [PubMed] [Google Scholar]
- 16.Danilov SM, et al. Angiotensin-converting enzyme (CD143) is abundantly expressed by dendritic cells and discriminates human monocyte-derived dendritic cells from acute myeloid leukemia-derived dendritic cells. Exp Hematol. 2003;31:1301–1309. doi: 10.1016/j.exphem.2003.08.018. [DOI] [PubMed] [Google Scholar]
- 17.Saijonmaa O, Nyman T, Fyhrquist F. Atorvastatin inhibits angiotensin-converting enzyme induction in differentiating human macrophages. Am J Physiol Heart Circ Physiol. 2007;292:H1917–1921. doi: 10.1152/ajpheart.00920.2006. [DOI] [PubMed] [Google Scholar]
- 18.Eisenlohr LC, Bacik I, Bennink JR, Bernstein K, Yewdell JW. Expression of a membrane protease enhances presentation of endogenous antigens to MHC class I-restricted T lymphocytes. Cell. 1992;71:963–972. doi: 10.1016/0092-8674(92)90392-p. [DOI] [PubMed] [Google Scholar]
- 19.Kozlowski S, et al. Serum angiotensin-1 converting enzyme activity processes a human immunodeficiency virus 1 gp160 peptide for presentation by major histocompatibility complex class I molecules. J Exp Med. 1992;175:1417–1422. doi: 10.1084/jem.175.6.1417. [DOI] [PMC free article] [PubMed] [Google Scholar]
- 20.Strehl B, et al. Interferon-gamma, the functional plasticity of the ubiquitin-proteasome system, and MHC class I antigen processing. Immunol Rev. 2005;207:19–30. doi: 10.1111/j.0105-2896.2005.00308.x. [DOI] [PubMed] [Google Scholar]
- 21.Esther CR, et al. Mice lacking angiotensin-converting enzyme have low blood pressure, renal pathology, and reduced male fertility. Lab Invest. 1996;74:953–965. [PubMed] [Google Scholar]
- 22.Shen XZ, et al. Mice with enhanced macrophage angiotensin-converting enzyme are resistant to melanoma. Am J Pathol. 2007;170:2122–2134. doi: 10.2353/ajpath.2007.061205. [DOI] [PMC free article] [PubMed] [Google Scholar]
- 23.Hammer GE, Gonzalez F, James E, Nolla H, Shastri N. In the absence of aminopeptidase ERAAP, MHC class I molecules present many unstable and highly immunogenic peptides. Nat Immunol. 2007;8:101–108. doi: 10.1038/ni1409. [DOI] [PubMed] [Google Scholar]
- 24.Simpson E, Scott D, Chandler P. The male-specific histocompatibility antigen, H-Y: a history of transplantation, immune response genes, sex determination and expression cloning. Annu Rev Immunol. 1997;15:39–61. doi: 10.1146/annurev.immunol.15.1.39. [DOI] [PubMed] [Google Scholar]
- 25.Greenfield A, et al. An H-YDb epitope is encoded by a novel mouse Y chromosome gene. Nat Genet. 1996;14:474–478. doi: 10.1038/ng1296-474. [DOI] [PubMed] [Google Scholar]
- 26.Kemball CC, et al. Late priming and variability of epitope-specific CD8+ T cell responses during a persistent virus infection. J Immunol. 2005;174:7950–7960. doi: 10.4049/jimmunol.174.12.7950. [DOI] [PubMed] [Google Scholar]
- 27.Andrews NP, Pack CD, Lukacher AE. Generation of antiviral major histocompatibility complex class I-restricted T cells in the absence of CD8 coreceptors. J Virol. 2008;82:4697–4705. doi: 10.1128/JVI.02698-07. [DOI] [PMC free article] [PubMed] [Google Scholar]
- 28.Cushman DW, Cheung HS, Sabo EF, Ondetti MA. Design of potent competitive inhibitors of angiotensin-converting enzyme. Carboxyalkanoyl and mercaptoalkanoyl amino acids. Biochemistry. 1977;16:5484–5491. doi: 10.1021/bi00644a014. [DOI] [PubMed] [Google Scholar]
- 29.Kanaseki T, Blanchard N, Hammer GE, Gonzalez F, Shastri N. ERAAP synergizes with MHC class I molecules to make the final cut in the antigenic peptide precursors in the endoplasmic reticulum. Immunity. 2006;25:795–806. doi: 10.1016/j.immuni.2006.09.012. [DOI] [PMC free article] [PubMed] [Google Scholar]
- 30.Fuchs S, et al. Role of the N-terminal catalytic domain of angiotensin-converting enzyme investigated by targeted inactivation in mice. J Biol Chem. 2004;279:15946–15953. doi: 10.1074/jbc.M400149200. [DOI] [PubMed] [Google Scholar]
- 31.Craiu A, Akopian T, Goldberg A, Rock KL. Two distinct proteolytic processes in the generation of a major histocompatibility complex class I-presented peptide. Proc Natl Acad Sci U S A. 1997;94:10850–10855. doi: 10.1073/pnas.94.20.10850. [DOI] [PMC free article] [PubMed] [Google Scholar]
- 32.Stoltze L, et al. Generation of the vesicular stomatitis virus nucleoprotein cytotoxic T lymphocyte epitope requires proteasome-dependent and -independent proteolytic activities. Eur J Immunol. 1998;28:4029–4036. doi: 10.1002/(SICI)1521-4141(199812)28:12<4029::AID-IMMU4029>3.0.CO;2-N. [DOI] [PubMed] [Google Scholar]
- 33.Kunisawa J, Shastri N. The group II chaperonin TRiC protects proteolytic intermediates from degradation in the MHC class I antigen processing pathway. Mol Cell. 2003;12:565–576. doi: 10.1016/j.molcel.2003.08.009. [DOI] [PubMed] [Google Scholar]
- 34.Skidgel RA, Erdös EG. Angiotensin I converting enzyme. Adv Exp Med Biol. 1989;247A:25–28. doi: 10.1007/978-1-4615-9543-4_4. [DOI] [PubMed] [Google Scholar]
- 35.Hemming ML, Selkoe DJ. Amyloid beta-protein is degraded by cellular angiotensin-converting enzyme (ACE) and elevated by an ACE inhibitor. J Biol Chem. 2005;280:37644–37650. doi: 10.1074/jbc.M508460200. [DOI] [PMC free article] [PubMed] [Google Scholar]
- 36.Chang SC, Momburg F, Bhutani N, Goldberg AL. The ER aminopeptidase, ERAP1, trims precursors to lengths of MHC class I peptides by a “molecular ruler” mechanism. Proc Natl Acad Sci U S A. 2005;102:17107–17112. doi: 10.1073/pnas.0500721102. [DOI] [PMC free article] [PubMed] [Google Scholar]
- 37.Androlewicz MJ, Cresswell P. How selective is the transporter associated with antigen processing? Immunity. 1996;5:1–5. doi: 10.1016/s1074-7613(00)80304-0. [DOI] [PubMed] [Google Scholar]
- 38.Koopmann JO, Post M, Neefjes JJ, Hämmerling GJ, Momburg F. Translocation of long peptides by transporters associated with antigen processing (TAP) Eur J Immunol. 1996;26:1720–1728. doi: 10.1002/eji.1830260809. [DOI] [PubMed] [Google Scholar]
- 39.Schumacher TN, et al. Peptide length and sequence specificity of the mouse TAP1/TAP2 translocator. J Exp Med. 1994;179:533–540. doi: 10.1084/jem.179.2.533. [DOI] [PMC free article] [PubMed] [Google Scholar]
- 40.Momburg F, et al. Selectivity of MHC-encoded peptide transporters from human, mouse and rat. Nature. 1994;367:648–651. doi: 10.1038/367648a0. [DOI] [PubMed] [Google Scholar]
- 41.Lauterbach H, Gruber A, Ried C, Cheminay C, Brocker T. Insufficient APC capacities of dendritic cells in gene gun-mediated DNA vaccination. J Immunol. 2006;176:4600–4607. doi: 10.4049/jimmunol.176.8.4600. [DOI] [PubMed] [Google Scholar]
- 42.Cole J, et al. Lack of angiotensin II-facilitated erythropoiesis causes anemia in angiotensin-converting enzyme-deficient mice. J Clin Invest. 2000;106:1391–1398. doi: 10.1172/JCI10557. [DOI] [PMC free article] [PubMed] [Google Scholar]
Associated Data
This section collects any data citations, data availability statements, or supplementary materials included in this article.


