

Abstract
The gamma band response is thought to be a key neural signature of information processing in the mammalian brain, yet little is known about how age‐related maturation influences the γ‐band response. Recent MRI‐based studies have shown that brain maturation is accompanied by clear structural changes in both gray and white matter, yet the correspondence of these changes to brain function is unclear. The objective of this study was to relate visual cortex (V1) γ‐band responses to age‐related structural change. We evaluated MEG measured γ‐band responses to contrast gratings stimuli and structural MRIs from participants observed from two separate research centers (MEG lab at CUBRIC, Cardiff University, UK, and the Lurie Family Foundations MEG Imaging Center, (CHOP) at the Children's Hospital of Philadelphia). Pooled participant data (N = 59) ranged in age from 8.7 to 45.3 years. We assessed linear associations between age and MEG γ‐band frequency and amplitude, as well as between age and MRI volumetric parameters of the occipital lobe. Our MEG findings revealed a significant negative correlation for gamma band frequency versus age. Volumetric brain analysis from the occipital lobe also revealed significant negative correlations between age and the cortical thickness of pericalcarine and cuneus areas. Our functional MEG and structural MRI findings shows regionally specific changes due to maturation and may thus be informative for understanding physiological processes of neural development, maturation, and age‐related decline. In addition, this study represents (to our knowledge), the first published demonstration of multicenter data sharing across MEG centers. Hum Brain Mapp 33:2035–2046, 2012. © 2011 Wiley Periodicals, Inc.
Keywords: gamma band, development, MEG, magnetoencephalography, visual contrast gratings
INTRODUCTION
A growing body of research suggests that the γ‐band (∼40 Hz) response is a key neural signature of information processing in the mammalian brain. Invasive and noninvasive imaging studies have shown primary cortical γ‐band reactivity to auditory [Gurtubay et al., 2004; Steinschneider et al., 2008], visual [Adjamian et al., 2004; Hoogenboom et al., 2006; Muthukumaraswamy et al., 2009; Muthukumaraswamy and Singh, 2008], somatosensory [Bauer et al., 2006; Gaetz and Cheyne, 2003], and motor tasks [Cheyne et al., 2008; Gaetz et al., 2010]. Gamma‐band responses have also been associated with higher‐order cognitive functions such as attention [Fell et al., 2003; Muller et al., 2000], perception [Keil et al., 1999; Tallon‐Baudry et al., 1996, 1997), learning [Gruber et al., 2001; Miltner et al., 1999] memory [Lutzenberger et al., 2002; Tallon‐Baudry et al., 1998] and are disturbed in psychiatric disorders such as schizophrenia and autism [Lewis et al., 2005; Spencer et al., 2003; Uhlhaas and Mishara, 2007]. Gamma oscillations have also been proposed as a fundamental mechanism for cortical computation and long‐range communication between brain areas [Fries, 2009; Gregoriou et al., 2009].
Despite the importance of γ‐band cortical oscillations, identifying an effective stimulus to elicit a strong, artifact‐free and reliable γ‐band response has been challenging [Fries et al., 2008]. Recently, however, simple high‐contrast visual stimuli have gained prominence as a robust method to elicit cortical γ‐band activity in primate electrocorticographic (ECoG) studies [Vinck et al., 2010] and noninvasively using MEG [Adjamian et al., 2004; Hoogenboom et al., 2006; Muthukumaraswamy et al., 2009, 2010] in humans. In human MEG studies, vertical or concentric circle high‐contrast square‐wave grating stimuli (∼3 cycles per degree) are presented to central vision, or a single hemifield. These stimuli induce a robust γ‐band response from primary visual cortex (V1) that persists for the duration of the presented visual stimulus. These γ‐band responses show high between‐subject variability in amplitude and frequency, however, within‐subject repeated measures appear remarkably consistent [Hoogenboom et al., 2006; Muthukumaraswamy et al., 2010]. Similar between‐subject variability has been noted in ECoG [Rols et al., 2001] and LFP recordings [Lima et al., 2010]. Muthukumaraswamy et al. [2009] recently demonstrated that γ‐band frequency was correlated with magnetic resonance spectroscopic (MRS) measures of γ‐amino‐butyric acid (GABA) concentration. In a study exploring repeatability of gamma cortical oscillations, the same authors observed that γ‐band frequency tended to decrease with age in a healthy adult population [Muthukumaraswamy et al., 2010].
MRI imaging studies have described clear changes in cortical and subcortical brain structures which accompany normal aging. For example, in a recent study involving 148 healthy adults from three age groups (mean age: 28, 44, and 63 years), Salat et al. [2009] reported considerable regional changes in neural tissue properties with aging such as decreased MR signal intensity from both gray and white matter and decreased cortical thickness [Salat et al., 2009]. To quantify within‐subject changes in brain structure over time, Raz et al. [2010] investigated brain region of interest (ROI) volume changes in a population of middle‐aged and older adults on three repeated MRI measures taken over a 30‐month period [Raz et al., 2010]. The authors noted that in healthy individuals, brain volume is known to shrink significantly over relatively short time‐periods, and with marked individual variability in the rates of decline [Raz et al., 2010]. Interestingly, these studies show that age‐related decreases in cortical thickness appear to affect some cortical areas more than others. For example, Raz et al. [2010] reported that the greatest mean 30‐month change was observed in the hippocampus, whereas the pons did not change significantly over this time. Salat et al. [2009] reported that cortical thickness decreased most significantly with age in the superior frontal, precentral, postcentral, superior temporal, and occipital regions and increased with age in the medial frontal regions. Currently, the mechanisms that contribute to the changes in tissue properties and the functional and behavioral correlates of age‐related structural change remain unclear.
The purpose of this study was to examine MEG γ‐band responses and MRI measures of cortical thickness and volume in a population of participants over a broader age‐range (from 8 to 46 years) and to directly assess the influence of the participant's age on these functional and structural brain measures. Currently, there are no studies comparing visual γ‐band response over the life‐span, particularly in children. However, previous findings from adults [Muthukumaraswamy et al., 2010] predict that visual γ‐band frequency will be inversely related to participant's age. A subsidiary purpose, and notable feature of this article, is that it represents the accumulated efforts of two MEG laboratories (CUBRIC and CHOP) with data pooled across international sites. Although multicenter studies are becomingly increasingly common in large structural and functional MRI studies, this study represents (to our knowledge) the first demonstration of multicenter data sharing across MEG centers.
METHODS
This collaborative study involved the MEG lab at CUBRIC, Cardiff University, UK, and the Lurie Family Foundations MEG Imaging Center, at the Children's Hospital of Philadelphia, PA. Nearly identical data collection methods, visual stimuli, and analysis methods were used, with analysis and results across sites pooled (all differences are noted in Methods).
Participants
One significant challenge embedded in life‐span studies is to disentangle morphological and functional developmental change from the degenerative changes of late adulthood. Thus, by limiting inclusion of adults in our study up to 50 years (mid‐adulthood), we have attempted to limit the influence of degenerative processes affecting the structural and functional changes observed with normal aging.
Healthy adult (> 18 years) participants (CUBRIC; N = 33, CHOP; N = 13) ranged in age from 18.4 to 45.3 years (mean age = 31.4 years). In addition healthy child participants (CHOP; N = 13) ranged in age from 8.7 to 15.6 years. All procedures were approved by the local ethics committee. Participants were fitted with three electromagnetic head coils (nasion and preauriculars), which were used for monitoring within‐session head movement and for subsequent coregistration with each participant's MRI.
MEG Hardware
Both CHOP and CUBRIC MEG laboratories use the CTF‐Omega 275 channel radial gradiometer system (VSM MedTech). Whole‐head MEG recordings were sampled at 1,200 Hz (0–300 Hz band‐pass). Three sensors were turned off at CUBRIC due to excessive noise. Results from 31 adults participating at CUBRIC have been reported in a previously published manuscript [Muthukumaraswamy et al., 2010].
MEG Recording Methods
CUBRIC
MEG/MRI fiducial coregistration at CUBRIC was performed by placing fiduciary markers at fixed distances from anatomical landmarks identifiable in participants' anatomical MRIs (tragus, eye center). Fiduciary locations were verified afterwards using high‐resolution digital photographs.
Adult participants run at CHOP were volunteer researchers with previously acquired brain MRIs. For these participants, head surface and fiducial coil locations were digitized using Polhemus (Fastrak; Polhemus, USA). Fiducial coregistration was then based on in‐house surface matching software that aligned the head surface extracted from each subject's MRI with the Polhemus measured head shapes. As age‐related MRI/MEG analyses were planned, we ensured that all participants MRI acquisitions occurred within 1 year of the MEG recording date.
Pediatric participants at CHOP were enrolled in on‐going studies that included MRI structural scans recorded directly following the MEG recordings. For these participants, MRI contrast markers were placed at MEG fiducial coil locations, prior to the MRI recordings, and were used for fiducial coregistration.
Visual stimuli
These consisted of vertical, stationary, maximum contrast, three cycles per degree, square‐wave gratings presented on a mean luminance background. Stimuli were presented in the lower left visual field and subtended 4° both horizontally and vertically, with the upper right corner of the stimulus located 0.5° horizontally and vertically from a small red fixation cross [Muthukumaraswamy et al., 2009]. Participants were instructed to fixate and to press a response key with the right index finger at the termination of each stimulation period (varying in duration 1.5–2 s). To ensure that that participant attended to each trial, the response was required to occur within 700 ms for the next stimulus to occur. Failure to do so resulted in a prompt that the response was “too slow.” All stimulus presentations were controlled by Presentation software (Neurobehavioral Systems). At CUBRIC stimuli were directly viewed on a Mitsubishi Diamond Pro 2070 monitor, with a screen size of 1,024 by 768 pixels and a frame‐rate of 100 Hz. The monitor was outside the magnetically shielded room and viewed directly from within, at 2.15 m, through a cut‐away portal in the shield. At CHOP stimuli were presented through a back projection system via a Sanyo Protrax multiverse projector with a screen size of 1,024 by 768 pixels and a frame rate of 60 Hz. A screen mounted phototransistor was used to synchronize MEG acquisition with actual time of delivery of visual stimuli, avoiding latency jitter due to refresh rate.
A pilot study was also conducted to assess the effect of background room luminance on our γ‐band measures. This test showed no significant differences were observed when running the visual contrast gratings experiment in low and bright levels of room luminance. Nevertheless, any potential differences in background room luminance between MEG laboratories were minimized by first ensuring that all stimuli were presented in a dimly lit MSR (confirmed with photographs). The results of the luminance pilot experiment can be found in Supporting Information.
MRI Methods
CUBRIC MRI data were acquired on a 3‐T General Electric HDx scanner using an eight‐channel receive only head RF coil (Medical Devices). A 3D Fast Spoiled Gradient Recalled (FSPGR) scan was obtained in an oblique‐axial orientation, with maximum field of view = 256 × 256 × 192 and matrix = 256 × 256 × 192 to yield 1 mm isotropic voxel resolution. (TR/TE = 7.9/3.0 ms; inversion time = 450 ms; flip angle = 20°).
CHOP MRI data were acquired on a 3‐T Siemens Verio (TM) scanner using a 32‐channel receive only head RF coil. For each participant we obtained a 3D Magnetization‐Prepared Rapid Acquisition Gradient‐Echo (MP‐RAGE) scan in an axial orientation, with field of view = 256 × 256 × 192 and matrix = 256 × 256 × 192 to yield 1 mm isotropic voxel resolution (TR/TE = 1,900/2.87 ms; inversion time = 1,100 ms; flip angle = 9°).
Cortical reconstruction and volumetric segmentation was performed with the Freesurfer image analysis suite, which is documented and freely available (http://surfer.nmr.mgh.harvard.edu/). The technical details of these procedures are described in prior publications [Dale et al., 1999; Dale and Sereno, 1993; Fischl and Dale, 2000; Fischl et al., 1999, 2004; Han et al., 2006; Segonne et al., 2004]. Briefly, this processing includes removal of nonbrain tissue using a hybrid watershed/surface deformation procedure [Segonne et al., 2004], automated Talairach transformation, segmentation of the subcortical white matter, and deep gray matter volumetric structures (including hippocampus, amygdala, caudate, putamen, ventricles) [Fischl et al., 2002, 2004] intensity normalization [Sled et al., 1998], tessellation of the gray matter white matter boundary, automated topology correction [Fischl et al., 2001; Segonne et al., 2007], and surface deformation following intensity gradients to optimally place the gray/white and gray/cerebrospinal fluid borders at the location where the greatest shift in intensity defines the transition to the other tissue class [Dale et al., 1999; Dale and Sereno, 1993; Fischl and Dale, 2000]. Once the cortical model is created, the cerebral cortex is parcellated into units based on gyral and sulcal structure based on an existing atlas [Desikan et al., 2006]. The method uses both intensity and continuity information from the entire three‐dimensional MR volume in segmentation and deformation procedures to produce representations of cortical thickness, calculated as the closest distance from the gray/white boundary to the gray/CSF boundary at each vertex on the tessellated surface [Fischl and Dale, 2000]. The maps created use spatial intensity gradients across tissue classes and are therefore not simply reliant on absolute signal intensity. The maps produced are not restricted to the voxel resolution of the original data thus are capable of detecting submillimeter differences between groups. Procedures for the measurement of cortical thickness have been validated against histological analysis [Rosas et al., 2002] and manual measurements [Kuperberg et al., 2003; Salat et al., 2004]. Freesurfer morphometric procedures have been demonstrated to show good test–retest reliability across scanner manufacturers and across field strengths [Han et al., 2006].
A large body of converging evidence exists from LFP [Gray and Singer, 1989; Henrie and Shapley, 2005; Logothetis et al., 2001] ECOG [Rols et al., 2001] and MEG studies [Hoogenboom et al., 2006; Muthukumaraswamy and Singh, 2008] that the source of γ‐band activity in response to simple visual stimuli is from V1/V2. To reduce the number of statistical comparisons, we therefore restricted our analysis of structural change to the relevant areas of the occipital lobe in this atlas; lingual, cuneal, and pericalcarine areas. Gray matter cortical reconstructions in these areas were assessed for three volumetric parameters (volume, surface area, and cortical thickness).
SAM Source Localization
MEG sources were localized using the differential SAM beamformer [Robinson and Vrba, 1999]. Visual γ‐band (30–80 Hz) activity was localized using a 0.0 to 1.5 s (Active) and −1.5 to 0.0 s (Control) time windows obtained using covariance matrices band‐pass filtered between 30 and 80 Hz. Peak locations of γ‐band activity were observed consistently in right hemisphere primary visual cortex. Each peak location was used to create source waveforms for time‐frequency analysis. The beamformer weights vector for the peak location was explicitly computed (covariance calculated from −2 to 2 s; 30–80 Hz) and subsequently, the sensor data were projected through these weights to obtain a time varying estimate of the activity at the image peak location.
Time–Frequency Analysis
Time‐frequency analysis assessed both induced and evoked responses from source waveforms using the Hilbert transform between 0 and 100 Hz at 0.5 Hz frequency step intervals, and represented as a percentage change from baseline values (−1.5 to 0 s) for each frequency band. Peak γ‐band frequency and amplitude measures (expressed in units of percent change from baseline) were obtained. Previous analysis and pilot recordings have shown that the γ‐band response from primary visual cortex exhibits both a “transient” component at stimulus onset (0 to ∼ 0.3 s) as well as a “sustained” component that lasts for the duration of the grating stimulus. From the time‐frequency spectrograms, we therefore calculated γ‐band frequency and amplitude measures for the transient and sustained response separately, A time window of 0 to 0.3 s was used to measure γ‐band transient frequency and amplitude, whereas the sustained response was measured using a 0.5 to 1.5 s analysis window. Reported γ‐band frequency and amplitudes values were calculated by integrating ±5 Hz around the peak frequency observed in the average TFR for each peak location and was reported separately for both transient (0 to 0.3 s) and sustained (0.5 to 1.5 s) γ‐band time periods. Analysis of transient γ‐band responses was not performed in previous similar work [Muthukumaraswamy et al., 2010]. An analysis of unbaselined gamma values (in nAm) can be found in Supporting Information.
The Pearson product–moment correlation coefficient was used to assess linear associations between age and gamma band frequency and amplitude, as well as between age and volumetric parameters of the occipital lobe (noted above) extracted using FreeSurfer. Linear regression analyses were performed with SPSS (PASW Statistics v.18; http://www.spss.com).
RESULTS
Source localized γ‐band differential SAM images are shown for four representative participants ranging in age from 8 to 46 years in Figure 1. Consistent with previous reports using similar stimuli, γ‐band responses were observed in individuals to be localized near to the pericalcarine area [Adjamian et al., 2004; Brookes et al., 2005; Hall et al., 2005; Hoogenboom et al., 2006; Muthukumaraswamy and Singh, 2008, Muthukumaraswamy et al., 2010; Swettenham et al., 2009]. The extended area of source power change observed in these visual cortex responses is typical of power leakage from the SAM spatial filter, with the amount of leakage dependant on the SNR ratio, and the threshold applied (see Barnes and Hillebrandt [2003] for more detailed discussion relating to signal leakage in beamformer images).
Figure 1.
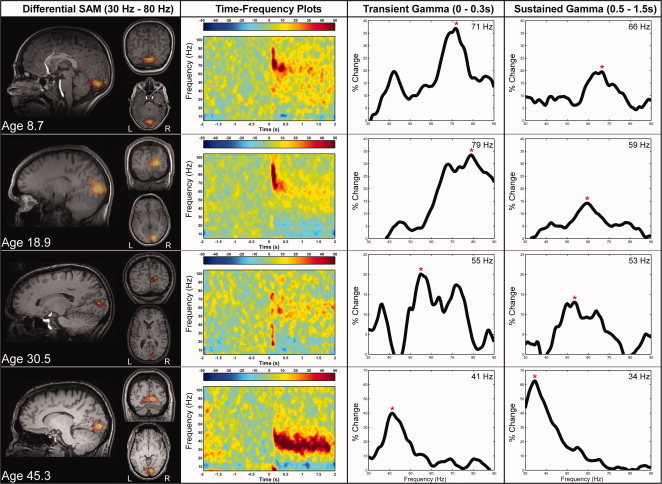
Source localized γ‐band differential SAM images are shown on the left for four representative participants of varying age. The peak location for each source localisation image is indicated by the green dot in each MRI image. Time–frequency plots from peak locations and γ‐band amplitude plots are shown to the right. Intersubject variability in γ‐band amplitude is observed (as reported previously [Muthukumaraswamy et al., 2009]). Peak amplitude γ‐band frequency for both the Transient (0 to 0.3 s) Gamma frequency as well as Sustained (0.5 to 1.5 s) gamma frequency appears to decreases with increasing age. The red * represents the reported peak frequency. [Color figure can be viewed in the online issue, which is available at wileyonlinelibrary.com.]
Given the heterogenous nature of our participant population with respect to age we did not spatially normalize and average response locations. Time–frequency plots from early visual cortex peak locations show the characteristic Transient (0 to 0.3 s) and Sustained responses (0.5 to 1.5 s) to the presented visual stimulus. Given the temporal lag from stimulus onset, we interpret the Sustained response as exhibiting primarily induced rhythmic activity from visual cortex, whereas the Transient response analysis window spans a time period that includes the visual evoked‐response to stimulus onset. Significant correlations were observed between Transient and Sustained gamma band Frequency (R 2 = 0.65; (P < 0.001) y(Transient) = 0.921 × (Sustained) + 10.108), and transient and sustained gamma band amplitude (R 2 = 0.42; (P < 0.001) y(Transient) = 1.067 × (Sustained) + 14.405).
Although each subject shows the transient and sustained γ‐band response, considerable inter‐subject variability in γ‐band amplitude and frequency is observed [as reported previously by Muthukumaraswamy et al., 2009; Swettenham et al., 2009]. In addition, young participants show the highest frequency γ‐band responses, whereas γ‐band power appeared unrelated to the participant's age.
Age Versus Gamma‐band Analysis
Linear regression analysis was performed relating the participant's age to γ‐band measures (Transient Gamma Peak Frequency; Sustained Gamma Peak Frequency). A significant negative correlation was observed for Age vs. Transient Response Peak Frequency (R 2 = 0.37, P < 0.001). Similarly, a significant negative correlation was also observed for Age vs. Sustained Gamma Peak Frequency (R 2 = 0.46, P < 0.001) (See Fig. 2a,b). No significant Age vs. Gamma Amplitude (Transient or Sustained) correlation was observed. When just the CHOP data were analysed, similar transient frequency correlations (R 2 = 0.73, P < 0.001) and sustained frequency correlations (R 2 = 0.58, P < 0.001) were observed.
Figure 2.
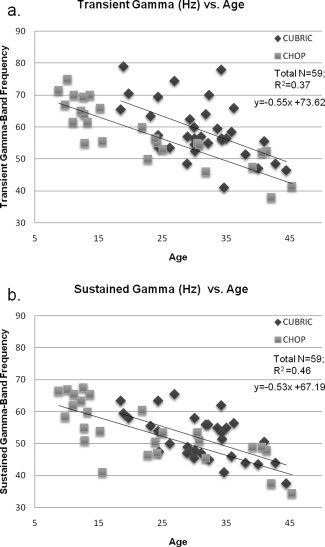
(a) A significant negative correlation was observed between the participant's age and the transient γ‐band peak frequency (R 2 = 0.37, P < 0.001). (b) The significant negative correlation between the participant's Age and sustained γ‐band peak frequency (R 2 = 0.46, P < 0.001). No significant differences were observed between the slopes of these regression lines, thus the correlation and regression equation reported is for all participants (N = 59).
The mean peak frequency for the transient gamma was 58.62 Hz and for the sustained gamma was 52.65 Hz and these were highly correlated (R 2 = 0.66, P < 0.001). The mean change in transient gamma amplitude was 41.01% and 24.93% for sustained and these were also correlated (R 2 = 0.42, P < 0.001). Two sample paired t‐tests of the mean peak frequency between transient and sustained gamma frequency was also significant (two tailed; t(58) = −8.45, P < 0.001).
Age Versus Structural MR Analysis
Linear regression analysis was conducted to assess the relationship between participant's age and MRI‐based gray matter analysis from FreeSurfer. Linear regression analysis of MRI volumetric brain parameters from the Occipital lobe revealed a significant negative correlation for Age versus Pericalcarine Thickness (R 2 = 0.07, P < 0.05). Age versus Cuneus Thickness also showed a significant negative correlation (R 2 = 0.14, P < 0.005) as did Age versus Cuneus Volume (R 2 = 0.08, P < 0.05) (Fig. 3a,b).
Figure 3.
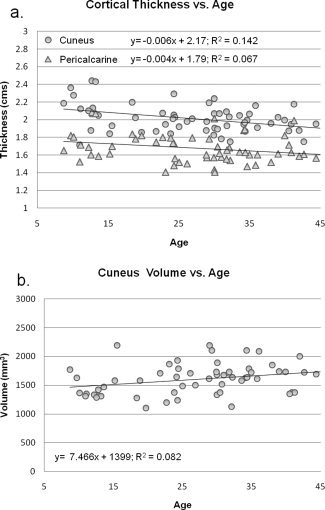
(a, b) A significant negative correlation was observed between participant's age and cuneus thickness (R 2 = 0.14, P < 0.005), and a near‐significant negative correlation was observed between participant's age and pericalcarine thickness (R 2 = 0.07, P = 0.06). 3b shows the significant positive correlation observed between participant's age and cuneus volume (R 2 = 0.08, P < 0.05).
Linear regression analysis was then conducted separately for the three significant occipital regions (Pericalcarine Thickness, Cuneus Thickness, and Cuneus Volume) in relation to transient and sustained γ‐band frequency measures. For Transient Gamma Peak Frequency, only the Cuneus Thickness linear regression approached significance (R 2 = 0.05, P = 0.08). For Sustained Gamma Peak Frequency, a positive linear trend was observed between Pericalcarine Thickness (R 2 = 0.06, P = 0.06). Cuneus Thickness correlated significantly with the Sustained Gamma Peak Frequency (R 2 = 0.12, P < 0.01). Finally, Cuneus Volume was also significantly correlated with Sustained Gamma Peak Frequency (R 2 = 0.13, P < 0.005). See Table I for a summary of all significant correlations observed between measures.
Table 1.
Summary table of correlation results
| Transient gamma (0–0.3 s) | Sustained Gamma (0.5–1.5 s) | |||||
|---|---|---|---|---|---|---|
| Age | Hz | Power | HZ | Power | ||
| Age | R 2= 37 P<0.000 | n.s: | R 2=0 46, P<0.000 | n.s | ||
| Peri‐Calcarine | Thickness (mm) | R 2=0.067; P=0.049 | n.s | n.s. | R 2=0.059; P=0.063 | n.s. |
| Surface Area (mm2) | n.s. | n.s. | n.s | n s. | n.s | |
| Volume (mm3) | n.s | n.s. | n.s. | n.s. | n.s. | |
| Cuneus | Thickness (mm) | R 2=0.142; P=0 003 | R 2=0.054; P=0 078 | n.s | R 2=0 115; P=0 008 | n.s |
| Surface Area (mm2) | n.s | n.s. | n.s.. | n.s. | n.s. | |
| Volume (mm3) | R 2=0.082, P=0.028 | n.s. | n.s. | R 2=0.13, P=0.005 | n.s. | |
Does Change in Cuneus Thickness or Cuneus Volume Explain the Decrease in Sustained Gamma Frequency With Age?
Hierarchical regression analyses was performed to examined the unique influence of Age and Cuneus Thickness on Sustained Gamma Peak Frequency. The full regression model (Age and Cuneus Thickness) predicts 46.3% of the variance in Sustained Gamma Peak Frequency, F(2,56) = 24.16, P < 0.001. Added first, Age predicted 45.5% of the variance (P < 0.001). Including Cuneus Thickness explained a nonsignificant 0.8% of additional variance in the model for Sustained Gamma Peak Frequency and Age. When Cuneus Thickness was added to the model first it accounted for 11.5% of the variance in Sustained Gamma Frequency (P < 0.01), with Age accounting for an additional 34.8% of the variance (P < 0.001).
Hierarchical regression analyses was also performed to examined the unique influence of Age and Cuneus Volume on Sustained Gamma Peak Frequency. The full regression model (Age and Cuneus Volume) predicts 48.5% of the variance in Sustained Gamma Peak Frequency, F(2,56) = 26.40, P < 0.001. Added first, Age predicted 45.5% of the variance (P < 0.001). Including Cuneus Volume explained a nonsignificant 4% of additional variance in the model for Sustained Gamma Peak Frequency and Age. When Cuneus Volume was added first, it accounted for 13% of the variance in Sustained Gamma Frequency (P < 0.001), with Age accounting for an additional 35.5% of the variance.
For both models, Cuneus Thickness and Cuneus Volume do not significantly predict Sustained Gamma Peak Frequency after accounting for Age, thus the observed decrease in Sustained Gamma Peak Frequency with increasing age is not likely the result of decreased cortical thickness or cortical volume in visual areas. Rather Sustained Gamma Peak Frequency, Cuneus Thickness and Cuneus Volume may be related indices of visual cortex maturation.
Interlaboratory Comparisons
We performed post‐hoc analyses to test for any potential inter‐laboratory differences in our sample (CHOP: n = 26, CUBRIC: n = 33) for the variables of sustained gamma power and frequency as well as transient power and frequency. After controlling for age (as younger participants were collected at CHOP) no interlaboratory differences were seen (all P > 0.05).
DISCUSSION
A growing body of evidence suggests that synchronous gamma cortical oscillations are integral to variety of perceptual and cognitive functions [Fries, 2009; Uhlhaas et al., 2009, 2010]. However, less is currently known about how developmental and maturational changes affect gamma oscillations observed over the lifespan. The results from this study show that contrast gratings‐evoked gamma oscillation frequency decreases with age for both the Transient (0–0.3 s) and Sustained responses (0.5–1.5 s) to the presented visual stimulus. Previous research has related this transient period to input coming from the retina, through the LGN to cortex. This transient input from the retina may then initiate a sustained cortico‐cortico gamma synchronization, which is generated and maintained exclusively in cortex [Castelo‐Branco et al., 1998]. The precise and differential roles of these transient and sustained oscillations are not yet known, and the subject of some recent debate. Some have speculated that oscillations in the gamma range serve to maintain neural synchrony, enhancing the transmission and binding of information through visual cortex to higher‐level areas (Fries et al., 2001; Samonds and Bonds, 2005; Singer, 1999]. Whereas the Sustained response window (0.5 1.5 s) likely represents a period dominated by induced cortical responses, the Transient response window (0–0.3 s) might capture both evoked and emitted components. However, both Transient and Sustained frequency and amplitudes were highly correlated indicating a tight functional relation. Thus, future studies might assess the degree to which these responses dissociate under varied stimulus conditions.
Cortical thickness and volume measures from occipital lobe, cuneus, and pericalcarine cortex thickness was also observed to change with age. Although a significant correlation was observed between Cuneus Thickness and Gamma Sustained Peak Frequency and Cuneus Volume and Gamma Sustained Peak Frequency, results from hierarchical regression analysis showed participant's age explained the vast majority of the decrease in Gamma Sustained Frequency regression model with age. Previous analyses of some of these data [Muthukumaraswamy et al., 2010] showed only a correlation between pericalcarine cortex and gamma frequency (P < 0.05) and while this is still marginally significant (P = 0.06) the inclusion of a younger participant pool has shown that neighboring cuneus thickness and volume are also correlated with gamma frequencies. We thus interpret the differences between this study and the Muthukumaraswamy et al. [2010] as related to the limited sampling of the age range in the adult study, which hampered uncovering age as a significant covariate in the relation between cuneus cortical thickness and GFP. In addition, we note that the neighboring cuneal and pericalcarine thicknesses are quite strongly correlated (r = 0.530, P < 1.60 × 10⁻⁵). This suggests that both Gamma Frequency and Cuneus Thickness and Volume measures are sensitive to separate but related properties of age‐dependant maturational change in visual cortex. These results are important as they show both functional and structural correlates of maturation are regionally specific and may serve as an important metric of neural aging and age‐associated neurological disease. Moreover, these changes may serve as indirect metrics of histological or pathological processes and may be informative for understanding physiological processes of neural development, maturation, and age‐related decline.
The current results raise two interesting questions: (1) what are the known anatomical, neurochemical, and physiological changes that would produce a decrease in γ‐band frequency from primary visual cortex with increasing age? (2) What are the perceptual and behavioral correlates which can be associated with these structural and functional changes to the occipital lobe observed time?
How Does the Brain Change Structurally With Age?
Maximal brain weight occurs at approximately 20 years of age, and declines at approximately 55 years of age [Dekaban, 1978]. Conversely, white matter volume increases until approximately the mid‐40s [Bartzokis et al., 2001; Sowell et al., 2003], which coincides with the peak myelination observed at approximately age 50 [Benes et al., 1994]. Although the gross morphological structure (i.e., size) of the brain changes relatively little between childhood and mid‐adulthood, dramatic changes to neural density and connectivity are known to be taking place over this time. These morphological changes are largely dominated by two main neurodevelopmental processes: synaptic pruning and myelination. In‐vivo volumetric studies show consistent and relatively linear decreases in gray matter density (an indirect MRI measure related to synaptic pruning) from a variety of cortical regions beginning in late childhood [Giedd et al., 1999; Sowell et al., 2002] and continuing relatively linearly through old age [Bartzokis et al., 2003; Courchesne et al., 2000; Ge et al., 2002]. During adolescence, frontal and parietal lobes show highly significant increases in white matter along with concomitant decreases in gray matter [Giedd et al., 1999; Sowell et al., 2002]. Gray matter density reduction over the childhood to adult range appears to show acceleration in the post‐adolescent age range, mostly in the dorsal frontal cortices [Sowell et al., 2001, 2003). These results suggest that changes in gray matter density between childhood and young adulthood may index maturation dependent increases in computational demands as frontal lobe executive functions develop in adolescence, and thus are not changing at the same rates over lifespan. Of note, the clear decrease in gray matter density from dorsal frontal areas over the 10–40 years range appears to remain relatively constant in density after ∼50 years [Sowell et al., 2003]. In addition to synaptic density, age‐dependent neurochemical processes are also known to change with development and maturation [Jansen et al., 2010].
Neurochemistry Underlying Brain Development and Maturation
Gamma‐band responses and long‐range synchronization in neocortex are thought to be governed principally by GABAergic interneurons [Frankle et al., 2009; Uhlhaas et al., 2009, 2010]. These neocortical interneurons use the inhibitory neurotransmitter γ (gamma)‐aminobutyric acid (GABA) to dampen cortical activity by increasing chloride (Cl−) conductance producing membrane hyperpolarization and decreased excitability. In children and adults, GABA mediates the majority of fast inhibitory neurotransmission in the central nervous system through its activation of the GABAA receptor. However, both the subunit composition neuronal GABAA receptors and functional role changes during prenatal and postnatal development in humans [Andersen et al., 2002; Brooks‐Kayal and Pritchett, 1993; Kanaumi et al., 2006; Reichelt et al., 1991]. Because of elevated intracellular Cl− concentrations in immature neurons, GABA signaling in neonatal brain acts as an excitatory neurotransmitter—which switches to an inhibitory neurotransmitter after about the first 2 years of life [Jansen et al., 2010]. In addition, GABAA receptor α1 and γ2 subunit expression are known to increase over the first 5−6 years of life before reaching a plateau, whereas α4 subunit expression decreases during this same time period [Jansen et al., 2010]. It is currently not clear how changes in receptor density correlate with gross non‐invasive GABA measures such as non‐invasive magnetic resonance spectroscopy (MRS). However, widespread decreases in MRS GABA concentration with age have been reported to correlate negatively with normal aging, in areas such as dorsolateral prefrontal cortex (DLPFC), orbito frontal cortex (OFC), and sensorimotor cortex (SMC) [Grachev and Apkarian, 2001], as well as visual cortex [Bigal et al., 2008]. More recently, a positive correlation was observed between MRS resting endogenous GABA concentration in medial occipital cortex and gratings‐induced gamma frequency [Muthukumaraswamy et al., 2009]. Similar recent findings have also been observed between MRS resting endogenous GABA concentration and movement‐related gamma synchrony in motor cortex [Gaetz et al., 2011]. Thus, the age‐related decreases in gamma frequency observed in this study may index age‐related decreases in MRS GABA concentration, or both γ‐band frequency and GABA concentration may be sensitive to some additional and related processes of brain maturation.
Perceptual and Behavioral Correlates of Visual Cortex Maturation
If, as we speculate earlier, age‐related changes in γ‐band frequency are related to changes in the cortical excitation/inhibition balance then we might well predict age‐related changes in gamma frequency to be correlated with performance on tasks that are thought to be dependent on GABAergic inhibition. The most compelling case for this is orientation discrimination, where animal neurophysiology has shown that intracortical inhibition sharpens neuronal orientation selectivity [Shapley et al., 2003]. When GABA is blocked by antagonists, neural orientation tuning is broadened or even abolished [Sillito, 1975] while the addition of GABA to aged cells restores their orientation tuning [Leventhal et al., 2003]. Using MEG and MRS in humans we recently demonstrated that orientation discrimination performance was predicted by both occipital GABA concentration and γ‐band frequency within the same area—suggesting that variability of GABAergic inhibition can indeed lead to variability in human performance [Edden et al., 2009]. On other tasks, it has been shown that older subjects are actually better than younger subjects at discriminating brief, large‐field, motion stimuli [Tadin et al., 2003]—a counterintuitive finding that has been linked to reduced GABAergic inhibition in the older cohort, leading to reduced centre‐surround suppression. To date, an explicit link between age‐related performance changes and age‐related changes in GABA has not been made experimentally. Furthermore, to our knowledge, performance changes on these tasks through the early years of development, when the GABA system is maturing, have not been investigated.
CONCLUSION
To our knowledge, this study is the first published multicenter MEG study. With this work, we have used nearly identical methods between two research centers, and replicated previously published research findings [Muthukumaraswamy et al., 2010] using an independent sample of adults (CHOP vs. CUBRIC). Moreover, we have extended this observation to healthy population of adolescents and children. This collaborative approach to the study of developmental neuroscience represents a more efficient and statistically powerful path to scientific discovery, particularly when relatively large samples of participants are needed.
Our work has several important implications for basic and developmental neuroscience. Studies aimed at addressing the functional significance of cortical oscillations should control for maturational processes that may directly affect the frequency of the observed cortical oscillations. Future work designed to relate perceptual and behavioral consequences of this decrease in γ‐band frequency may be important for explaining how γ‐band oscillations contribute to V1 function. In addition, it is clear that age‐related changes in cortical thickness affect some cortical areas more than others, yet the reason for this, and the perceptual and behavioral consequence of this change remain unclear. Overall, these morphological and functional changes with maturation appear to be regionally specific, and may thus be informative for understanding physiological processes of neural development, maturation, and age‐related decline.
Supporting information
Additional Supporting Information may be found in the online version of this article.
Supporting Information
Supporting Information
Acknowledgements
The Cardiff University Brain Research Imaging Centre was established with support from the UK Department of Trade and Industry, Cardiff University, and the Welsh Assembly government. The content is solely the responsibility of the authors and does not necessarily represent the official views of the National Institutes of Health. The Pennsylvania Department of Health specifically disclaims responsibility for any analyses, interpretations or conclusions. Dr. Roberts gratefully acknowledges the Oberkircher Family for the Oberkircher Family Chair in Pediatric Radiology at Children's Hospital of Philadelphia. We also thank Dr. James C. Edgar and Dr. Donald Mabbott for helpful discussions and assistance with statistical analysis.
REFERENCES
- Adjamian P, Holliday IE, Barnes GR, Hillebrand A, Hadjipapas A, Singh KD ( 2004): Induced visual illusions and gamma oscillations in human primary visual cortex. Eur J Neurosci 20: 587–92. [DOI] [PubMed] [Google Scholar]
- Andersen DL, Eckert AL, Tsai VW, Burke CJ, Tannenberg AE, Dodd PR ( 2002): GABA(A) receptor sites in the developing human foetus. Brain Res Dev Brain Res 139: 107–19. [DOI] [PubMed] [Google Scholar]
- Barnes GR, Hillebrand A. 2003. Statistical flattening of MEG beamformer images. Human Brain Mapping 18(1):1–12. [DOI] [PMC free article] [PubMed] [Google Scholar]
- Bartzokis G, Beckson M, Lu PH, Nuechterlein KH, Edwards N, Mintz J ( 2001): Age‐related changes in frontal and temporal lobe volumes in men: a magnetic resonance imaging study. Arch Gen Psychiatry 58: 461–5. [DOI] [PubMed] [Google Scholar]
- Bartzokis G, Cummings JL, Sultzer D, Henderson VW, Nuechterlein KH, Mintz J ( 2003): White matter structural integrity in healthy aging adults and patients with Alzheimer disease: A magnetic resonance imaging study. Arch Neurol 60: 393–8. [DOI] [PubMed] [Google Scholar]
- Bauer M, Oostenveld R, Peeters M, Fries P ( 2006): Tactile spatial attention enhances gamma‐band activity in somatosensory cortex and reduces low‐frequency activity in parieto‐occipital areas. J Neurosci 26: 490–501. [DOI] [PMC free article] [PubMed] [Google Scholar]
- Benes FM, Turtle M, Khan Y, Farol P ( 1994): Myelination of a key relay zone in the hippocampal formation occurs in the human brain during childhood, adolescence, and adulthood. Arch Gen Psychiatry 51: 477–84. [DOI] [PubMed] [Google Scholar]
- Brooks‐Kayal AR, Pritchett DB ( 1993): Developmental changes in human gamma‐aminobutyric acidA receptor subunit composition. Ann Neurol 34: 687–93. [DOI] [PubMed] [Google Scholar]
- Castelo‐Branco M, Neuenschwander S, Singer W ( 1998): Synchronization of visual responses between the cortex, lateral geniculate nucleus, and retina in the anesthetized cat. J Neurosci 18: 6395–410. [DOI] [PMC free article] [PubMed] [Google Scholar]
- Cheyne D, Bells S, Ferrari P, Gaetz W, Bostan AC ( 2008): Self‐paced movements induce high‐frequency gamma oscillations in primary motor cortex. Neuroimage 42: 332–42. [DOI] [PubMed] [Google Scholar]
- Courchesne E, Chisum HJ, Townsend J, Cowles A, Covington J, Egaas B, Harwood M, Hinds S, Press GA ( 2000): Normal brain development and aging: quantitative analysis at in vivo MR imaging in healthy volunteers. Radiology 216: 672–82. [DOI] [PubMed] [Google Scholar]
- Dale AM, Sereno MI ( 1993): Improved localization of cortical activity by combining EEG and MEG with MRI cortical surface reconstruction—A linear approach. J Cogn Neurosci 5: 162–176. [DOI] [PubMed] [Google Scholar]
- Dale AM, Fischl B, Sereno MI ( 1999): Cortical surface‐based analysis. I. Segmentation and surface reconstruction. Neuroimage 9: 179–94. [DOI] [PubMed] [Google Scholar]
- Dekaban AS ( 1978): Changes in brain weights during the span of human life: Relation of brain weights to body heights and body weights. Ann Neurol 4: 345–56. [DOI] [PubMed] [Google Scholar]
- Desikan RS, Segonne F, Fischl B, Quinn BT, Dickerson BC, Blacker D, Buckner RL, Dale AM, Maguire RP, Hyman BT and others ( 2006): An automated labeling system for subdividing the human cerebral cortex on MRI scans into gyral based regions of interest. Neuroimage 31: 968–980. [DOI] [PubMed] [Google Scholar]
- Edden RA, Muthukumaraswamy SD, Freeman TC, Singh KD ( 2009): Orientation discrimination performance is predicted by GABA concentration and gamma oscillation frequency in human primary visual cortex. J Neurosci 29: 15721–6. [DOI] [PMC free article] [PubMed] [Google Scholar]
- Fell J, Fernandez G, Klaver P, Elger CE, Fries P ( 2003): Is synchronized neuronal gamma activity relevant for selective attention? Brain Res Brain Res Rev 42: 265–72. [DOI] [PubMed] [Google Scholar]
- Fischl B, Dale AM ( 2000): Measuring the thickness of the human cerebral cortex from magnetic resonance images. Proc Natl Acad Sci USA 97: 11050–11055. [DOI] [PMC free article] [PubMed] [Google Scholar]
- Fischl B, Sereno MI, Dale AM ( 1999): Cortical surface‐based analysis. II. Inflation, flattening, and a surface‐based coordinate system. Neuroimage 9: 195–207. [DOI] [PubMed] [Google Scholar]
- Fischl B, Liu A, Dale AM ( 2001): Automated manifold surgery: Constructing geometrically accurate and topologically correct models of the human cerebral cortex. IEEE Trans Med Imaging 20: 70–80. [DOI] [PubMed] [Google Scholar]
- Fischl B, Salat DH, Busa E, Albert M, Dieterich M, Haselgrove C, van der Kouwe A, Killiany R, Kennedy D, Klaveness S, Montillo A, Makris N, Rosen B, Dale AM ( 2002): Whole brain segmentation: Automated labeling of neuroanatomical structures in the human brain. Neuron. 2002 Jan 31; 33: 341–55. [DOI] [PubMed] [Google Scholar]
- Fischl B, Salat DH, van der Kouwe AJ, Makris N, Segonne F, Quinn BT, Dale AM ( 2004): Sequence‐independent segmentation of magnetic resonance images. Neuroimage 23 ( Suppl 1): S69–S84. [DOI] [PubMed] [Google Scholar]
- Frankle WG, Cho RY, Narendran R, Mason NS, Vora S, Litschge M, Price JC, Lewis DA, Mathis CA ( 2009): Tiagabine increases [11C]flumazenil binding in cortical brain regions in healthy control subjects. Neuropsychopharmacology 34: 624–633. [DOI] [PMC free article] [PubMed] [Google Scholar]
- Fries P ( 2009): Neuronal gamma‐band synchronization as a fundamental process in cortical computation. Annu Rev Neurosci 32: 209–224. [DOI] [PubMed] [Google Scholar]
- Fries P, Scheeringa R, Oostenveld R ( 2008): Finding gamma Neuron 58: 303–305. [DOI] [PubMed] [Google Scholar]
- Fries P, Reynolds JH, Rorie AE, Desimone R ( 2001): Modulation of oscillatory neuronal synchronization by selective visual attention. Science 291: 1560–1563. [DOI] [PubMed] [Google Scholar]
- Gaetz WC, Cheyne DO ( 2003): Localization of human somatosensory cortex using spatially filtered magnetoencephalography. Neurosci Lett 340: 161–164. [DOI] [PubMed] [Google Scholar]
- Gaetz W, Macdonald M, Cheyne D, Snead OC ( 2010): Neuromagnetic imaging of movement‐related cortical oscillations in children and adults: Age predicts post‐movement beta rebound. Neuroimage 51: 792–807. [DOI] [PubMed] [Google Scholar]
- Gaetz W, Edgar JC, Wang DJ, Roberts TP ( 2011): Relating MEG measured motor cortical oscillations to resting γ‐Aminobutyric acid (GABA) concentration. Neuroimage 55: 616–621. [DOI] [PMC free article] [PubMed] [Google Scholar]
- Ge Y, Grossman RI, Babb JS, Rabin ML, Mannon LJ, Kolson DL ( 2002): Age‐related total gray matter and white matter changes in normal adult brain. I. Volumetric MR imaging analysis. Am J Neuroradiol 23: 1327–1333. [PMC free article] [PubMed] [Google Scholar]
- Giedd JN, Blumenthal J, Jeffries NO, Castellanos FX, Liu H, Zijdenbos A, Paus T, Evans AC, Rapoport JL ( 1999): Brain development during childhood and adolescence: A longitudinal MRI study. Nat Neurosci 2: 861–863. [DOI] [PubMed] [Google Scholar]
- Grachev ID, Apkarian AV ( 2001): Aging alters regional multichemical profile of the human brain: An in vivo 1H‐MRS study of young versus middle‐aged subjects. J Neurochem 76: 582–593. [DOI] [PubMed] [Google Scholar]
- Gray CM, Singer W ( 1989): Stimulus‐specific neuronal oscillations in orientation columns of cat visual cortex. Proc Natl Acad Sci USA 86: 1698–1702. [DOI] [PMC free article] [PubMed] [Google Scholar]
- Gregoriou GG, Gotts SJ, Zhou H, Desimone R ( 2009): High‐frequency, long‐range coupling between prefrontal and visual cortex during attention. Science 324: 1207–1210. [DOI] [PMC free article] [PubMed] [Google Scholar]
- Gruber T, Keil A, Muller MM ( 2001): Modulation of induced gamma band responses and phase synchrony in a paired associate learning task in the human EEG. Neurosci Lett 316: 29–32. [DOI] [PubMed] [Google Scholar]
- Gurtubay IG, Alegre M, Labarga A, Malanda A, Artieda J ( 2004): Gamma band responses to target and non‐target auditory stimuli in humans. Neurosci Lett 367: 6–9. [DOI] [PubMed] [Google Scholar]
- Han X, Jovicich J, Salat D, van der Kouwe A, Quinn B, Czanner S, Busa E, Pacheco J, Albert M, Killiany R, et al. ( 2006): Reliability of MRI‐derived measurements of human cerebral cortical thickness: The effects of field strength, scanner upgrade and manufacturer. Neuroimage 32: 180–194. [DOI] [PubMed] [Google Scholar]
- Henrie JA, Shapley R ( 2005): LFP power spectra in V1 cortex: The graded effect of stimulus contrast. J Neurophysiol 94: 479–490. [DOI] [PubMed] [Google Scholar]
- Hoogenboom N, Schoffelen JM, Oostenveld R, Parkes LM, Fries P ( 2006): Localizing human visual gamma‐band activity in frequency, time and space. Neuroimage 29: 764–773. [DOI] [PubMed] [Google Scholar]
- Jansen LA, Peugh LD, Roden WH, Ojemann JG (2010): Impaired maturation of cortical GABA receptor expression in pediatric epilepsy. Epilepsia 51(8): 1456–67. [DOI] [PMC free article] [PubMed] [Google Scholar]
- Kanaumi T, Takashima S, Iwasaki H, Mitsudome A, Hirose S ( 2006): Developmental changes in the expression of GABAA receptor alpha 1 and gamma 2 subunits in human temporal lobe, hippocampus and basal ganglia: An implication for consideration on age‐related epilepsy. Epilepsy Res 71: 47–53. [DOI] [PubMed] [Google Scholar]
- Keil A, Muller MM, Ray WJ, Gruber T, Elbert T ( 1999): Human gamma band activity and perception of a gestalt. J Neurosci 19: 7152–7161. [DOI] [PMC free article] [PubMed] [Google Scholar]
- Kuperberg GR, Broome MR, McGuire PK, David AS, Eddy M, Ozawa F, Goff D, West WC, Williams SCR, van der Kouwe AJW, et al. ( 2003): Regionally localized thinning of the cerebral cortex in schizophrenia. Arch Gen Psychiatry 60: 878–888. [DOI] [PubMed] [Google Scholar]
- Leventhal AG, Wang Y, Pu M, Zhou Y, Ma Y ( 2003): GABA and its agonists improved visual cortical function in senescent monkeys. Science 300: 812–815. [DOI] [PubMed] [Google Scholar]
- Lewis DA, Hashimoto T, Volk DW ( 2005): Cortical inhibitory neurons and schizophrenia. Nat Rev Neurosci 6: 312–324. [DOI] [PubMed] [Google Scholar]
- Logothetis NK, Pauls J, Augath M, Trinath T, Oeltermann A ( 2001): Neurophysiological investigation of the basis of the fMRI signal. Nature 412: 150–157. [DOI] [PubMed] [Google Scholar]
- Lutzenberger W, Ripper B, Busse L, Birbaumer N, Kaiser J ( 2002): Dynamics of gamma‐band activity during an audiospatial working memory task in humans. J Neurosci 22: 5630–5638. [DOI] [PMC free article] [PubMed] [Google Scholar]
- Miltner WH, Braun C, Arnold M, Witte H, Taub E ( 1999): Coherence of gamma‐band EEG activity as a basis for associative learning. Nature 397: 434–436. [DOI] [PubMed] [Google Scholar]
- Muller MM, Gruber T, Keil A ( 2000): Modulation of induced gamma band activity in the human EEG by attention and visual information processing. Int J Psychophysiol 38: 283–299. [DOI] [PubMed] [Google Scholar]
- Muthukumaraswamy SD, Singh KD ( 2008): Spatiotemporal frequency tuning of BOLD and gamma band MEG responses compared in primary visual cortex. Neuroimage 40: 1552–1560. [DOI] [PubMed] [Google Scholar]
- Muthukumaraswamy SD, Edden RA, Jones DK, Swettenham JB, Singh KD ( 2009): Resting GABA concentration predicts peak gamma frequency and fMRI amplitude in response to visual stimulation in humans. Proc Natl Acad Sci USA 106: 8356–8361. [DOI] [PMC free article] [PubMed] [Google Scholar]
- Muthukumaraswamy SD, Singh KD, Swettenham JB, Jones DK ( 2010): Visual gamma oscillations and evoked responses: Variability, repeatability and structural MRI correlates. Neuroimage 49: 3349–3357. [DOI] [PubMed] [Google Scholar]
- Raz N, Ghisletta P, Rodrigue KM, Kennedy KM, Lindenberger U ( 2010): Trajectories of brain aging in middle‐aged and older adults: regional and individual differences. Neuroimage 51: 501–511. [DOI] [PMC free article] [PubMed] [Google Scholar]
- Reichelt R, Hofmann D, Fodisch HJ, Mohler H, Knapp M, Hebebrand J ( 1991): Ontogeny of the benzodiazepine receptor in human brain: fluorographic, immunochemical, and reversible binding studies. J Neurochem 57: 1128–1135. [DOI] [PubMed] [Google Scholar]
- Rols G, Tallon‐Baudry C, Girard P, Bertrand O, Bullier J ( 2001): Cortical mapping of gamma oscillations in areas V1 and V4 of the macaque monkey. Vis Neurosci 18: 527–540. [DOI] [PubMed] [Google Scholar]
- Rosas HD, Liu AK, Hersch S, Glessner M, Ferrante RJ, Salat DH, van der Kouwe A, Jenkins BG, Dale AM, Fischl B ( 2002): Regional and progressive thinning of the cortical ribbon in Huntington's disease. Neurology 58: 695–701. [DOI] [PubMed] [Google Scholar]
- Salat DH, Lee SY, van der Kouwe AJ, Greve DN, Fischl B, Rosas HD ( 2009): Age‐associated alterations in cortical gray and white matter signal intensity and gray to white matter contrast. Neuroimage 48: 21–28. [DOI] [PMC free article] [PubMed] [Google Scholar]
- Samonds JM, Bonds AB ( 2005): Gamma oscillation maintains stimulus structure‐dependent synchronization in cat visual cortex. J Neurophysiol 93: 223–236. [DOI] [PubMed] [Google Scholar]
- Segonne F, Pacheco J, Fischl B ( 2007): Geometrically accurate topology‐correction of cortical surfaces using nonseparating loops. IEEE Trans Med Imaging 26: 518–529. [DOI] [PubMed] [Google Scholar]
- Segonne F, Dale AM, Busa E, Glessner M, Salat D, Hahn HK, Fischl B ( 2004): A hybrid approach to the skull stripping problem in MRI. Neuroimage 22: 1060–1075. [DOI] [PubMed] [Google Scholar]
- Sillito AM ( 1975): The effectiveness of bicuculline as an antagonist of GABA and visually evoked inhibition in the cat's striate cortex. AM. J Physiol 250: 287–304. [DOI] [PMC free article] [PubMed] [Google Scholar]
- Singer W ( 1999): Neuronal synchrony: A versatile code for the definition of relations? Neuron 24: 49–65, 111–125. [DOI] [PubMed] [Google Scholar]
- Sled JG, Zijdenbos AP, Evans AC ( 1998): A nonparametric method for automatic correction of intensity nonuniformity in MRI data. IEEE Trans Med Imaging 17: 87–97. [DOI] [PubMed] [Google Scholar]
- Sowell ER, Thompson PM, Tessner KD, Toga AW ( 2001): Mapping continued brain growth and gray matter density reduction in dorsal frontal cortex: Inverse relationships during postadolescent brain maturation. J Neurosci 21: 8819–8829. [DOI] [PMC free article] [PubMed] [Google Scholar]
- Sowell ER, Trauner DA, Gamst A, Jernigan TL ( 2002): Development of cortical and subcortical brain structures in childhood and adolescence: A structural MRI study. Dev Med Child Neurol 44: 4–16. [DOI] [PubMed] [Google Scholar]
- Sowell ER, Peterson BS, Thompson PM, Welcome SE, Henkenius AL, Toga AW ( 2003): Mapping cortical change across the human life span. Nat Neurosci 6: 309–315. [DOI] [PubMed] [Google Scholar]
- Spencer KM, Nestor PG, Niznikiewicz MA, Salisbury DF, Shenton ME, McCarley RW ( 2003): Abnormal neural synchrony in schizophrenia. J Neurosci 23: 7407–7411. [DOI] [PMC free article] [PubMed] [Google Scholar]
- Steinschneider M, Fishman YI, Arezzo JC ( 2008): Spectrotemporal analysis of evoked and induced electroencephalographic responses in primary auditory cortex (A1) of the awake monkey. Cereb Cortex 18: 610–625. [DOI] [PubMed] [Google Scholar]
- Swettenham JB, Muthukumaraswamy SD, Singh KD. 2009. Spectral Properties of Induced and Evoked Gamma Oscillations in Human Early Visual Cortex to Moving and Stationary Stimuli. Journal of Neurophysiology 102:1241‐1253. [DOI] [PubMed] [Google Scholar]
- Tadin D, Lappin JS, Gilroy LA, Blake R ( 2003): Perceptual consequences of centre‐surround antagonism in visual motion processing. Nature 424: 312–315. [DOI] [PubMed] [Google Scholar]
- Tallon‐Baudry C, Bertrand O, Delpuech C, Pernier J ( 1996): Stimulus specificity of phase‐locked and non‐phase‐locked 40 Hz visual responses in human. J Neurosci 16: 4240–4249. [DOI] [PMC free article] [PubMed] [Google Scholar]
- Tallon‐Baudry C, Bertrand O, Delpuech C, Permier J ( 1997): Oscillatory gamma‐band (30–70 Hz) activity induced by a visual search task in humans. J Neurosci 17: 722–734. [DOI] [PMC free article] [PubMed] [Google Scholar]
- Tallon‐Baudry C, Bertrand O, Peronnet F, Pernier J ( 1998): Induced gamma‐band activity during the delay of a visual short‐term memory task in humans. J Neurosci 18: 4244–4254. [DOI] [PMC free article] [PubMed] [Google Scholar]
- Uhlhaas PJ, Mishara AL ( 2007): Perceptual anomalies in schizophrenia: Integrating phenomenology and cognitive neuroscience. Schizophr Bull 33: 142–156. [DOI] [PMC free article] [PubMed] [Google Scholar]
- Uhlhaas PJ, Pipa G, Lima B, Melloni L, Neuenschwander S, Nikolic D, Singer W ( 2009): Neural synchrony in cortical networks: History, concept and current status. Front Integr Neurosci 3: 17. [DOI] [PMC free article] [PubMed] [Google Scholar]
- Uhlhaas PJ, Roux F, Rodriguez E, Rotarska‐Jagiela A, Singer W ( 2010): Neural synchrony and the development of cortical networks. Trends Cogn Sci 14: 72–80. [DOI] [PubMed] [Google Scholar]
- Vinck M, Lima B, Womelsdorf T, Oostenveld R, Singer W, Neuenschwander S, Fries P. ( 2010) Gamma‐phase shifting in awake monkey visual cortex. J Neurosci 30: 1250–1257. [DOI] [PMC free article] [PubMed] [Google Scholar]
Associated Data
This section collects any data citations, data availability statements, or supplementary materials included in this article.
Supplementary Materials
Additional Supporting Information may be found in the online version of this article.
Supporting Information
Supporting Information