

Abstract
Objective
We have reported that implementation of an electronic health record (EHR) based quality improvement system that included point-of-care electronic reminders accelerated improvement in performance for multiple measures of chronic disease care and preventive care during a 1-year period. This study examined whether providing pre-visit paper quality reminders could further improve performance, especially for physicians whose performance had not improved much during the first year.
Design
Time-series analysis at a large internal medicine practice using a commercial EHR. All patients eligible for each measure were included (range approximately 100–7500).
Measurements
The proportion of eligible patients in the practice who satisfied each of 15 quality measures after removing those with exceptions from the denominator. To analyze changes in performance for individual physicians, two composite measures were used: prescribing seven essential medications and completion of five preventive services.
Results
During the year after implementing pre-encounter reminders, performance continued to improve for eight measures, remained stable for four, and declined for three. Physicians with the worst performance at the start of the pre-encounter reminders showed little absolute improvement over the next year, and most remained below the median performance for physicians in the practice.
Conclusions
Paper pre-encounter reminders did not appear to improve performance beyond electronic point-of-care reminders in the EHR alone. Lagging performance is likely not due to providers' EHR workflow alone, and trying to step backwards and use paper reminders in addition to point-of-care reminders in the EHR may not be an effective strategy for engaging slow adopters.
Keywords: Quality improvement, computerized clinical decision support, performance measurement, audit and feedback, chronic disease management, patient engagement, personal health record, health literacy, medical Informatics, Infection Control, Phenotyping, quality
Electronic health records (EHR) have the potential to transform quality measurement and quality improvement methods, which are fundamental activities for achieving ‘meaningful use’ of EHR.1–4 This potential was clearly shown in the first phase of the UPQUAL study (Utilizing Precision Performance Measurement for Focused Quality Improvement). UPQUAL utilized a multifaceted EHR-based intervention designed to improve quality measurement (including capture of contraindications and patient refusals), make point-of-care reminders more accurate, and provide more valid and responsive clinician feedback (including lists of patients not receiving essential medications). During the first year of the UPQUAL study, performance improved significantly for 14 of 16 measures.5 For nine measures, performance improved more rapidly during the intervention year than during the previous year when only audit and feedback of performance was carried out. For five medication prescribing measures, over half of physicians achieved 100% performance (ie, the medication was prescribed or a medical or patient reason was documented).
Despite this success, quality gaps remained, especially for a subset of physicians whose performance had not improved as much as others. Some of these physicians said they wrote notes on paper when they saw patients and did not open patients' EHR records until the end of the visit. Thus, their workflow reduced the benefit of the electronic point-of-care reminders.
We conducted this study to examine whether we could augment the effectiveness of our electronic reminders by implementing a system that queried the EHR to identify quality deficits and printed a list of the outstanding quality issues (ie, ‘deficits’) that could be given to clinicians prior to seeing each patient. Computer-generated paper reminders have been shown to increase rates of cancer screening and immunizations,6–8 but they have been less successful for improving care for chronic diseases.7 Other studies have shown that for some services (eg, ordering an annual cholesterol test, prescribing a statin for patients with coronary artery disease) electronic reminders are marginally more effective than paper reminders, although the evidence is mixed.9 10 However, our study is unique because we sought to examine the marginal value of paper reminders within the context of our overall EHR-based intervention, especially whether paper reminders would improve performance for physicians whose performance lagged behind others, possibly due to differences in how they used the EHR in their workflow. It is important to determine whether paper reminders add incremental value to EHR point-of-care reminders, because implementing pre-encounter paper alerts increases costs and alters the workflow for nursing staff.
Methods
We have previously reported the design principles and methods for the UPQUAL study.5 These are briefly summarized here, followed by a full description of the new intervention and analyses.
The central hypothesis of UPQUAL is that improving the accuracy of electronic, point-of care clinical decision support tools (ie, quality reminders) can create a ‘virtuous cycle.’ Entering exceptions, when appropriate, improves the accuracy of the decision supports by turning off a reminder for a period of time. This increases the positive predictive value of alerts in the future and increases clinicians' trust in reports of their performance: the accuracy of the report is determined largely by the accuracy of the data they enter. If clinicians seek to provide the highest quality of care possible, then they need to eliminate the ‘noise’ in the system by recording exceptions so they can find the patients who truly need care. They are therefore more motivated to use the clinical decision support system, including recording exceptions.
UPQUAL had several design principles, including non-disruptive reminders (‘passive alerts’): a ‘hub and spoke’ design of the clinical decision support that allowed providers to jump to patients' medication history, a health maintenance section to record outside tests, and pre-specified order sets as needed to gain information and act on the alerts; tools to allow clinicians to enter patient and medical reasons for not following recommendations (ie, exceptions) as part of routine workflow; feedback to physicians on their performance on quality measures; and feedback to physicians of the names of patients not receiving essential medications so they could reach out to patients who are not scheduled for upcoming appointments.
Setting and eligible patients
We performed this study at an academic internal medicine practice in Chicago, Illinois that uses a commercial EHR (EpicCare, Spring 2007 and then Spring 2008; Epic Systems, Verona, Wisconsin, USA). Northwestern University's institutional review board approved the study with a waiver of patient informed consent. All patients eligible for one or more quality measures (table 1) cared for by attending physicians were included.
Table 1.
Quality of care measures
| Measure (number of eligible patients)* | Denominator criteria | Numerator satisfied | Exception applied when numerator not met† |
| Coronary heart disease | |||
| Antiplatelet drug (1202) | Coronary heart disease diagnosis | Antiplatelet drug on active medication list | Anticoagulant prescribed, medical reason, patient reason |
| Lipid lowering drug (1202) | Coronary heart disease diagnosis | Lipid-lowering drug on active medication list | Medical reason, patient reason, LDL <100 mg/dl within the last 365 days |
| β Blocker after MI (235) | Myocardial infarction diagnosis | β Blocker on active medication list | Medical reason, patient reason, β blocker allergy |
| ACE inhibitor or ARB (443)‡ | Coronary heart disease diagnosis and diabetes diagnosis | ACE inhibitor/ARB on active medication list | Medical reason, patient reason, ACE inhibitor and ARB allergy |
| Heart failure | |||
| ACE inhibitor or ARB in LVSD (276)‡ | Heart failure diagnosis | ACE inhibitor/ARB on active medication list | Medical reason, patient reason, ACE inhibitor and ARB allergy, LVEF >40% |
| β Blocker in LVSD (276)‡ | Heart failure diagnosis | β Blocker on active medication list | Medical reason, patient reason, β blocker allergy, LVEF >40% |
| Anticoagulation in atrial fibrillation (106) | Heart failure and atrial fibrillation diagnosis | Anticoagulant on active medication list or referred to anticoagulation clinic | Medical reason, patient reason |
| Diabetes mellitus | |||
| HbA1c control (1814)‡ | Diabetes diagnosis | HbA1c <8.0% | Medical reason, patient reason |
| LDL control (1595)‡ | Diabetes diagnosis, ≥50 years and female, or male | LDL-C <100 mg/dl | Medical reason, patient reason, prescribed high potency statin§ |
| Aspirin for primary prevention (1695) | Diabetes diagnosis, no diagnosis of coronary heart disease and age ≥40 years | Antiplatelet drug on active medication list | Medical reason, patient reason, aspirin allergy, anticoagulant prescribed |
| Nephropathy screening or management (1814)‡ | Diabetes diagnosis | Test for nephropathy in past year or ACE inhibitor or ARB on active medication list | Medical reason, patient reason |
| Prevention | |||
| Screening mammography (3539)‡ | Women 50–69 years | Mammography in past 2 years | Medical reason, patient reason |
| Cervical cancer screening (7462)‡ | Women 21–64 years | Cervical cytology in past 3 years | Medical reason, patient reason |
| Colorectal cancer screening (7067)‡ | Age 50–80 years | FOBT in past 1 year, sigmoidoscopy in past 5 years, colonoscopy in past 10 years or DCBE in past 5 years | Medical reason, patient reason |
| Pneumococcal vaccination (2966)‡ | Age ≥65 years | Pneumoccocal vaccine ever | Medical reason, patient reason |
| Osteoporosis screening or treatment (1816)‡ | Women age ≥65 years | Bone density with central DXA after age 60 or medical therapy for osteoporosis¶ | Medical reason, patient reason |
Number eligible on February 1, 2008. Patients were eligible for quality measures if they had two or more office visits in the previous 18 months. No patients younger than 18 years of age were included.
Exceptions that are medical reasons, patient reasons, erroneous diagnoses, or LVEF >40% are entered manually by clinicians. All other exceptions are measured automatically from existing coded data fields in the electronic health record.
Indicates that a point-of-care reminder was newly added at the start of the intervention. All others had reminders that were redesigned at the start of the intervention.
Prescribed atorvastatin 80 mg, rosuvastatin 40 mg, or simvastatin 80 mg tablet.
Prescribed a bisphosphonate, systemic estrogen, selective estrogen receptor modulators, parathyroid hormone, or calcitonin.
ACE, angiotensin converting enzyme; ARB, angiotensin-receptor blocker; CHD, coronary heart disease; DCBE, double contrast barium enema; DXA, dual-emission x-ray absorptiometry; FOBT, fecal occult blood test; LVEF, left ventricular ejection fraction; LVSD, left ventricular systolic dysfunction; LDL-C, low-density lipoprotein cholesterol; MI, myocardial infarction.
The practice has used EpicCare since 1997. During the 2 years prior to the start of the study (2006–2007), we developed quality measurement tools using discrete data from the EHR. Physicians received printed quarterly reports of their performance on 12 quality measures (all of which were included in this intervention). They did not receive information about individual patients with quality deficits. Interruptive (ie, ‘pop-up’) point-of-care reminders with links to order entry were active for many clinical topics but were rarely used. Some measures included limited medical exceptions (eg, a documented drug allergy), but there was no mechanism for clinicians to record other medical and patient reasons for not following recommendations. These reminders were discontinued 3 months before the intervention began.
Initial implementation of the UPQUAL intervention (phase 1)
The UPQUAL intervention has been fully described previously (including figures with examples of the EHR interfaces) and is only summarized here. We used a minimally intrusive reminder: a single tab in the visit navigator which was highlighted in yellow if any measure was not satisfied and an exception was not documented. Alerts included standardized ways to capture patient reasons (eg, refusals) or medical reasons for not following an alert. Clinicians could also enter global exceptions (eg, terminal disease) to suppress multiple reminders and for performance measurement. Preventive services performed elsewhere could also be recorded.
The UPQUAL intervention was implemented on February 7, 2008. We held a 1-h initial training session to teach physicians how to use the decision support tools and to record exceptions. Performance was not used to determine compensation. We informed clinicians that medical exceptions would be peer reviewed; the vast majority of medical exceptions entered were judged valid.11 In addition, we gave physicians printed lists each month of their patients who appeared to be eligible for an indicated medication but were not receiving it and had no exception recorded. Quarterly performance reports were continued as before the start of the study. This intervention was continued for 1 year through February 2009.
Addition of pre-visit printed clinical reminders (phase 2)
The nurses in the general internal medicine (GIM) clinic typically record vital signs and any comments for the physician (eg, ‘needs medication refill’) on a sheet that is left in a box outside the examination room. In February 2009, we implemented a system that queried the EHR for outstanding quality deficits when the patient registered and printed these for the rooming nurses to use in lieu of their previous rooming sheets. All other quality measurement and feedback remained the same.
Study measures
At each time point, patients were eligible for a measure if they had two or more office visits in the preceding 18 months, were cared for by an attending physician, and met the other measure criteria (table 1). For chronic disease measures, we included patients when ICD-9-CM disease codes were recorded on the active problem list, past medical history, or as prior visit diagnoses. We used Structured Query Language to retrieve data from an enterprise data warehouse that contains data copied daily from the EHR. For each of the 37 months of the evaluation period (1 year prior to the intervention, phase 1, and phase 2), all patients were classified for each measure for which they were eligible as: (a) satisfied, (b) did not satisfy but had an exception, or (c) did not satisfy and had no documented exception. The primary outcome for each measure was calculated as: number satisfied/(number eligible−number not satisfied with an exception). Changes in secondary outcomes during the year after the intervention (eg, number who did not satisfy but had an exception) have been reported previously and are not reported here for the second study year.
Statistical analysis of changes in group performance during phase 2
Analyses used SAS v 9.1 (SAS Institute, Cary, North Carolina, USA) and R software package v 0.10–16 (R Foundation for Statistical Computing, Vienna, Austria). We calculated each of the 16 performance measures for the first of each month from February 1, 2007 through February 1, 2010. This yielded a 37-point time series for each measure. For the current analysis, we concentrated only on data from months 24–37. To determine whether changes in performance over this time period were statistically significant, a linear model was fit to each time series using time (ie, month) as a continuous predictor, as described previously.5 Next, we determined the autoregressive order of the model residuals by minimizing Akaike's information criterion.12 Finally, we fit a linear regression model with autoregressive errors (using the appropriate number of autoregressive parameters, if any were necessary) to each series. These fitted models were used to test statistical significance.13 To ensure model validity, we examined several residual diagnostics, the Jarque–Bera and the Shapiro–Wilk tests for normality of residuals, and normal Q-Q and autocorrelation plots.14–16
Changes during phase 2 for physicians with low performance at the end of phase 1
In addition to the time series analyses, we conducted analyses to specifically examine changes in performance for physicians at the low end of the range within the practice. As described above, these physicians were the real target of the phase 2 intervention. We anticipated that the overall changes in performance across all physicians would be relatively small during phase 2 because most physicians were already near the ceiling of attainable quality for many process of care measures (ie, near 100% for prescribing recommended medications) and for preventive care measures most physicians were actively using the clinical decision support tools and performance was still rising at a steady pace.
To examine changes at the physician level, we developed two composite measures, one for the seven recommended medications for patients with coronary artery disease (four measures) and/or heart failure (three measures), and one for the five preventive services. For each physician in the practice throughout the entire study period (N=31), we identified all patients eligible for each of the composite measures at the start and end of phase 2 who did not have an exception recorded. We then determined whether the medication was prescribed and determined the performance (percent satisfied). Thus, if a physician had five patients eligible for all coronary artery disease measures and four eligible for all heart failure measures, none of which had an exception documented, the physician would have 32 eligible measures and a range of possible performance from 0 to 32. Performance was reported as percent satisfied, as described above. For each of the two composite measures, we compared differences in the mean improvement in performance during phase 2 for the 15 physicians whose performance was below the median and the 15 physicians whose performance was above the median using two-sample t tests.
Results
At the start of phase 1 of the intervention (February 2008), 12 288 patients were eligible for one or more of the target measures. The number of patients eligible for each quality measure ranged from 106 to 7462, as shown in table 1. Among those eligible, 75.7% were female, the mean age was 53.1 years (SD 15.6), 48.0% were white, 23.7% were black, 16.2% were Hispanic, and 12.1% were of other or unknown race; 67.0% had commercial health insurance, 26.8% had Medicare, 3.4% had Medicaid, and 2.8% were uninsured. There were 39 internists at the practice; 49% were female and 92% had worked at the practice for at least 2 years.
Table 2 shows the performance for each measure at four time points: (1) 1 year before the start of the intervention (February 1, 2007), (2) at the start of the UPQUAL intervention (February 1, 2008), (3) 1 year after the start of the intervention (February 1, 2009), and (4) 2 years after the start of the intervention (February 1, 2010). Performance at the beginning of the analysis period (February 1, 2007) ranged from 50.9% for low-density lipoprotein (LDL) cholesterol control in diabetes to 88.9% for prescription of an antiplatelet drug after myocardial infarction (table 2). We have previously reported the rates of change for each measure during the year before (February 1, 2007 to February 1, 2008) and the year after the intervention (phase 1; February 1, 2008 to February 1, 2009) and the difference between the rate of change during the first study year compared to the year before the intervention, as obtained from the fitted regression models.5
Table 2.
Percentage of patients meeting quality measures and the modeled rates of change for quality measures during phase 2 (end of year 1 to end of year 2) of the intervention*
|
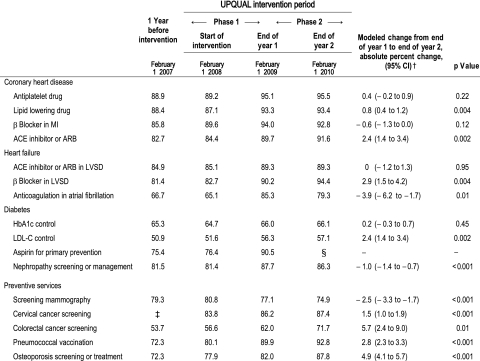
*Quality measures were calculated as the number who satisfied the measure/(number eligible−number not satisfied with an exception).
†Rates of change were derived from the linear regression models with autoregressive errors when necessary as described in the Methods section.
‡Performance for the cervical cancer screening measure could not be calculated accurately prior to January 2008 because of missing date information for exceptions.
§Because of studies questioning the value of aspirin for primary prevention, this recommendation and the quality measure were discontinued for the practice, and the clinical decision support tool was turned off. As expected, performance declined to 84.2% by the end of phase 2.
ACE, angiotensin converting enzyme; ARB, angiotensin-receptor blocker; LDL-C, low-density lipoprotein cholesterol; LVSD, left ventricular systolic dysfunction; MI, myocardial infarction.
Practice-level changes in performance during phase 2
Performance improved significantly for eight of the 16 measures during phase 2 (table 2). For all of these measures, performance had improved significantly during phase 1. Performance of screening mammography declined significantly during phase 2; this was already declining in phase 1, which we had attributed previously to a shortage of trained radiologists and prolonged waiting times at our institution. Performance decreased for two other measures during phase 2: (1) prescription of anticoagulants for patients with atrial fibrillation and heart failure, and (2) nephropathy screening or management for patients with diabetes. Both of these had previously shown an improvement in performance during phase 1. Performance did not change during phase 2 for antiplatelet drug prescribing for patients with coronary artery disease; performance had increased during phase 1 and remained stable at a very high level (approximately 95%). Glycemic control (hemoglobin A1c <8 %) did not change throughout the study.
Changes during phase 2 for physicians with low performance at the end of phase 1
Changes in physician-level performance on the composite measure of prescribing essential medications are shown in figure 1. The median performance at the end of phase 1 (top of the black or white closed bar) was 94.2% (range 80.0–100%). At the end of phase 2 (top of either the black bar or the top of the grey bar on top of the black bar), the median performance was 95.6% (range 85.0–100%). Among the physicians whose performance was below the median at the end of phase 1, the mean change in performance was +1.7% (range −3.5% to +8.5%). Among physicians whose performance was above the median at the end of phase 1, the mean change in performance was −0.7% (range −3.8% to +4.2%), which was not statistically significant compared to those whose performance had been below the median. Eight physicians had performance below 90%; during phase 2, their mean performance improved by 2.9% (range −3.5% to +8.5%); however, five remained below 90% performance, and only one rose to be above the median performance.
Figure 1.

Changes in performance for prescribing all essential medications to all eligible patients in physicians' individual panels. Performance for each physician in the practice as of February 2009 (the end of phase 1) is shown by (a) the solid black bar alone, or (b) the combined solid black bar plus the stacked open white bar. Physicians are ordered from lowest to highest performance as of February 2009. If performance decreased between February 2009 and February 2010, this decline is indicated by the open white bar, so the performance for these physicians at the end of February 2010 (the end of phase 2) is the top of the solid black bar. If performance increased, this is indicated with a gray bar above the black bar so that the performance at the end of February 2010 is at the top of the gray bar.
Changes in physician-level performance on the composite measure of preventive service use are shown in figure 2. The median performance at the end of phase 1 (top of the black or white closed bar) was 80.0% (range 38.4–89.9%). At the end of phase 2 (top of either the black bar or the closed white bar on top of the black bar), the median performance was 81.3% (range 43.7–92.5%). Among the physicians whose performance was below the median at the end of phase 1, the mean change in performance was +3.1% (range −1.1% to +8.9%). Among physicians whose performance was above the median at the end of phase 1, the mean change in performance was +1.4 (range −3.5 to +6.5), which was not statistically significant compared to those whose performance had been below the median. Among the eight physicians with the lowest performance at the end of phase 1, six remained in the bottom eight at the end of phase 2.
Figure 2.

Changes in performance for completing all preventive services for all eligible patients in physicians' individual panels. Performance for each physician in the practice as of February 2009 (the end of phase 1) is shown by (a) the solid black bar alone, or (b) the combined solid black bar plus the stacked open white bar. Physicians are ordered from lowest to highest performance as of February 2009. If performance decreased between February 2009 and February 2010, this decline is indicated by the open white bar, so the performance for these physicians at the end of February 2010 (the end of phase 2) is the top of the solid black bar. If performance increased, this is indicated with a gray bar above the black bar so that the performance at the end of February 2010 is at the top of the gray bar.
Discussion
During phase 1 of the UPQUAL intervention, performance improved significantly for 14 of 16 measures, with more rapid improvement compared to historical trends for nine of these measures5; very high performance was achieved for several process of care measures. Although performance continued to increase during phase 2 for eight measures, the rate of improvement was similar or less than that in phase 1. In addition, performance declined during phase 2 for two measures that had improved previously. These results suggest that paper reminders presented to physicians prior to their entering the exam room do not have a marginal benefit when implemented as an additional component of the comprehensive UPQUAL quality improvement structure.
For some physicians, it would have been difficult to improve performance during phase 2 because they had already achieved very high levels of quality. However, even when we restricted our focus to physicians on the lower end of the performance curve, we found that paper reminders did not accelerate their rate of improvement, and they continued to lag behind their peers. At business meetings when we discussed quality improvement, these physicians had attributed their lower performance compared to peers in the practice to not routinely opening patients' electronic records at the start of the visit. Thus, they might not see alerts until the end of the visit, or even after the visit if charting was done later. Our results argue against this explanation for their lower performance. If this was the cause, the paper reminders should have allowed them to rapidly correct their performance, and we found little evidence of this. Their average rate of improvement was small for both the composite essential medications and the composite preventive service measure, and most physicians in the lower half of performance at the start of phase 2 continued to have substantially poorer performance than their peers. This suggests that there may have been other aspects of their workflow that adversely affected their attention to outstanding quality issues, or they may have had less positive attitudes towards the UPQUAL intervention or quality improvement efforts in general. UPQUAL did not include financial incentives so that we could look purely at the utility of the quality improvement tools and overall method. Some physicians may need financial incentives to motivate them to use quality improvement tools in the EHR.
Our ability to draw firm conclusions about the value of paper reminders is limited by the fact that we used time series analyses to examine changes in performance. It is possible that a randomized controlled trial would have been more sensitive for detecting a small marginal benefit of paper reminders. In addition, performance in our practice had already reached a very high level for some measures during phase 1. It is possible that without the paper reminders, performance would have reached a plateau in phase 2 and the paper-based reminders actually caused further increases that would otherwise not have occurred. To examine this possibility, we visually analyzed the time series curves for several measures to see if there was a plateau in performance by the end of phase 1 and then an upward inflection at the start of phase 2 (data not shown). We found no evidence of this. However, it is possible that paper reminders would have produced a marginal improvement in performance if quality of care had started at a lower level, if the reminders in the EHR were not as visible as they were in our system, or if the study had been conducted among physicians who were less experienced users of the EHR.
There are several other important limitations to this study. First, this study was conducted in one academic practice with a single EHR that had been in use for many years. Second, the intervention was focused on physicians, with little involvement of nurses or other members of the healthcare team. Some practices have told us that they are printing paper reminders of outstanding quality issues when a patient registers for care, and the healthcare team has individual and group responsibility for addressing specific topics, including ordering preventive services or standing orders for vaccinations. In addition, some practices are printing sheets for patients to review and then discuss outstanding quality issues with their physicians. Our results may have been different if the paper reminders were implemented with either of these approaches.
The adoption of EHR-based quality measurement and quality improvement tools will vary widely across physicians. Like all innovations, there will be ‘early adopters’ who rapidly embrace new tools and ‘laggards’ who have either attitudinal or practical barriers to adoption.17 There are probably multiple reasons why some physicians did not improve their performance as much as others after the start of the UPQUAL intervention. However, our results suggest that lagging performance is not due to providers' EHR workflow alone, and we believe that trying to step backwards and use paper reminders in addition to point-of-care reminders in the EHR will not be an effective strategy for engaging slow adopters. Instead, we think it is better to move forward and undertake strategies that we think will be more likely to accelerate performance improvement, including providing general advice on how to improve efficient use of the EHR, additional training for using computerized reminders and electronic quality improvement tools, and financial incentives for addressing outstanding quality issues.
Footnotes
Funding: Financial support was received from the Agency for Healthcare Research and Quality, grant 1R18HS17163-01. Dr. Persell was supported by career development award 1K08HS015647-01 from the Agency for Healthcare Research and Quality.
Competing interests: None.
Ethics approval: This study was conducted with the approval of the ethics committee of Northwestern University IRB.
Provenance and peer review: Not commissioned; externally peer reviewed.
References
- 1.Tang PC, Ralston M, Arrigotti MF, et al. Comparison of methodologies for calculating quality measures based on administrative data versus clinical data from an electronic health record system: implications for performance measures. J Am Med Inform Assoc 2007;14:10–15 [DOI] [PMC free article] [PubMed] [Google Scholar]
- 2.Kerr EA, Smith DM, Hogan MM, et al. Comparing clinical automated, medical record, and hybrid data sources for diabetes quality measures. Jt Comm J Qual Improv 2002;28:555–65 [DOI] [PubMed] [Google Scholar]
- 3.Kawamoto K, Houlihan CA, Balas EA, et al. Improving clinical practice using clinical decision support systems: a systematic review of trials to identify features critical to success. BMJ 2005;330:765. [DOI] [PMC free article] [PubMed] [Google Scholar]
- 4.Chaudhry B, Wang J, Wu S, et al. Systematic review: impact of health information technology on quality, efficiency, and costs of medical care. Ann Intern Med 2006;144:742–52 [DOI] [PubMed] [Google Scholar]
- 5.Persell SD, Kaiser D, Dolan NC, et al. Changes in performance after implementation of a multifaceted electronic-health-record-based quality improvement system. Med Care 2011;49:117–25 [DOI] [PubMed] [Google Scholar]
- 6.Shea S, DuMouchel W, Bahamonde L. A meta-analysis of 16 randomized controlled trials to evaluate computer-based clinical reminder systems for preventive care in the ambulatory setting. J Am Med Inform Assoc 1996;3:399–409 [DOI] [PMC free article] [PubMed] [Google Scholar]
- 7.Hunt DL, Haynes RB, Hanna SE, et al. Effects of computer-based clinical decision support systems on physician performance and patient outcomes: a systematic review. JAMA 1998;280:1339–46 [DOI] [PubMed] [Google Scholar]
- 8.Stone EG, Morton SC, Hulscher ME, et al. Interventions that increase use of adult immunization and cancer screening services: a meta-analysis. Ann Intern Med 2002;136:641–51 [DOI] [PubMed] [Google Scholar]
- 9.Sequist TD, Gandhi TK, Karson AS, et al. A randomized trial of electronic clinical reminders to improve quality of care for diabetes and coronary artery disease. J Am Med Inform Assoc 2005;12:431–7 [DOI] [PMC free article] [PubMed] [Google Scholar]
- 10.Hicks LS, Sequist TD, Ayanian JZ, et al. Impact of computerized decision support on blood pressure management and control: a randomized controlled trial. J Gen Intern Med 2008;23:429–41 [DOI] [PMC free article] [PubMed] [Google Scholar]
- 11.Persell SD, Dolan NC, Friesema EM, et al. Frequency of inappropriate medical exceptions to quality measures. Ann Intern Med. 2010;152:225–31 [DOI] [PubMed] [Google Scholar]
- 12.Akaike H. A new look at the statistical model identification. IEEE Transactions on Automatic Control 1994;19:716–23 [Google Scholar]
- 13.Trapletti A, Hornik K. Tseries: time series analysis and computational finance. R Package Version 0.10-18. Vienna, Austria: R Foundation for Statistical Computing; 2009 [Google Scholar]
- 14.Jarque CM, Bera AK. Efficient tests for normality, homoscedasticity and serial independence of regression residuals. Econ Lett 1980;6:255–9 [Google Scholar]
- 15.Shapiro SS, Wilk MB. An analysis of variance test for normality (complete samples). Biometrika 1966;52:591–611 [Google Scholar]
- 16.Wilk MB, Gnanadesikan R. Probability plotting methods for the analysis of data. Biometrika 1968;55:1–17 [PubMed] [Google Scholar]
- 17.Rogers EM. Diffusion of Innovations. New York, NY: Simon & Schuster, Inc, 1995 [Google Scholar]