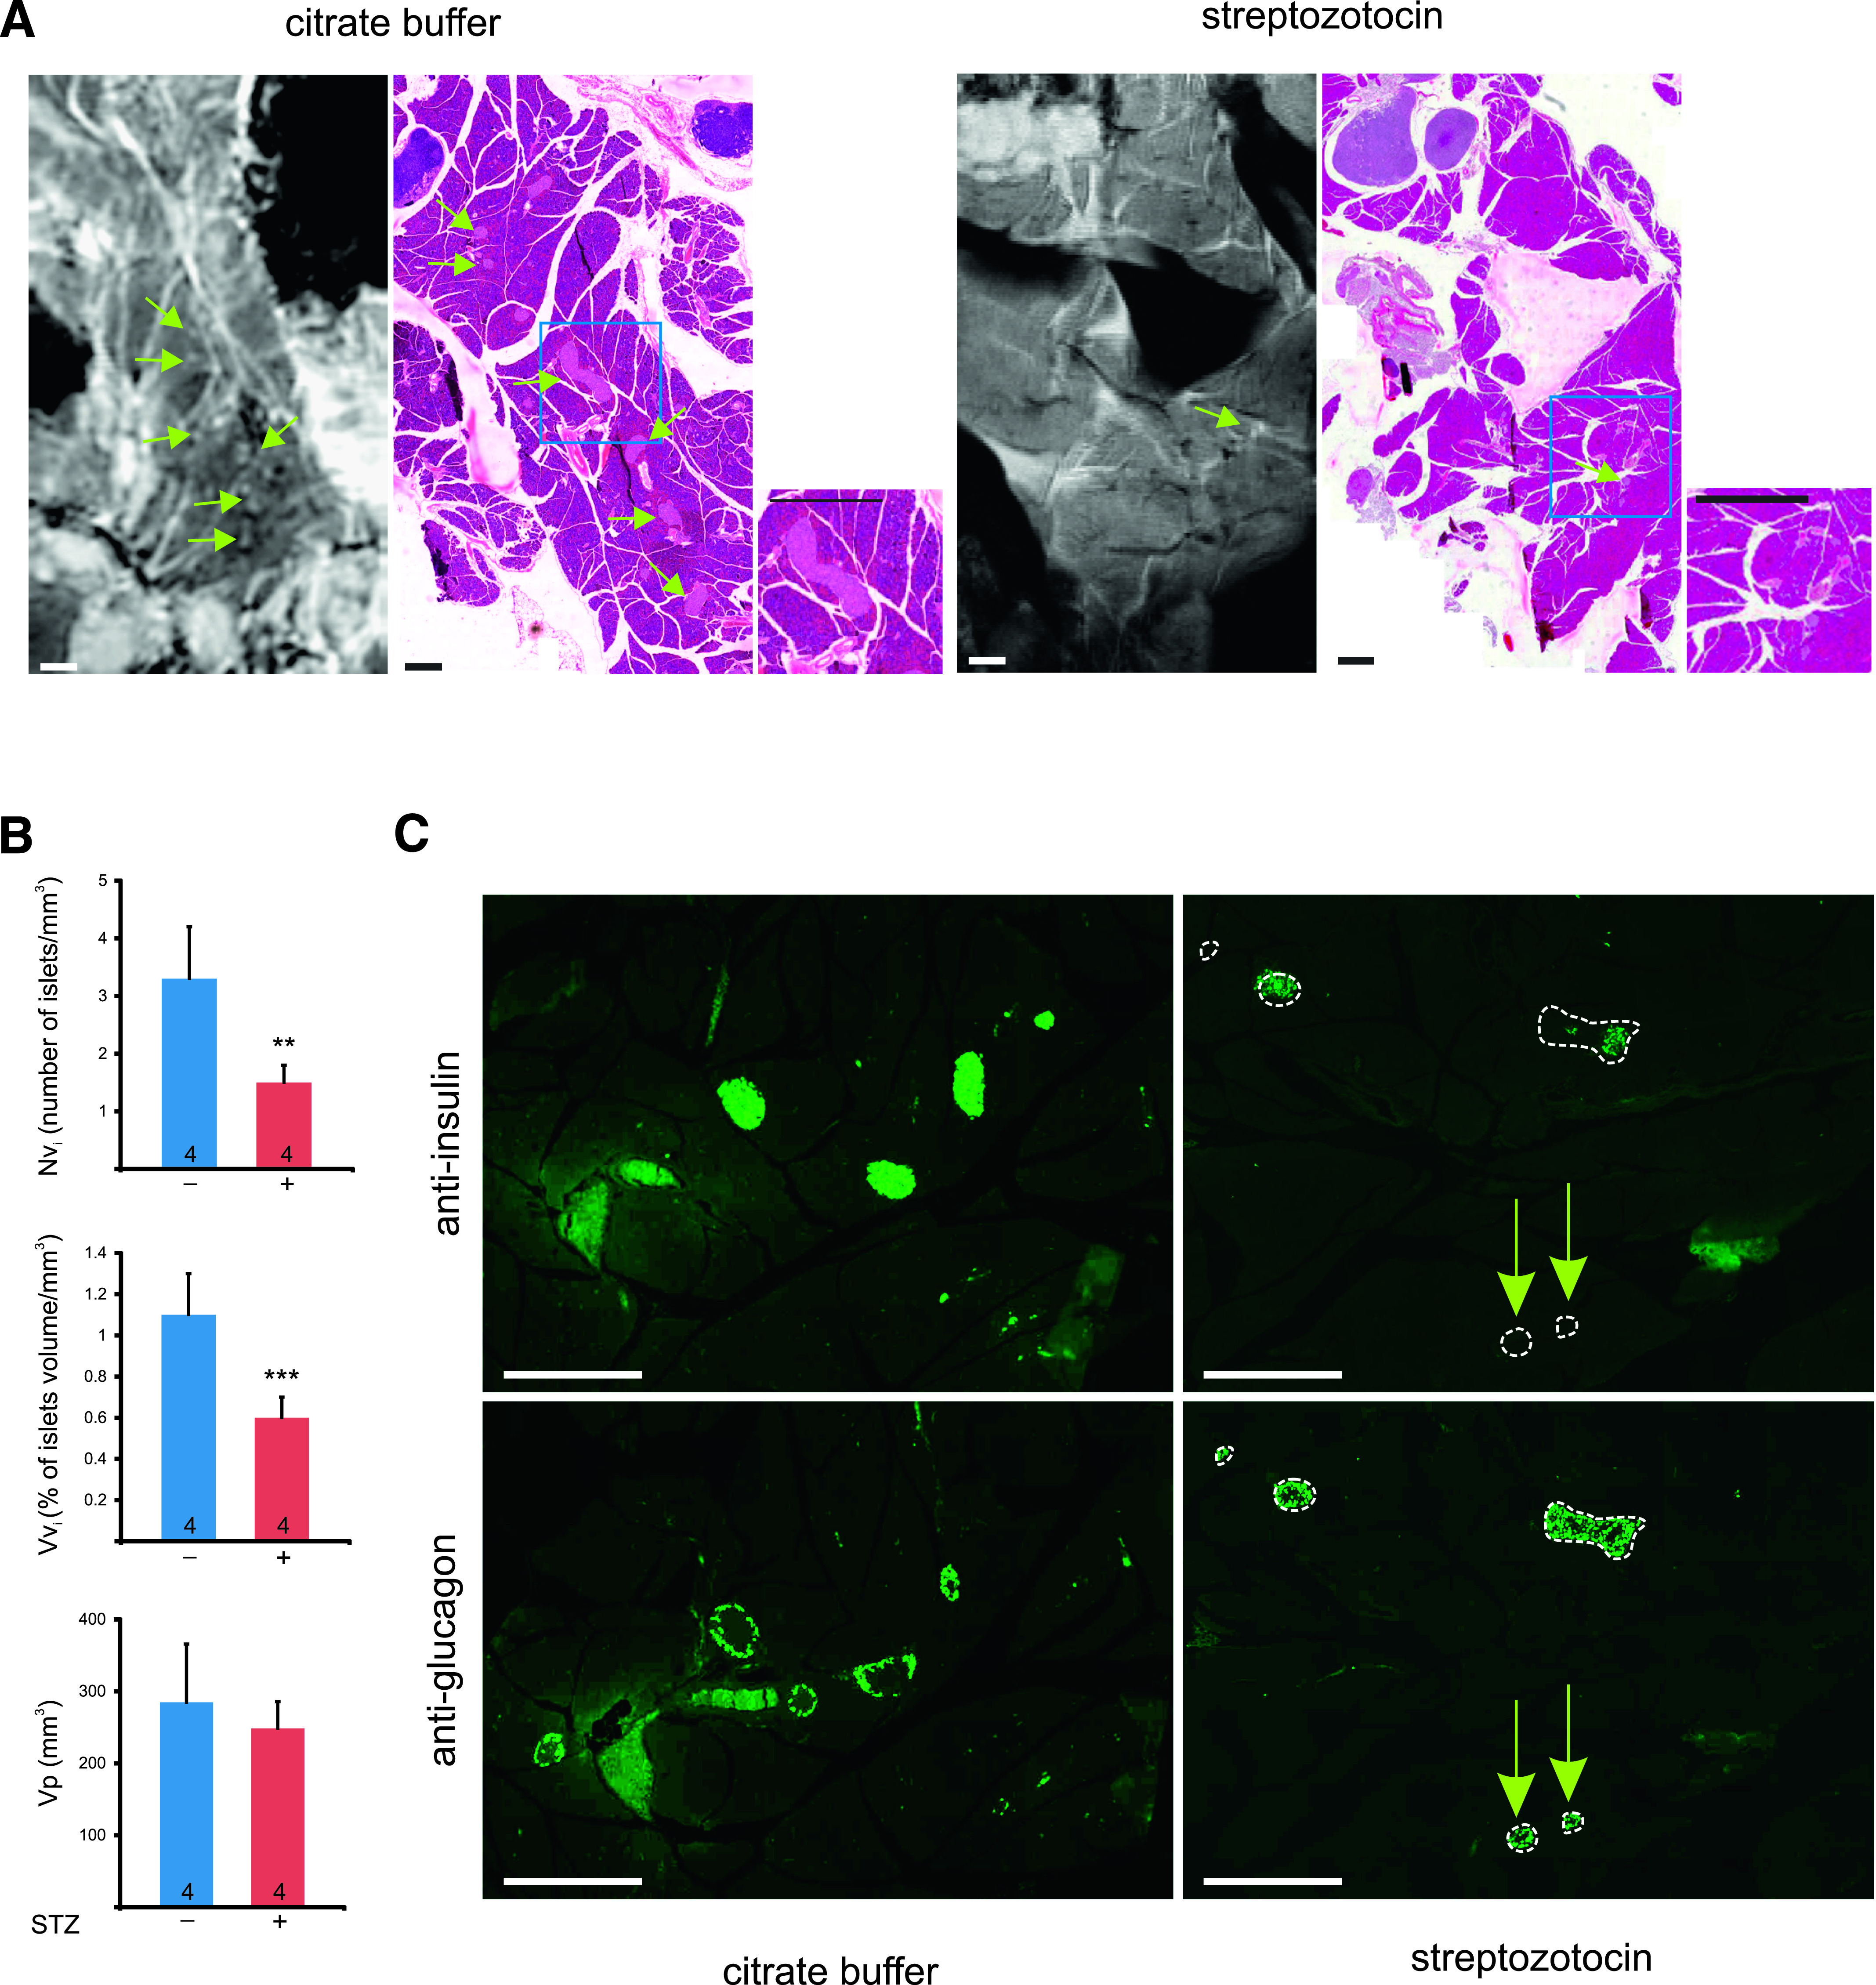
FIG. 4.

MRI detects the loss of islets in a diabetic mouse model. A: High magnification MR and histology images of pancreas from mice injected with either CB (normoglycemic controls) or the buffer supplemented with STZ (hyperglycemic mice). Whitish (MRI)/pink islets (histology) were seen more frequently in the pancreata of control rather than of STZ-injected mice (some islets are pointed by green arrows). Scale bar: 1 mm and 0.5 mm in the insets. B: Morphometric analysis of the MR images showed that hyperglycemic mice had a pancreas volume (Vp; bottom) that was not significantly different from that of the citrate-injected controls. In contrast, the relative number (Nvi; top) and volume density (Vvi; middle) of the islets were decreased by 55 and 45%, respectively, in the STZ-injected mice. Data are mean + SEM of the indicated number of pancreas (**P < 0.01; *** P < 0.001). C: Immunostainings of consecutive pancreas sections of control and STZ-treated mice with antibodies against insulin and glucagon show that the STZ treatment significantly reduced the number of β-cells in most islets (outlined by white dotted lines). Most islets still contained many glucagon-containing α-cells. Some small islets (arrows) were essentially made by the latter type of islet cells and were fully devoid of insulin-containing cells. Scale bar: 0.5 mm. (A high-quality digital representation of this figure is available in the online issue.)
