

Our analysis of data from the American College of Radiology Imaging Network National CT Colonography Trial in three Cancer Intervention and Surveillance Modeling Network microsimulation models predicts CT colonography to be more costly and less effective than non-CT colonographic screening but net beneficial compared with no screening.
Abstract
Purpose:
To estimate the cost-effectiveness of computed tomographic (CT) colonography for colorectal cancer (CRC) screening in average-risk asymptomatic subjects in the United States aged 50 years.
Materials and Methods:
Enrollees in the American College of Radiology Imaging Network National CT Colonography Trial provided informed consent, and approval was obtained from the institutional review board at each site. CT colonography performance estimates from the trial were incorporated into three Cancer Intervention and Surveillance Modeling Network CRC microsimulations. Simulated survival and lifetime costs for screening 50-year-old subjects in the United States with CT colonography every 5 or 10 years were compared with those for guideline-concordant screening with colonoscopy, flexible sigmoidoscopy plus either sensitive unrehydrated fecal occult blood testing (FOBT) or fecal immunochemical testing (FIT), and no screening. Perfect and reduced screening adherence scenarios were considered. Incremental cost-effectiveness and net health benefits were estimated from the U.S. health care sector perspective, assuming a 3% discount rate.
Results:
CT colonography at 5- and 10-year screening intervals was more costly and less effective than FOBT plus flexible sigmoidoscopy in all three models in both 100% and 50% adherence scenarios. Colonoscopy also was more costly and less effective than FOBT plus flexible sigmoidoscopy, except in the CRC-SPIN model assuming 100% adherence (incremental cost-effectiveness ratio: $26 300 per life-year gained). CT colonography at 5- and 10-year screening intervals and colonoscopy were net beneficial compared with no screening in all model scenarios. The 5-year screening interval was net beneficial over the 10-year interval except in the MISCAN model when assuming 100% adherence and willingness to pay $50 000 per life-year gained.
Conclusion:
All three models predict CT colonography to be more costly and less effective than non-CT colonographic screening but net beneficial compared with no screening given model assumptions.
© RSNA, 2011
Introduction
The American College of Radiology Imaging Network enrolled 2600 asymptomatic subjects aged 50 years or older into the American College of Radiology Imaging Network National CT Colonography Trial (NCTCT) (1). Individuals were scheduled to undergo computed tomographic (CT) colonography followed by colonoscopy, which for trial purposes served as the reference standard. The NCTCT was designed to address widely varying results from previously conducted CT colonography trials (2–7). Results of the NCTCT confirmed that CT colonography depicts colorectal adenomas and carcinomas (neoplasia) with sensitivities of 78%–90% and specificities of 86%–88%, depending on lesion size.
However, it remains unclear whether, given these performance characteristics, screening with CT colonography is an efficient use of resources. Joint guidelines from the American Cancer Society and U.S. Multi-Society Task Force on Colorectal Cancer recommend various options for screening average-risk individuals older than 50 years for colorectal cancer (CRC), including CT colonography at 5-year intervals (8). However, the U.S. Preventive Services Task Force recommends fewer choices and excludes CT colonography due to insufficient evidence (9).
Because successful CRC screening and removal of adenomas can avert the development of carcinoma potentially many years in the future, only a few controlled trials have been able to assess the long-term effectiveness of CRC screening (10–12). Instead, decision makers have relied on simulations of the natural history of colorectal neoplasia to extrapolate long-run costs and health consequences from test performance characteristics (13). Such models vary widely in underlying formulas and data sources used to estimate model parameters.
Recognizing both the importance and variability of such models, the National Cancer Institute sponsored the Cancer Intervention and Surveillance Modeling Network (CISNET). CISNET is a collaborative effort—with independent teams using their own unique model structures and common sources of data to simulate the natural history of various cancers. The CISNET CRC group includes three validated models: MISCAN (14,15), CRC-SPIN (16), and SimCRC (17). The purpose of this analysis was to estimate the cost-effectiveness of CT colonography for CRC screening in average-risk asymptomatic subjects in the United States aged 50 years.
Materials and Methods
We analyzed data from NCTCT to obtain per-patient definitions of sensitivity and specificity that reflect colonoscopy referral patterns likely to be encountered in practice. Enrollees provided informed consent, and approval was obtained from the institutional review board at each site. Industry support for the American College of Radiology Imaging Network (ACRIN 6664) trial was provided by GE Healthcare (Waukesha, Wis) for in-kind use of training facilities, by E-Z-Em (Lake Success, NY) for in-kind training and equipment supplied at cost, and by Bracco Imaging (Princeton, NJ) for supplying their stool tagging product. The industry supporters did not have access to the data reported herein. These results were then incorporated into the CISNET CRC models to estimate the cost-effectiveness and net health benefit of CT colonography relative to guideline-concordant screening strategies and no screening for the average-risk population aged 50 years and older, from a U.S. health care sector perspective.
Natural History Models
Each model simulates large cohorts representative of 50-year-old subjects in the United States in 2007. In all models, each simulated individual may develop adenomas beginning at age 20 years in one of six locations: (a) cecum, (b) ascending colon, (c) transverse colon, (d) descending colon, (e) sigmoid colon, and (f) rectum. Adenoma risk depends on age, sex, and individual risk factors. Multiple adenomas may arise over a lifetime. A subset of adenomas may grow and/or become carcinomas. Undiagnosed carcinomas may progress from stage I to stage IV or be detected clinically, with survival assigned according to stage at detection on the basis of Surveillance, Epidemiology, and End Results (SEER) data from 1996 to 1999 (18). Non-CRC-related death rates came from U.S. life tables (19).
There are few longitudinal studies of the adenoma-carcinoma sequence (20–22); hence, many natural history parameters are unknown. The CISNET models use a common set of calibration data on adenoma prevalence by age (23–32) and prescreening CRC incidence by age, stage, and location from SEER (1975–1979) (18). CISNET maintains standardized, detailed technical profiles of each model on the Internet (33).
Screening Models
In each simulation, natural history can be interrupted by detection and removal of adenomas or early detection and treatment of carcinomas. We modeled three recommended strategies: flexible sigmoidoscopy every 5 years plus sensitive unrehydrated fecal occult blood testing (FOBT) or fecal immunochemical testing (FIT) annually; colonoscopy every 10 years; and CT colonography every 5 or 10 years, where all individuals with suspicious lesions at least 5 mm undergo follow-up colonoscopy. Screening was simulated to begin at age 50 years and discontinue after age 80 years. Postpolypectomy surveillance followed guidelines (34) and continued until death.
Sensitivity of CT colonography was derived on a per-patient basis to reflect the clinical practice of referral of a patient with any suspicious lesion measuring at least 5 mm at CT colonography to follow-up colonoscopy. The operating characteristics of CT colonography are likely to vary when patients have larger or multiple adenomas. Therefore, we analyzed NCTCT data to estimate the probability that any suspicious lesion measuring at least 5 mm would be reported for a patient given the number of pathologically confirmed adenomas or carcinomas (none, one, two, or three or more) and the size of the largest lesion (1–5 mm, 6–9 mm, ≥10 mm), assuming all carcinomas were at least 10 mm (Table 1). We defined specificity to be the probability that CT colonography did not depict any suspicious lesions measuring at least 5 mm, given that an individual had no pathologically confirmed neoplasia of any size (Table 1).
Table 1.
Screening Model Parameters
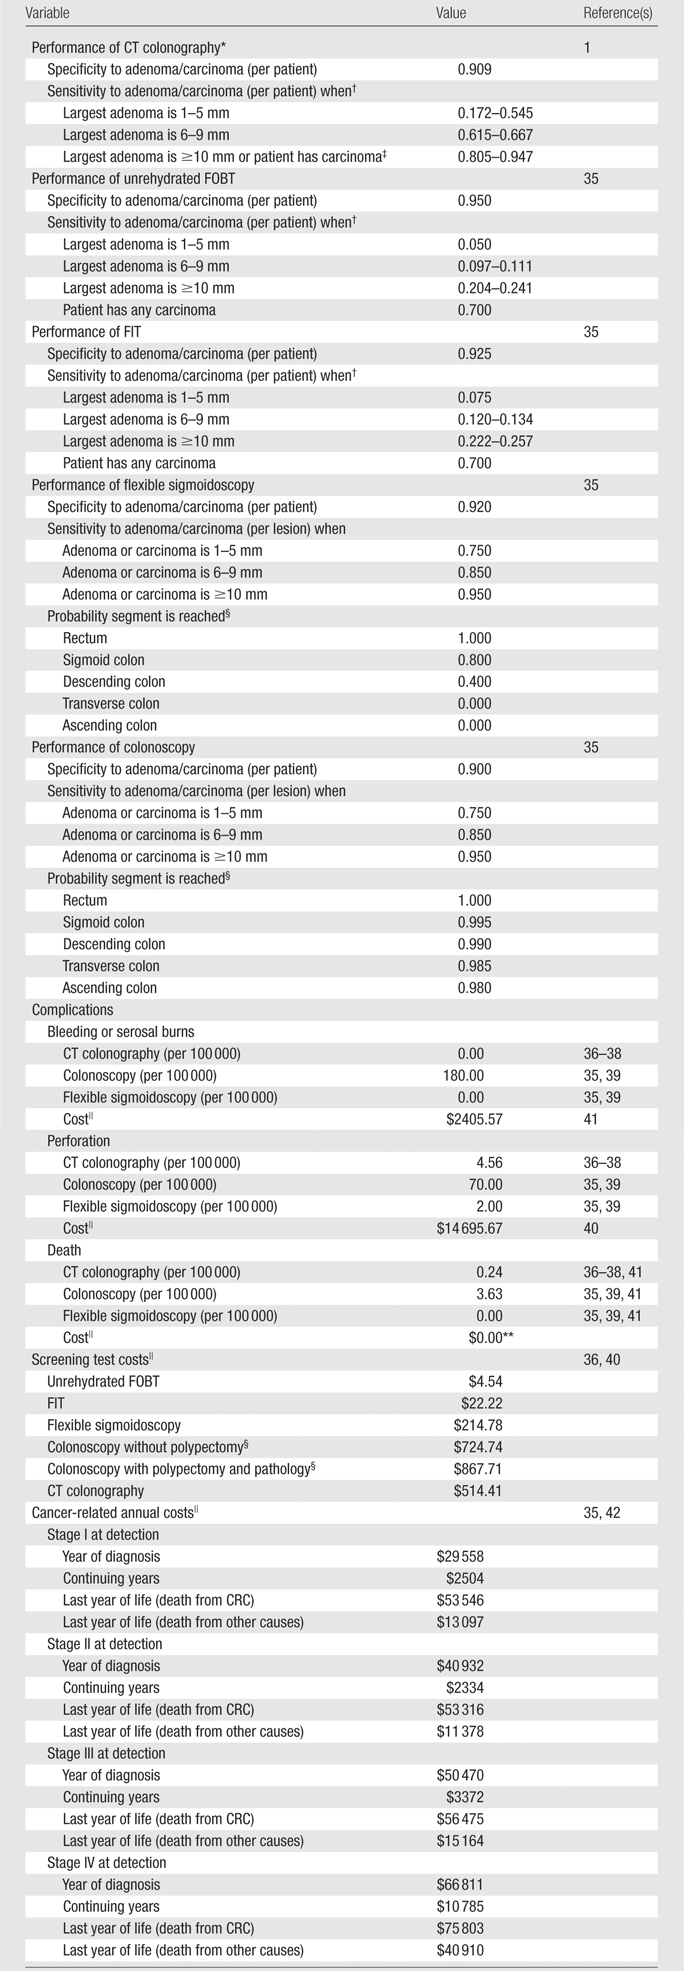
The test performance characteristics of modalities other than CT colonography were adapted from a recent technology assessment commissioned by the Center for Medicare and Medicaid Services (35) (Table 1). Because colonoscopy and sigmoidoscopy depict individual lesions and stool tests help detect the gross presence of blood, we applied colonoscopy and sigmoidoscopy sensitivity on a per-lesion basis and stool test sensitivity conditional on the number and size of adenomas (Table 1). During years in which both sigmoidoscopy and stool testing are scheduled, we assumed that the stool test occurred first, and, if positive, triggered direct referral to colonoscopy. Detection and removal of hyperplastic polyps are not modeled explicitly but instead are reflected in the specificity estimates of each test.
In our base case, we assumed 100% adherence to all recommended screening, follow-up, and surveillance to compare cost-effectiveness of the approaches for subjects who adhered to the guidelines. We also conducted a sensitivity analysis scenario with 50% adherence to screening tests and 100% adherence to diagnostic and surveillance colonoscopy.
We adapted endoscopic complication rates from the aforementioned technology assessment (35), assuming that perforation rates do not differ by occurrence of biopsy as suggested by a recent outpatient study (Table 1) (39). We assumed a CT colonography perforation rate of two per 21 923 (36). Some evidence suggests that perforations associated with CT colonography may be less harmful than those associated with colonoscopy (37,38); however, to be conservative, we assumed that perforations associated with CT colonography had the same 5.2% mortality rate (41) and cost as those associated with colonoscopy.
Costs
We used 2007 Medicare fee schedules and reimbursement formulas to proxy direct medical costs of procedures and complications (40), using site-of-care weights derived from Center for Medicare and Medicaid Services data when available (Table 1) (35). We adjusted colonoscopy costs to account for the estimated need to repeat 5% of outpatient colonoscopies due to inadequate bowel preparation, difficult patient anatomy, and/or operator error (43).
The Center for Medicare and Medicaid Services has not assigned relative value units for screening CT colonography. To maintain comparability of costing methods, we combined Medicare reimbursement–based cost estimates for CT of the abdomen without contrast material (CPT-74150), CT of the pelvis without contrast material (CPT-72192), and three-dimensional image reconstruction with postprocessing (CPT-76377) and applied a cost-reduction factor to account for resource savings associated with imaging contiguous anatomic regions (44).
We estimated complication costs from Medicare average reimbursement for diagnosis-related groups and procedures representative of each complication type (Table 1) (35). Annual cancer treatment costs were based on a retrospective analysis of SEER data linked to 1999–2003 Medicare claims, comparing costs of patients with CRC by stage and phase of care to sex, age, and geography-matched control subjects (35,42).
Following U.S. guidelines, we applied a 3% annual discount rate to both costs and health outcomes unless otherwise noted (45). Discounting reduces the value of future costs and life-years gained to reflect social time preferences. However, in the case of screening, where time horizons are long and survival benefits accrue far into the future, it is also useful to consider undiscounted life-years gained.
Economic Evaluation
A screening strategy was “dominated” if it was more costly and less effective than another strategy or “weakly dominated” if dominated by a weighted average of two strategies. We calculated the incremental cost-effectiveness ratio (ICER) for each nondominated strategy as the ratio of the incremental cost (ΔC) to incremental years of life gained (ΔYLG) compared with the next-least-costly, nondominated strategy (ICER = ΔC/ΔYLG).
Frontier plots (46) for each model and adherence scenario were constructed showing the total discounted life-years gained versus additional costs for each screening strategy relative to no screening. The origin ($0, 0 life-years gained) corresponds to “no screening” as the baseline comparator. Moving from left to right represents increasing cost, whereas moving from bottom to top represents improving outcomes. For each model, the outer envelope (upward and to the left) comprises screening strategies that have the potential to be cost-effective, depending on willingness to pay per life-year gained. Points below and to the right of the envelope are either dominated or weakly dominated. The ICERs for nondominated screening strategies can be visualized as the inverse of the slopes of segments connecting the outer envelope of strategies.
We also calculated the net health benefit of each strategy with the following formula: life-years gained − (cost/λ), where λ is one of three “opportunity costs” ($50,000, $75,000, or $100,000) per life-year gained (47). The opportunity cost λ reflects the cost necessary to save 1 year of life if resources spent on CRC screening instead were spent elsewhere in the health sector. A rational health care payer should be unwilling to pay more than the opportunity cost to gain a year of life by means of CRC screening. Use of the net health benefit allows multiple competing strategies to be rank ordered according to economic efficiency.
Results
The models project similar lifetime CRC risk and life expectancy without screening (Table 2). If we assume 100% adherence, all models found that colonoscopy, FIT plus flexible sigmoidoscopy, and FOBT plus flexible sigmoidoscopy increased life expectancy and reduced lifetime CRC risk more than CT colonographic screening at 5- or 10-year intervals. When screening adherence was 50%, performing CT colonography every 5 years reduced CRC risk more than colonoscopy in two of the three models (MISCAN: 39.1% vs 38.7%; SimCRC: 61.6% vs 59.5%) and had higher undiscounted life-years gained than did colonoscopy in all models (Table 2).
Table 2.
Screening Strategy Outcomes
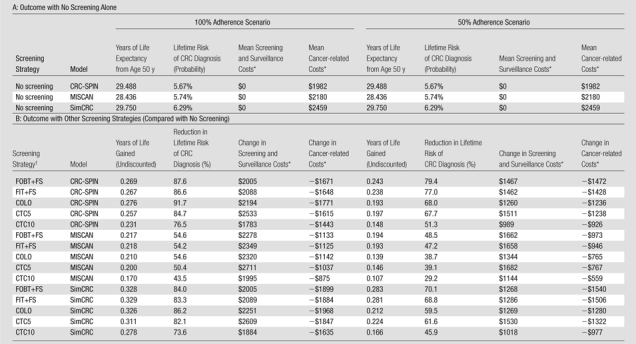
In discounted 2007 U.S. dollars.
COLO = colonoscopy at 10-year intervals, CTC5 = CT colonography with 5-mm referral threshold at 5-year intervals, CTC10 = CT colonography with 5-mm referral threshold at 10-year intervals, FIT+FS = annual FIT plus flexible sigmoidoscopy at 5-year intervals, FOBT+FS = annual unrehydrated FOBT plus flexible sigmoidoscopy at 5-year intervals.
Predicted cost and effectiveness were similar across the models (Table 3). With 100% adherence, all models predicted total costs to be lowest with no screening ($1982–$2459) and highest with CT colonography every 5 years ($2900–$3854). With 50% screening adherence, all models found CT colonography every 5 years to be the most costly (Table 3). Two models found that screening with conventional methods reduced total costs relative to no screening (CRC-SPIN: $1978 for FOBT plus flexible sigmoidoscopy vs $1982 for no screening; SimCRC: $2188 for FOBT plus flexible sigmoidoscopy, $2239 for FIT plus flexible sigmoidoscopy, and $2447 for colonoscopy vs $2459 for no screening) (Table 3).
Table 3.
Incremental Cost-effectiveness Analysis
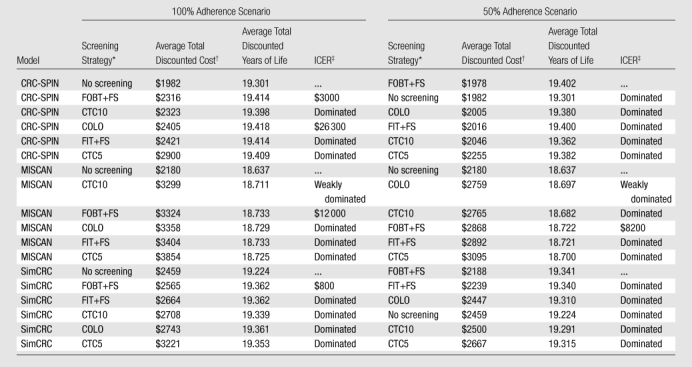
Strategies are sorted according to total discounted cost, from lowest to highest. COLO = colonoscopy at 10-year intervals, CTC5 = CT colonography with 5-mm referral threshold at 5-year intervals, CTC10 = CT colonography with 5-mm referral threshold at 10-year intervals, FIT+FS = annual FIT plus flexible sigmoidoscopy at 5-year intervals, FOBT+FS = annual unrehydrated FOBT plus flexible sigmoidoscopy at 5-year intervals.
In 2007 U.S. dollars.
A strategy is “dominated” if it is more costly and generates fewer total discounted life-years than another strategy; a strategy is “weakly dominated” if it is dominated by a linear combination of two other strategies. Incremental cost-effectiveness is compared to the next-least-costly nondominated strategy and is expressed in discounted dollars per discounted life-years gained and rounded to the nearest $100.
We represent cost-effectiveness using a frontier graph (Figure), with each point representing the incremental cost and incremental effectiveness of a strategy relative to no screening. All models place FOBT plus flexible sigmoidoscopy on the cost-effectiveness frontier, meaning that FOBT plus flexible sigmoidoscopy is cost-effective at some willingness-to-pay per life-year gained. With 100% adherence, the ICER for FOBT plus flexible sigmoidoscopy compared with no screening ranged from dominant (less costly and more effective) to $12 000 per life-year gained (Figure). None of the models found FIT plus flexible sigmoidoscopy to be cost-effective relative to FOBT plus flexible sigmoidoscopy at less than $100 000 per life-year gained; CRC-SPIN, however, found an ICER of $26 300 per life-year gained for colonoscopy relative to FOBT plus flexible sigmoidoscopy; colonoscopy was dominated in the other models (Figure). With 50% screening adherence, FOBT plus flexible sigmoidoscopy dominated all other strategies (including no screening) in CRC-SPIN and SimCRC and had an ICER of $8200 per life-year gained compared with no screening in MISCAN (CT colonography at both 5- and 10-year intervals). CT colonography at both 5- and 10-year intervals was dominated by FOBT plus flexible sigmoidoscopy with either 50% or 100% screening adherence (Figure).

Frontier analysis of cost-effectiveness. For each model, a frontier line connects the outer envelope of screening strategies. Strategies lying below and to the right of the frontier are either dominated (both more costly and less effective than a specific alternative strategy) or extended-dominated (both more costly and less effective than a linear combination of two strategies). Strategies on the frontier represent an efficient use of resources for some willingness to pay per life-year gained. COLO = colonoscopy at 10-year intervals, CTC5 = CT colonography with 5-mm referral threshold at 5-year intervals, CTC10 = CT colonography with 5-mm referral threshold at 10-year intervals, FIT+FS = annual FIT plus flexible sigmoidoscopy at 5-year intervals, FOBT+FS = annual unrehydrated FOBT plus flexible sigmoidoscopy at 5-year intervals.
The models generated similar rank ordering of strategies by net health benefit (Table 4). All screening strategies, including CT colonography, were more economically efficient than no screening in all models at all three opportunity costs and with either 50% or 100% screening adherence (Table 4). However, FOBT plus flexible sigmoidoscopy, FIT plus flexible sigmoidoscopy, and colonoscopy were generally more economically efficient than CT colonography at 5- or 10-year intervals, except that with 50% screening adherence, SimCRC found CT colonography every 5 years to be more economically efficient than colonoscopy at all three opportunity costs (Table 4). The models found CT colonoscopy every 5 years to be consistently more economically efficient than CT colonography every 10 years, except under 100% adherence and a $50 000 per life-year gained opportunity cost, when CRC-SPIN favored CT colonography every 10 years (Table 4).
Table 4.
Net Health Benefits
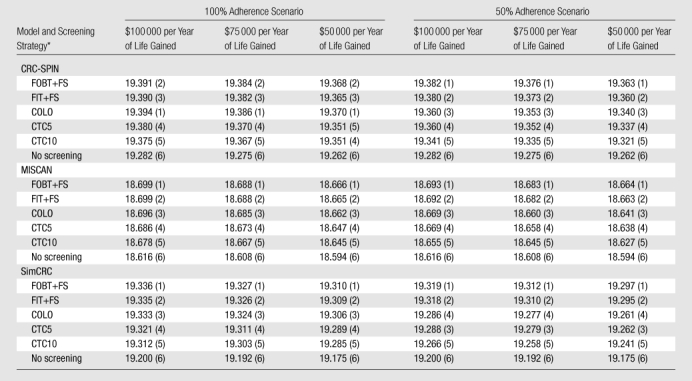
Note.—Data are net health benefits. Numbers in parentheses are rank, which was assigned from most efficient (score, 1) to least efficient (score, 6) given the indicated opportunity cost of health care expenditures.
COLO = colonoscopy at 10-year intervals, CTC5 = CT colonography with 5-mm referral threshold at 5-year intervals, CTC10 = CT colonography with 5-mm referral threshold at 10-year intervals, FIT+FS = annual FIT plus flexible sigmoidoscopy at 5-year intervals, FOBT+FS = annual unrehydrated FOBT plus flexible sigmoidoscopy at 5-year intervals.
We performed threshold analyses in all models and scenarios to account for uncertainty about the cost of CT colonography. CT colonography would have to cost less than $191 for at least one model (MISCAN) to predict that CT colonography every 5 years would be the most net beneficial screening strategy in the most favorable circumstances ($50 000 per life-year gained opportunity cost and 100% adherence). The cost of CT colonography would have to exceed $1845 for CT colonography every 5 years to be less net beneficial than no screening in at least one model (MISCAN) in the least favorable circumstances ($50 000 per life-year gained opportunity cost and 50% screening adherence).
Discussion
Our analysis of data from the American College of Radiology Imaging Network NCTCT in three CISNET microsimulation models predicts CT colonography to be more costly and less effective than non-CT colonographic screening but net beneficial compared with no screening. Although absolute costs and outcomes differed slightly, the models were largely consistent in the relative costs, outcomes, and ranking by net benefits among the strategies. All models found that CT colonography at either 5- or 10-year intervals is likely to be cost-effective relative to no screening but that both strategies were dominated by conventional screening tests. The models also found colonoscopy likely to be more costly and less effective than FOBT plus flexible sigmoidoscopy (except with perfect adherence in one model), yet colonoscopy is likely to be net beneficial compared with no screening.
Our results confirm those of previously published Markov modeling studies that found CT colonography performed at 5- or 10-year intervals beginning at age 50 years to be cost-effective compared with no screening ($4400–$28 700 per life-year gained) but not incrementally cost-effective compared with colonoscopy (48–51). Our results are also consistent with findings from a systematic review of cost-effectiveness analyses for the U.S. Preventive Services Task Force that three of the four reviewed models that included both FOBT plus flexible sigmoidoscopy and colonoscopy found FOBT plus flexible sigmoidoscopy to gain the most years of life (52), although we note that one of the three models reviewed was a predecessor to SimCRC.
Our multimodel approach offers an advantage over approaches used in previous studies by allowing investigation of convergent validity—the extent to which results are sensitive to model specification (53). Although all three CISNET models incorporate heterogeneous adenoma growth rates, only MISCAN explicitly separates adenomas into progressive and nonprogressive types. MISCAN consequently offers a shorter window of opportunity with which to detect progressive adenomas, which explains why MISCAN showed the lowest screening effectiveness. Despite differences in absolute effectiveness, the high concordance of incremental cost-effectiveness and rankings by net health benefit was reassuring.
There are several limitations to our study. We did not specifically account for extracolonic findings (54,55) or possible radiation-related cancer risk (56) owing to CT colonography. There are limited data to inform the magnitude of the benefits and harms associated with the diagnostic work-up of extracolonic findings and the long-term radiation-related cancer risk.
With current CT colonography guidelines, colonoscopy referral is recommended only for suspicious lesions measuring at least 6 mm (57). Our analysis used a 5-mm referral threshold; however, changing this threshold to 6 mm in our models resulted in consistent but very small reductions in both costs and discounted years of life (ranging from $3 to $42 and 0.002 to 0.005 years of life, respectively, depending on model, scenario, and repeat interval).
Because we did not include patient and other sector costs or quality of life, our analysis is not a “reference case” as defined by U.S. Panel on Cost-effectiveness in Health and Medicine guidelines (45). However, our findings are comparable with those of other studies of CT colonography cost-effectiveness, which also are not reference cases.
Because the Center for Medicare and Medicaid Services has not established relative value units for screening CT colonography reimbursement, we constructed a proxy by combining CT procedures, following an approach used in other analyses (51,58). Our threshold analysis suggests that CT colonography costs can vary over a wide range (from half to three times the estimated cost) before altering the fundamental result that all three models agree CT colonography screening is economically efficient compared with no screening but not cost-effective compared with other methods.
Although we used the most recently published analysis of SEER-linked Medicare data to estimate costs of treating CRC, higher costs associated with novel chemotherapeutics and biologics may not be fully reflected (59,60). Underestimating CRC costs potentially biases cost-effectiveness against strategies most effective at preventing cancer because the potential cost savings of avoiding cancer treatment are reduced.
Like the above-referenced cost-effectiveness analyses of CT colonography, we did not address quality of life. If early detection of neoplasia increases quality as well as quantity of life, this exclusion may bias against screening. However, anxiety, discomfort, and activity limitation associated with screening itself may have a direct impact on quality of life. The direction and persistence of such impacts is unclear (61–64).
Our scenarios assume equal adherence with each screening test. If better adherence is economically beneficial, then this assumption may overestimate the benefits of strategies that are less likely to be attended regularly by patients. Varying adherence among screening options may be important in determining cost-effectiveness (65). Although some evidence suggests that patients prefer CT colonography to endoscopy (66–68), other studies suggest the opposite (69,70). Previous acceptability studies analyzed individuals who volunteer for screening with CT colonography and/or endoscopy and may not reflect attitudes in the general screening population.
Our limited adherence scenario assumes that individuals have a 50% probability of receiving screening when due, which effectively implies a screening interval that is double in average. A 2005 study from the National Health Interview Survey found that the age-standardized proportion of respondents who reported undergoing FOBT within the past year and/or endoscopy within the past 10 years was 50.0% (71). However, even 50% adherence may be an optimistic estimate if, for example, there were substantial recall bias or if National Health Interview Survey respondents represent an unusually adherent subgroup of the population. Our analysis demonstrated that moving from 100% to 50% adherence reduced the net benefits of screening more for less frequent tests (colonoscopy and CT colonography every 10 years) than for more frequent tests (CT colonography every 5 years, FIT plus flexible sigmoidoscopy, or FOBT plus flexible sigmoidoscopy). If actual overall adherence is lower than 50%, such differences in net benefits would likely increase.
Furthermore, both adherence scenarios assume that individuals with positive screening always attend follow-up colonoscopy. If some who had positive screening results with FOBT, FIT, flexible sigmoidoscopy, or CT colonography but did not attend follow-up colonoscopy would have attended initial screening colonoscopy, the net benefit of those screening tests relative to colonoscopy would be overestimated. Although our simple reduced adherence scenario has been used in other cost-effectiveness analyses of CRC screening (51,72), more realistic scenarios should be explored (52).
The CISNET models found that for an asymptomatic, average-risk cohort of 50-year-old subjects in the United States, CT colonography screening every 5 or 10 years is more costly and less effective than guideline-concordant non-CT colonography screening approaches under both perfect and less than ideal adherence, given model assumptions and current cost estimates. The CISNET models also found that although CT colonography screening (in either 5- or 10-year intervals) is not likely to be net beneficial compared with existing recommended screening, it may be cost-effective compared with no screening. The models also found that 5-year screening intervals are likely to be net beneficial compared with 10-year intervals. That three independent models reached similar conclusions adds credibility to our findings.
Advances in Knowledge.
On the basis of an analysis of data from the American College of Radiology Imaging Network National CT Colonography Trial and three Cancer Intervention and Surveillance Modeling Network (CISNET) colorectal cancer microsimulations, screening an asymptomatic, average-risk cohort of 50-year-old subjects in the United States every 5 or 10 years with CT colonography is predicted to cost more and be less effective than guideline-concordant non-CT colonographic screening approaches.
Screening with CT colonography is predicted by all three CISNET models to be net beneficial compared with no screening.
Five-year CT colonographic screening intervals are predicted to be net beneficial compared with 10-year intervals.
Implication for Patient Care.
Although predicted to be more costly and less effective than other currently recommended colorectal cancer screening approaches, performing CT colonography at 5-year intervals is likely to be net beneficial compared with no screening and therefore may be a cost-effective alternative for screening patients unwilling or unable to use other recommended modalities.
Disclosures of Potential Conflicts of Interest: D.J.V. Financial activities related to the present article: none to disclose. Financial activities not related to the present article: received money for a consultancy from United BioSource; was employed by United BioSource. Other relationships: none to disclose. A.B.K. No potential conflicts of interest to disclose. I.L.V. No potential conflicts of interest to disclose. C.M.R. No potential conflicts of interest to disclose. I.F.G. No potential conflicts of interest to disclose. B.A.H. No potential conflicts of interest to disclose. K.M.K. No potential conflicts of interest to disclose. A.G.Z. No potential conflicts of interest to disclose. M.v.B. No potential conflicts of interest to disclose. E.J.F. No potential conflicts of interest to disclose. M.H.C. No potential conflicts of interest to disclose. C.D.J. Financial activities related to the present article: none to disclose. Financial activities not related to the present article: institution received money for a software license/patent; receives royalties from GE Medical Systems; institution receives royalties from GE Medical Systems. Other relationships: none to disclose.
Received December 14, 2010; revision requested February 1, 2011; revision received May 19; accepted May 24; final version accepted May 27.
The findings and conclusions are those of the authors. No statement in this article should be construed as an official position of the National Cancer Institute, the National Institutes of Health, or the U.S. Department of Health and Human Services.
Funding: This research was supported by the National Institutes of Health (grants U01-CA-088204, U01-CA-097426, U01-CA-097427, U01-CA-115953, U01 CA079778, and U01 CA080098).
Abbreviations:
- CISNET
- Cancer Intervention and Surveillance Modeling Network
- CRC
- colorectal cancer
- FIT
- fecal immunochemical testing
- FOBT
- fecal occult blood testing
- ICER
- incremental cost-effectiveness ratio
- NCTCT
- National CT Colonography Trial
- SEER
- Surveillance, Epidemiology, and End Results
References
- 1.Johnson CD, Chen MH, Toledano AY, et al. Accuracy of CT colonography for detection of large adenomas and cancers. N Engl J Med 2008;359(12):1207–1217 [DOI] [PMC free article] [PubMed] [Google Scholar]
- 2.Johnson CD, Toledano AY, Herman BA, et al. Computerized tomographic colonography: performance evaluation in a retrospective multicenter setting. Gastroenterology 2003;125(3):688–695 [DOI] [PubMed] [Google Scholar]
- 3.Fletcher JG, Johnson CD, Welch TJ, et al. Optimization of CT colonography technique: prospective trial in 180 patients. Radiology 2000;216(3):704–711 [DOI] [PubMed] [Google Scholar]
- 4.Yee J, Akerkar GA, Hung RK, Steinauer-Gebauer AM, Wall SD, McQuaid KR. Colorectal neoplasia: performance characteristics of CT colonography for detection in 300 patients. Radiology 2001;219(3):685–692 [DOI] [PubMed] [Google Scholar]
- 5.Johnson CD, Harmsen WS, Wilson LA, et al. Prospective blinded evaluation of computed tomographic colonography for screen detection of colorectal polyps. Gastroenterology 2003;125(2):311–319 [DOI] [PubMed] [Google Scholar]
- 6.Cotton PB, Durkalski VL, Pineau BC, et al. Computed tomographic colonography (virtual colonoscopy): a multicenter comparison with standard colonoscopy for detection of colorectal neoplasia. JAMA 2004;291(14):1713–1719 [DOI] [PubMed] [Google Scholar]
- 7.Rockey DC, Paulson E, Niedzwiecki D, et al. Analysis of air contrast barium enema, computed tomographic colonography, and colonoscopy: prospective comparison. Lancet 2005;365(9456):305–311 [DOI] [PubMed] [Google Scholar]
- 8.Levin B, Lieberman DA, McFarland B, et al. Screening and surveillance for the early detection of colorectal cancer and adenomatous polyps, 2008: a joint guideline from the American Cancer Society, the US Multi-Society Task Force on Colorectal Cancer, and the American College of Radiology. CA Cancer J Clin 2008;58(3):130–160 [DOI] [PubMed] [Google Scholar]
- 9.Whitlock EP, Lin JS, Liles E, Beil TL, Fu R. Screening for colorectal cancer: a targeted, updated systematic review for the U.S. Preventive Services Task Force. Ann Intern Med 2008;149(9):638–658 [DOI] [PubMed] [Google Scholar]
- 10.Mandel JS, Bond JH, Church TR, et al. Reducing mortality from colorectal cancer by screening for fecal occult blood. Minnesota Colon Cancer Control Study. N Engl J Med 1993;328(19):1365–1371 [DOI] [PubMed] [Google Scholar]
- 11.Hardcastle JD, Chamberlain JO, Robinson MH, et al. Randomised controlled trial of faecal-occult-blood screening for colorectal cancer. Lancet 1996;348(9040):1472–1477 [DOI] [PubMed] [Google Scholar]
- 12.Kronborg O, Fenger C, Olsen J, Jørgensen OD, Søndergaard O. Randomised study of screening for colorectal cancer with faecal-occult-blood test. Lancet 1996;348(9040):1467–1471 [DOI] [PubMed] [Google Scholar]
- 13.Knudsen AB, McMahon PM, Gazelle GS. Use of modeling to evaluate the cost-effectiveness of cancer screening programs. J Clin Oncol 2007;25(2):203–208 [DOI] [PubMed] [Google Scholar]
- 14.Loeve F, Boer R, van Oortmarssen GJ, van Ballegooijen M, Habbema JD. The MISCAN-COLON simulation model for the evaluation of colorectal cancer screening. Comput Biomed Res 1999;32(1):13–33 [DOI] [PubMed] [Google Scholar]
- 15.Loeve F, Brown ML, Boer R, van Ballegooijen M, van Oortmarssen GJ, Habbema JD. Endoscopic colorectal cancer screening: a cost-saving analysis. J Natl Cancer Inst 2000;92(7):557–563 [DOI] [PubMed] [Google Scholar]
- 16.Rutter CM, Miglioretti DL, Savarino JE. Bayesian calibration of microsimulation models. J Am Stat Assoc 2009;104(488):1338–1350 [DOI] [PMC free article] [PubMed] [Google Scholar]
- 17.Knudsen AB. Explaining secular trends in colorectal cancer incidence and mortality with an empirically-calibrated microsimulation model. Cambridge, Mass: Harvard University, 2005 [Google Scholar]
- 18. Surveillance, Epidemiology and End Results (SEER) Program ( www.seer.cancer.gov) SEER*Stat database: SEER 9 registries public use, based on November 2003 submission (1973–2001). Bethesda, Md: National Cancer Institute, 2004.
- 19.Arias E. United States life tables, 2004. Natl Vital Stat Rep 2007;56(9):1–39 [PubMed] [Google Scholar]
- 20.Welin S, Youker J, Spratt J., Jr The rates and patterns of growth of 375 tumors of the large intestine and rectum observed serially by double contrast enema study (Malmoe technique). Am J Roentgenol Radium Ther Nucl Med 1963;90:673–687 [PubMed] [Google Scholar]
- 21.Stryker SJ, Wolff BG, Culp CE, Libbe SD, Ilstrup DM, MacCarty RL. Natural history of untreated colonic polyps. Gastroenterology 1987;93(5):1009–1013 [DOI] [PubMed] [Google Scholar]
- 22.Hofstad B, Vatn MH, Andersen SN, et al. Growth of colorectal polyps: redetection and evaluation of unresected polyps for a period of three years. Gut 1996;39(3):449–456 [DOI] [PMC free article] [PubMed] [Google Scholar]
- 23.Arminski TC, McLean DW. Incidence and distribution of adenomatous polyps of the colon and rectum based on 1,000 autopsy examinations. Dis Colon Rectum 1964;7:249–261 [DOI] [PubMed] [Google Scholar]
- 24.Blatt LJ. Polyps of the colon and rectum. Dis Colon Rectum 1961;4(4):277–282 [Google Scholar]
- 25.Clark JC, Collan Y, Eide TJ, et al. Prevalence of polyps in an autopsy series from areas with varying incidence of large-bowel cancer. Int J Cancer 1985;36(2):179–186 [DOI] [PubMed] [Google Scholar]
- 26.Chapman I. Adenomatous polypi of large intestine: incidence and distribution. Ann Surg 1963;157:223–226 [DOI] [PMC free article] [PubMed] [Google Scholar]
- 27.Bombi JA. Polyps of the colon in Barcelona, Spain: an autopsy study. Cancer 1988;61(7):1472–1476 [DOI] [PubMed] [Google Scholar]
- 28.Johannsen LG, Momsen O, Jacobsen NO. Polyps of the large intestine in Aarhus, Denmark: an autopsy study. Scand J Gastroenterol 1989;24(7):799–806 [DOI] [PubMed] [Google Scholar]
- 29.Jass JR, Young PJ, Robinson EM. Predictors of presence, multiplicity, size and dysplasia of colorectal adenomas: a necropsy study in New Zealand. Gut 1992;33(11):1508–1514 [DOI] [PMC free article] [PubMed] [Google Scholar]
- 30.Rickert RR, Auerbach O, Garfinkel L, Hammond EC, Frasca JM. Adenomatous lesions of the large bowel: an autopsy survey. Cancer 1979;43(5):1847–1857 [DOI] [PubMed] [Google Scholar]
- 31.Vatn MH, Stalsberg H. The prevalence of polyps of the large intestine in Oslo: an autopsy study. Cancer 1982;49(4):819–825 [DOI] [PubMed] [Google Scholar]
- 32.Williams AR, Balasooriya BA, Day DW. Polyps and cancer of the large bowel: a necropsy study in Liverpool. Gut 1982;23(10):835–842 [DOI] [PMC free article] [PubMed] [Google Scholar]
- 33.CISNET-Model Profiles. 2008. http://cisnet.cancer.gov/colorectal/profiles.html. Accessed February 4, 2009
- 34.Winawer SJ, Zauber AG, Fletcher RH, et al. Guidelines for colonoscopy surveillance after polypectomy: a consensus update by the U.S. Multi-Society Task Force on Colorectal Cancer and the American Cancer Society. Gastroenterology 2006;130(6):1872–1885 [DOI] [PubMed] [Google Scholar]
- 35.Zauber AG, Lansdorp-Vogelaar I, Wilschut J, et al. Cost-effectiveness of DNA stool testing to screen for colorectal cancer. Centers for Medicare & Medicaid Services, 2007http://www.cms.hhs.gov/determinationprocess/downloads/id52TA.pdf. Accessed February 4, 2009 [PubMed]
- 36.Pickhardt PJ. Incidence of significant complications at CT colonography: collective experience of the Working Group on Virtual Colonoscopy. [abstr]. Gastrointest Endosc 2006;63:AB202 [Google Scholar]
- 37.Pickhardt PJ. Incidence of colonic perforation at CT colonography: review of existing data and implications for screening of asymptomatic adults. Radiology 2006;239(2):313–316 [DOI] [PubMed] [Google Scholar]
- 38.Limburg PJ, Fletcher JG. Making sense of CT colonography–related complication rates. Gastroenterology 2006;131(6):2023–2024, discussion 2024 [DOI] [PubMed] [Google Scholar]
- 39.Singh G, Mannalithara A, Mithal A, Gerson LB, Triadafilopoulos G. Perforation risk following colonoscopy: small but significant, and on the rise. [abstr]. Gastrointest Endosc 2007;65:AB320 [Google Scholar]
- 40.Centers for Medicare & Medicaid Services. 2007 physician fee schedule. http://www.cms.hhs.gov/PhysicianFeeSched/PFSRVF/itemdetail.asp?filterType=none&filterByDID=-99&sortByDID=1&sortOrder=ascending&itemID=CMS1203203&intNumPerPage=10. Accessed February 4, 2009.
- 41.Gatto NM, Frucht H, Sundararajan V, Jacobson JS, Grann VR, Neugut AI. Risk of perforation after colonoscopy and sigmoidoscopy: a population-based study. J Natl Cancer Inst 2003;95(3):230–236 [DOI] [PubMed] [Google Scholar]
- 42.Iglehart JK. The new era of medical imaging: progress and pitfalls. N Engl J Med 2006;354(26):2822–2828 [DOI] [PubMed] [Google Scholar]
- 43.Sanaka MR, Shah N, Mullen KD, Ferguson DR, Thomas C, McCullough AJ. Afternoon colonoscopies have higher failure rates than morning colonoscopies. Am J Gastroenterol 2006;101(12):2726–2730 [DOI] [PubMed] [Google Scholar]
- 44.Yabroff KR, Lamont EB, Mariotto A, et al. Cost of care for elderly cancer patients in the United States. J Natl Cancer Inst 2008;100(9):630–641 [DOI] [PubMed] [Google Scholar]
- 45.Weinstein MC, Siegel JE, Gold MR, Kamlet MS, Russell LB. Recommendations of the Panel on Cost-effectiveness in Health and Medicine. JAMA 1996;276(15):1253–1258 [PubMed] [Google Scholar]
- 46.Mark DH. Visualizing cost-effectiveness analysis. JAMA 2002;287(18):2428–2429 [DOI] [PubMed] [Google Scholar]
- 47.Stinnett AA, Mullahy J. Net health benefits: a new framework for the analysis of uncertainty in cost-effectiveness analysis. Med Decis Making 1998;18(2 Suppl):S68–S80 [DOI] [PubMed] [Google Scholar]
- 48.Sonnenberg A, Delcò F, Bauerfeind P. Is virtual colonoscopy a cost-effective option to screen for colorectal cancer? Am J Gastroenterol 1999;94(8):2268–2274 [DOI] [PubMed] [Google Scholar]
- 49.Ladabaum U, Song K, Fendrick AM. Colorectal neoplasia screening with virtual colonoscopy: when, at what cost, and with what national impact? Clin Gastroenterol Hepatol 2004;2(7):554–563 [DOI] [PubMed] [Google Scholar]
- 50.Pickhardt PJ, Hassan C, Laghi A, Zullo A, Kim DH, Morini S. Cost-effectiveness of colorectal cancer screening with computed tomography colonography: the impact of not reporting diminutive lesions. Cancer 2007;109(11):2213–2221 [DOI] [PubMed] [Google Scholar]
- 51.Vijan S, Hwang I, Inadomi J, et al. The cost-effectiveness of CT colonography in screening for colorectal neoplasia. Am J Gastroenterol 2007;102(2):380–390 [DOI] [PMC free article] [PubMed] [Google Scholar]
- 52.Pignone M, Saha S, Hoerger T, Mandelblatt J. Cost-effectiveness analyses of colorectal cancer screening: a systematic review for the U.S. Preventive Services Task Force. Ann Intern Med 2002;137(2):96–104 [DOI] [PubMed] [Google Scholar]
- 53.Weinstein MC, O’Brien B, Hornberger J, et al. Principles of good practice for decision analytic modeling in health-care evaluation: report of the ISPOR Task Force on Good Research Practices—Modeling Studies. Value Health 2003;6(1):9–17 [DOI] [PubMed] [Google Scholar]
- 54.Gluecker TM, Johnson CD, Wilson LA, et al. Extracolonic findings at CT colonography: evaluation of prevalence and cost in a screening population. Gastroenterology 2003;124(4):911–916 [DOI] [PubMed] [Google Scholar]
- 55.Edwards JT, Wood CJ, Mendelson RM, Forbes GM. Extracolonic findings at virtual colonoscopy: implications for screening programs. Am J Gastroenterol 2001;96(10):3009–3012 [DOI] [PubMed] [Google Scholar]
- 56.Brenner DJ, Hall EJ. Computed tomography: an increasing source of radiation exposure. N Engl J Med 2007;357(22):2277–2284 [DOI] [PubMed] [Google Scholar]
- 57.Zalis ME, Barish MA, Choi JR, et al. CT colonography reporting and data system: a consensus proposal. Radiology 2005;236(1):3–9 [DOI] [PubMed] [Google Scholar]
- 58.Hassan C, Pickhardt PJ, Laghi A, et al. Computed tomographic colonography to screen for colorectal cancer, extracolonic cancer, and aortic aneurysm: model simulation with cost-effectiveness analysis. Arch Intern Med 2008;168(7):696–705 [DOI] [PubMed] [Google Scholar]
- 59.Schrag D. The price tag on progress: chemotherapy for colorectal cancer. N Engl J Med 2004;351(4):317–319 [DOI] [PubMed] [Google Scholar]
- 60.Meropol NJ, Schulman KA. Cost of cancer care: issues and implications. J Clin Oncol 2007;25(2):180–186 [DOI] [PubMed] [Google Scholar]
- 61.Cullen J, Schwartz MD, Lawrence WF, Selby JV, Mandelblatt JS. Short-term impact of cancer prevention and screening activities on quality of life. J Clin Oncol 2004;22(5):943–952 [DOI] [PubMed] [Google Scholar]
- 62.Brodersen J, Thorsen H, Cockburn J. Validity of short-term consequences of cancer prevention and screening activities? J Clin Oncol 2005;23(1):244; author reply 244–245 [DOI] [PubMed] [Google Scholar]
- 63.Brodersen J, McKenna SP, Doward LC, Thorsen H. Measuring the psychosocial consequences of screening. Health Qual Life Outcomes 2007;5:3. [DOI] [PMC free article] [PubMed] [Google Scholar]
- 64.Taupin D, Chambers SL, Corbett M, Shadbolt B. Colonoscopic screening for colorectal cancer improves quality of life measures: a population-based screening study. Health Qual Life Outcomes 2006;4:82. [DOI] [PMC free article] [PubMed] [Google Scholar]
- 65.Subramanian S, Klosterman M, Amonkar MM, Hunt TL. Adherence with colorectal cancer screening guidelines: a review. Prev Med 2004;38(5):536–550 [DOI] [PubMed] [Google Scholar]
- 66.Ristvedt SL, McFarland EG, Weinstock LB, Thyssen EP. Patient preferences for CT colonography, conventional colonoscopy, and bowel preparation. Am J Gastroenterol 2003;98(3):578–585 [DOI] [PubMed] [Google Scholar]
- 67.Taylor SA, Halligan S, Saunders BP, Bassett P, Vance M, Bartram CI. Acceptance by patients of multidetector CT colonography compared with barium enema examinations, flexible sigmoidoscopy, and colonoscopy. AJR Am J Roentgenol 2003;181(4):913–921 [DOI] [PubMed] [Google Scholar]
- 68.Svensson MH, Svensson E, Lasson A, Hellström M. Patient acceptance of CT colonography and conventional colonoscopy: prospective comparative study in patients with or suspected of having colorectal disease. Radiology 2002;222(2):337–345 [DOI] [PubMed] [Google Scholar]
- 69.Akerkar GA, Yee J, Hung R, McQuaid K. Patient experience and preferences toward colon cancer screening: a comparison of virtual colonoscopy and conventional colonoscopy. Gastrointest Endosc 2001;54(3):310–315 [DOI] [PubMed] [Google Scholar]
- 70.Rajapaksa RC, Macari M, Bini EJ. Racial/ethnic differences in patient experiences with and preferences for computed tomography colonography and optical colonoscopy. Clin Gastroenterol Hepatol 2007;5(11):1306–1312 [DOI] [PubMed] [Google Scholar]
- 71.Shapiro JA, Seeff LC, Thompson TD, Nadel MR, Klabunde CN, Vernon SW. Colorectal cancer test use from the 2005 National Health Interview Survey. Cancer Epidemiol Biomarkers Prev 2008;17(7):1623–1630 [DOI] [PubMed] [Google Scholar]
- 72.Zauber AG, Lansdorp-Vogelaar I, Knudsen AB, Wilschut J, van Ballegooijen M, Kuntz KM. Evaluating test strategies for colorectal cancer screening: a decision analysis for the U.S. Preventive Services Task Force. Ann Intern Med 2008;149(9):659–669 [DOI] [PMC free article] [PubMed] [Google Scholar]