We found a significant longitudinal increase in tibiofemoral cartilage T2 values in asymptomatic individuals and demonstrated that increased progression of cartilage abnormalities correlated with a greater increase in T2.
Abstract
Purpose:
To determine the frequency of degenerative knee morphologic abnormalities in asymptomatic individuals by using 3-T magnetic resonance (MR) imaging and to investigate the characteristics and evolution of cartilage T2 values in relation to morphologic abnormalities with a longitudinal study.
Materials and Methods:
The study was approved by the institutional review board and was compliant with HIPAA. Ninety-five asymptomatic subjects aged 45–78 years who were free of risk factors for osteoarthritis (OA) were selected from the Osteoarthritis Initiative normal control cohort and examined with radiography and 3-T MR imaging. Data obtained at both baseline and 2-year follow-up were analyzed. OA-related knee abnormalities were analyzed by using the whole-organ MR imaging score (WORMS). Cartilage T2 maps were generated by using sagittal two-dimensional multiecho spin-echo images of the right knee. Statistical significance was determined with the Student t test, the paired t test, a mixed random effects model, one-way analysis of variance, and a multiple linear regression model.
Results:
Knee abnormalities were identified with a high frequency (90% at baseline and 92% at 2-year follow-up). The prevalence of hyaline cartilage lesions was particularly high (86% at baseline and 84% at follow-up). A significant longitudinal increase in T2 was detected in the tibiofemoral cartilage but not the patellofemoral cartilage (P = .0072). The longitudinal change in T2 was significantly associated with worsening of the cartilage WORMS (P = .038).
Conclusion:
Asymptomatic subjects have a high frequency of OA-related morphologic abnormalities. A significant increase in tibiofemoral cartilage T2 was detected over the 2-year period. A greater increase in T2 was associated with increased progression of cartilage morphologic abnormalities.
© RSNA, 2011
Introduction
The pathogenesis of osteoarthritis (OA) is characterized by progressive loss of hyaline articular cartilage, which is preceded by damage to the collagen-proteoglycan matrix and an increase in cartilage water content (1,2). A sensitive method for detecting structural and functional changes of cartilage in the early stages of OA would be valuable for assessing the progression of disease and monitoring the response to therapy. Magnetic resonance (MR) imaging not only enables semiquantitative assessment of various OA-related morphologic abnormalities (3) and quantification of cartilage thickness and volume (4) but also helps characterize changes in the biochemical composition of cartilage during early OA (5). These techniques include cartilage T2 quantification, which may provide promising biomarkers with which to noninvasively assess cartilage quality and susceptibility to injury (6,7). There is increasing evidence to suggest a significant correlation between cartilage T2 values and morphologic abnormalities at MR imaging in both osteoarthritic and asymptomatic populations (8–10). However, there is a lack of longitudinal studies in which cartilage T2 evolution is investigated in relation to OA-related morphologic changes in asymptomatic subjects. Knowledge of cartilage T2 characteristics and evolution in this population may contribute to our understanding of the role of cartilage T2 as an OA imaging biomarker.
This study was performed to determine the prevalence of degenerative knee morphologic abnormalities in asymptomatic individuals without OA by using 3-T MR imaging and to investigate the characteristics and evolution of cartilage T2 values in relation to morphologic abnormalities with a longitudinal study.
Materials and Methods
This article received the approval of the Osteoarthritis Initiative (OAI) Publications Committee on the basis of a review of its scientific content and data interpretation. The work of this research project was supported by the National Institutes of Health and in part by Merck Research Laboratories, Novartis Pharmaceuticals, GlaxoSmithKline, and Pfizer. Private-sector OAI funding is managed by the Foundation for the National Institutes of Health. The authors had control of the data and the information submitted for publication.
Subjects and Study Design
The data used in the preparation of this article were obtained from the OAI database, which is available for public access at http://www.oai.ucsf.edu/. The OAI cohort study is a multicenter, longitudinal, observational study focusing primarily on knee OA. The study enrolled approximately 5000 age-eligible women and men at four recruitment centers; 110 of these participants were healthy control subjects without risk factors for or clinical or radiographic evidence of OA. In this study, we investigated a subset of subjects from this control subcohort. The study protocol, amendments, and informed consent documentation (including analysis plans) were reviewed and approved by the local institutional review boards.
Specific inclusion criteria were as follows: absence of symptomatic knee OA, absence of OA risk factors (which include history of knee surgery or injury, family history of total knee replacement, Heberden nodes, and repetitive knee-bending activities), and absence of radiographic evidence of OA. An additional inclusion criterion included a baseline Western Ontario and McMaster University (WOMAC) pain score of zero for both knees for the 7 days preceding the baseline clinic visit (11,12). Exclusion criteria were rheumatoid arthritis or other type of inflammatory arthritis, severe bilateral joint space narrowing, and contraindications to or inability to undergo MR imaging. Joint space narrowing in OAI was assessed radiographically by using a modified Osteoarthritis Research Society International grading system (13). Severe joint space narrowing was defined as Osteoarthritis Research Society International grade 3 or joint space width of less than 0.5 mm. On the basis of the inclusion and exclusion criteria, 95 subjects (37 women aged 46–69 years, 58 men aged 45–78 years) from the normal control subcohort of the OAI were included; 15 subjects were excluded.
In this longitudinal study, we analyzed data obtained in these 95 subjects at both baseline and 2-year follow-up. Data were obtained with both clinical and imaging examinations. At clinical examination, we used questionnaires to determine the subject’s height, weight, body mass index (BMI), WOMAC score, and Physical Activity Scale for the Elderly (PASE) score. Imaging evaluations included both radiographic and MR examinations (semiquantitative gradings and quantitative analyses of the knee MR studies). A more detailed description of the OAI study design is available at http://oai.epi-ucsf.org/datarelease/docs/StudyDesignProtocol.pdf.
Clinical Questionnaires
WOMAC.—The WOMAC OA index is a scoring system used to evaluate pain, stiffness, and emotional and physical function in patients with OA of the knee and hip (11). The WOMAC questionnaires were administered by the clinical staff at participating centers according to the OAI standard protocol at the time of both baseline and follow-up MR imaging. The WOMAC pain scores range from 0 to 20.
PASE.—Levels of physical activity were assessed with PASE, which is a reliable instrument used to assess physical activity in older individuals (14) and younger subjects (15–17). The PASE scores were obtained with MR imaging at both baseline and follow-up visits by the clinical staff at participating centers. The PASE scale ranges from 0 to 400, with higher scores representing higher levels of physical activity.
Height and weight.—The height and weight of study participants were measured according to the standard OAI protocol, and BMI was calculated.
MR Imaging
MR imaging was performed with identical 3-T MR imaging systems and knee coils (Trio; Siemens, Piscataway, NJ) at both baseline and 2-year follow-up. Three sequences were used for morphologic analysis: a coronal intermediate-weighted two-dimensional fast spin-echo sequence (repetition time msec/echo time msec = 3700/29), a sagittal two-dimensional intermediate-weighted fast spin-echo sequence with fat suppression (3200/30), and a sagittal three-dimensional dual-echo steady-state sequence with selective water excitation with coronal and transverse reformations (16.3/4.7, 25° flip angle) (18). A sagittal two-dimensional multiecho spin-echo sequence was performed in the right knee with seven different echo times (10, 20, 30, 40, 50, 60, and 70 msec) to generate T2 maps.
Image Analysis
Semiquantitative morphologic analyses.—MR images of the right knee were reviewed separately by two musculoskeletal radiologists (J.P. and J.B.P., with 3 and 6 years of MR imaging experience, respectively) with use of a picture archiving communication system workstation (Agfa, Ridgefield Park, NJ). When scores were not identical, consensus readings with a third senior radiologist (T.M.L., with 20 years of experience) were performed. Consensus reading with the third radiologist was performed in 10 of the 95 study subjects. A modified whole-organ MR imaging score (WORMS) system was used to evaluate OA-related abnormalities of the knee (19). Findings in six subregions of the knee (patella, trochlea, medial and lateral femur, and medial and lateral tibia), instead of the originally described 15 subregions, were recorded (20). The following structures were separately evaluated as described in detail previously (10,19): lesions in the cartilage, ligaments, and menisci; bone marrow edema; osteophytes; synovitis or effusion; subarticular cysts; loose bodies; and popliteal cysts.
Cartilage signal intensity and morphologic characteristics were scored together by using an eight-point scale, as follows: 0 = normal thickness and signal intensity; 1 = normal thickness but increased signal intensity on T2-weighted images; 2.0 = partial thickness focal defect less than 1 cm at its greatest width; 2.5 = full-thickness focal defect less than 1 cm at its greatest width; 3 = multiple areas of partial thickness (grade 2.0) defects intermixed with areas of normal thickness or a grade 2.0 defect wider than 1 cm but occupying less than 75% of the region; 4 = diffuse (≥75% of the region) partial-thickness loss; 5 = multiple areas of full-thickness loss (grade 2.5) or a grade 2.5 lesion wider than 1 cm but occupying less than 75% of the region; and 6 = diffuse (≥75% of the region) full-thickness loss.
T2 measurements.—T2 maps were created by using the sagittal two-dimensional multiecho spin-echo images of the right knee and provided exponential curve fits and T2 for each pixel (7). The relaxation time, T2, was estimated by fitting an exponential function to the signal intensity at seven different echo times (10, 20, 30, 40, 50, 60, and 70 msec) by using a simplified monoexponential decay model that has been previously described (6). Images were transferred to a remote workstation and analyzed by using software developed at our institution with an interactive display language (Research Systems, Boulder, Colo) environment. An interactive display language routine was used for segmentation of the patella, trochlea, medial and lateral femoral, and medial and lateral tibial cartilage to simplify the manual drawing of splines delineating cartilage areas. Only areas of artifact-free cartilage were segmented. Image evaluation to determine artifact-free areas of cartilage was performed by T.J. and supervised by T.M.L.
Reproducibility measurements.—Reproducibility for WORMS analysis was calculated in a sample of 12 OAI image data sets that were each assessed twice by two radiologists (J.P. and J.B.P). The two assessments made by each radiologist were separated by a 2-week period. Cohen κ statistics were calculated for inter- and intraobserver agreement. To calculate the reproducibility of cartilage T2 mapping, 12 data sets were randomly selected and segmented three times by the same investigator. The three segmentations were each separated by a 2-week period. The coefficient of variation was determined by using root-mean-square averages of standard deviations of repeated measurements as previously described (21).
Statistical Analysis
Statistical processing was performed with software (JMP, version 8; SAS Institute, Cary, NC). Comparisons between baseline and follow-up BMI, PASE score, and WOMAC score of each individual study participant and the prevalence of morphologic abnormalities were made with paired t tests and McNemar tests, respectively. Comparisons between baseline and follow-up cartilage T2 of the patellofemoral and tibiofemoral joints of each individual study participant were performed with a mixed random effects model, which properly controls for correlations resulting from repeated measurements over time and multiple regional measurements from the same subject (22). T2 values from the patellofemoral joint cartilage were defined as the mean of the patellar and trochlear compartment T2 values. Similarly, T2 values from the tibiofemoral joint were defined as the mean T2 values of the medial femoral, lateral femoral, medial tibial, and lateral tibial compartments. Compartment-wise comparisons between baseline and follow-up T2 of each individual study participant were performed with repeated measures analysis of variance. Differences between baseline and follow-up WORMS were determined by using the Wilcoxon signed rank test. A multiple linear regression model (10) was used to determine the association between longitudinal changes in T2 values and cartilage WORMS after adjusting for the effects of age, sex, BMI, and PASE score. Differences in T2 values and WORMS between different age groups were determined by using one-way analysis of variance. P < .05 was considered indicative of a statistically significant difference.
Results
Subject Characteristics at Baseline and Follow-up
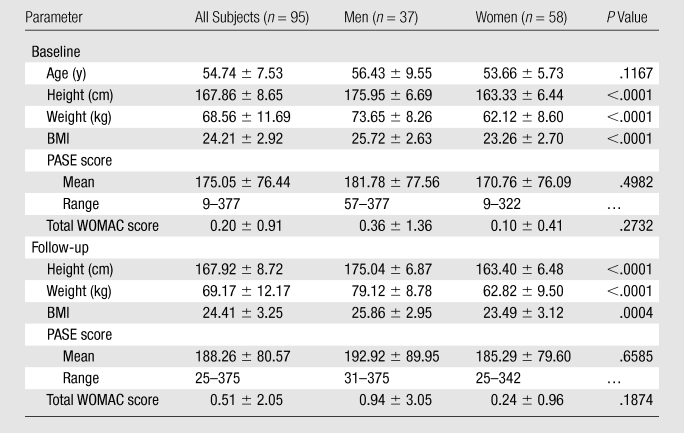
Table 1 shows baseline and follow-up characteristics, including age, height, weight, BMI, PASE scores, and total WOMAC scores, for all subjects. Although men had significantly higher values of height, weight, and BMI at both baseline and follow-up (P < .0001 for all three variables at baseline; P < .0001 for height and weight at follow-up; and P = .0004 for BMI at follow-up), there were no significant sex-related differences in age, PASE values, or total WOMAC scores at both time points. We then compared height, weight, BMI, PASE scores, and total WOMAC scores at baseline and follow-up by using paired t tests and did not detect a statistically significant difference in these variables over time (P = .32, .082, .12, .12, and .20, respectively). In addition, we performed post hoc power analyses for these nonsignificant findings. The power values for comparison of height, weight, BMI, PASE scores, and total WOMAC scores at baseline and follow-up were 0.95, 0.93, 0.92, 0.72, and 0.95, respectively.
Table 1.
Participant Characteristics at Baseline and 2-year Follow-up
Note.—Unless otherwise specified, data are means ± standard deviations.
Prevalence of Focal Knee Abnormalities
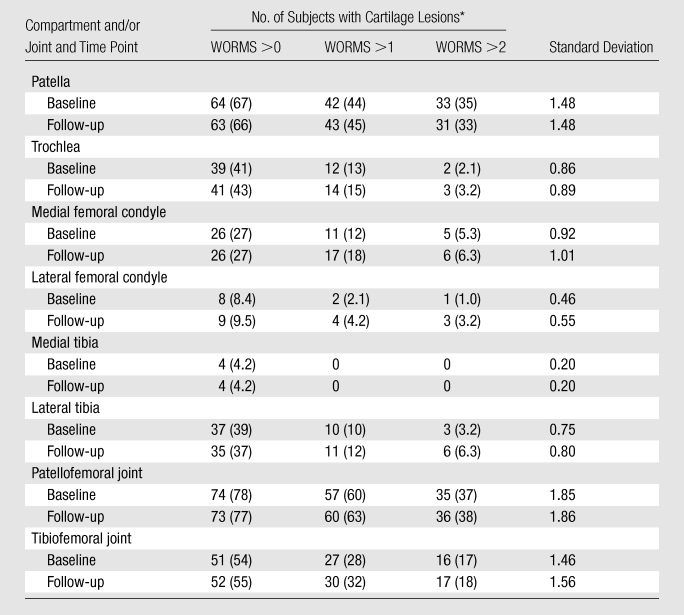
We identified a high prevalence of focal knee abnormalities in asymptomatic subjects free of risk factors for OA selected from the OAI normal control cohort, with 90% and 92% of subjects having at least one lesion at baseline and follow-up, respectively (Table 2). Among all structures analyzed, cartilage lesions had the highest prevalence, with 86% and 84% of subjects having at least one cartilage lesion (grade ≥1) at baseline and follow-up, respectively (Table 2). Except for joint effusion, the assessed lesions showed no statistically significant change in WORMS during the 2-year period. As shown in Table 3, the patellofemoral joint demonstrated a significantly higher prevalence of cartilage lesions, with 78%, 60%, and 37% of subjects having a cartilage summation WORMS of more than 0, 1, and 2, respectively, at baseline, as compared with 54%, 28%, and 17% for the tibiofemoral joint (P = .0001, .0001, and .0006, respectively). Among the six cartilage compartments analyzed, the patellar compartment had the highest prevalence of cartilage lesions, with 67% and 66% of subjects having at least one cartilage lesion at baseline and follow-up, respectively (Table 3).
Table 2.
Prevalence of Focal Knee Morphologic Abnormalities at 3-T MR Imaging as Evaluated with the Modified WORMS System
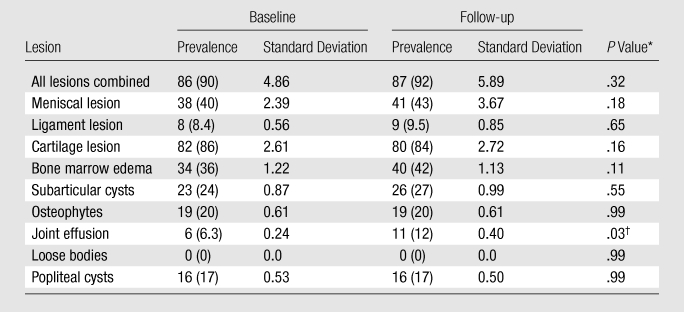
Note.—Data are numbers of subjects with at least one lesion, with percentages in parentheses. A lesion was considered present with WORMS >0.
Statistical significance was determined with the McNemar test.
Statistically significant.
Table 3.
Prevalence of Cartilage Lesions Detected at 3-T MR imaging
Data are numbers of subjects. Numbers in parentheses are percentages.
Longitudinal Changes in Cartilage T2 and WORMS
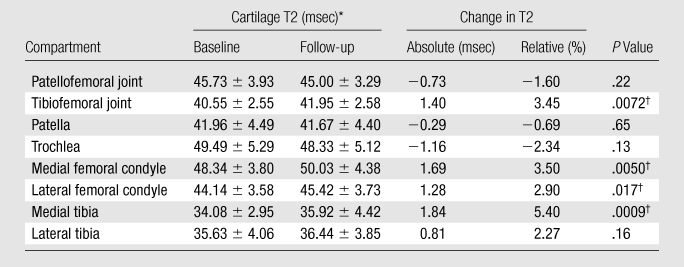
To investigate the evolution of cartilage T2 values during the 2-year period, we compared mean baseline cartilage T2 values in the patellofemoral and tibiofemoral joints with mean follow-up T2 values. Our data showed a significant longitudinal increase in mean cartilage T2 values in the tibiofemoral joint during the 2-year period (from 40.55 msec at baseline to 41.95 msec at follow-up, P = .0072) (Table 4). Conversely, no statistically significant difference was detected between baseline and follow-up T2 values in the patellofemoral joint (45.73 msec at baseline vs 45.0 msec at follow-up, P = .22). We then analyzed changes in T2 values in each individual cartilage compartment by using repeated measures analysis of variance. Medial femoral, lateral femoral, and medial tibial compartments showed a significant increase in T2 during the 2-year period (P = .005, .017, and .0009, respectively) (Table 4). Conversely, no significant change in T2 was noted within the patellar, trochlear, and lateral tibial compartments. We also determined the frequency of subjects with a clinically significant relative increase in T2 of individual cartilage compartments and all compartments combined over the 2-year period. A clinically significant relative increase in T2 was defined as a relative increase of more than 5%. Relative T2 increase was calculated as [(follow-up T2 − baseline T2)/baseline T2] × 100%. Twenty-two of the 95 subjects showed a relative increase of more than 5% in their total combined cartilage T2. In terms of individual cartilage compartments, both medial tibial and medial femoral compartments had the highest frequency of subjects with a T2 increase of more than 5% (40 of 95 subjects). A T2 increase of more than 5% was seen in the lateral tibial compartment in 36 subjects, lateral femoral compartment in 29, patellar compartment in 21, and trochlear compartment in 19.
Table 4.
Comparison of Mean Cartilage T2 at Baseline and 2-year Follow-up
Note.—A random effects model was used for patellofemoral and tibiofemoral joints, and repeated measures analysis of variance was used for individual compartments.
Data are means ± standard deviations.
Statistically significant.
We next compared baseline and follow-up summation WORMS and detected a significant increase over the 2-year period (6.23 at baseline vs 7.09 at follow-up, P = .0002) (Table 5). To determine if there was any interval change in specific focal abnormalities, we performed an exploratory analysis of various individual lesions (Table 5). We found that there was a significant longitudinal increase in WORMS for lesions in the meniscus (1.11 at baseline vs 1.49 at follow-up, P = .0029) and cartilage (3.28 at baseline vs 3.45 at follow-up, P = .0045) over the 2-year period. No loose bodies were identified at baseline or follow-up. No interval change was noted in WORMS for osteophytes or popliteal cysts. Results from the remaining lesions demonstrated a nonsignificant trend with subjects having higher WORMS at follow-up. In addition, our results showed that 37 of the 95 subjects had progression of morphologic changes over 2 years, as manifested by an increase in summation WORMS (change in WORMS >0). In terms of individual lesions investigated, cartilage lesions were seen with the highest frequency in subjects with progression (18 of 95 subjects), followed by bone marrow edema, subarticular cysts, and meniscal lesions (14, 12, and 10 of 95 subjects, respectively).
Table 5.
Comparison between WORMS at Baseline and Follow-up
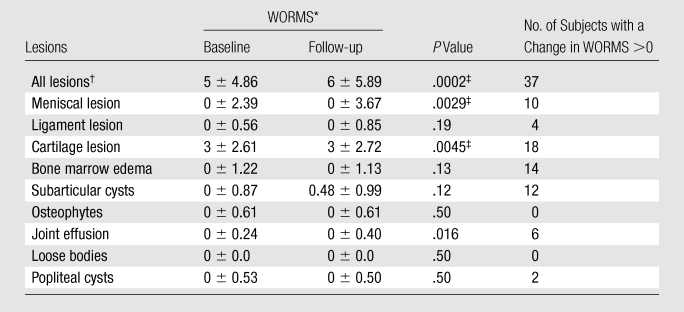
Data are medians ± standard deviations.
Data are summation scores.
Statistically significant at α = .05 (after Bonferroni correction for individual lesions).
We also examined differences in T2 values and WORMS among three age groups (45–54 years, 55–64 years, and ≥64 years). No significant difference in mean T2 scores of the patellofemoral and tibiofemoral joints was found among the three age groups. However, we identified a significant difference in summation WORMS at follow-up among different age groups (P = .034).
Relationship between Longitudinal Changes in Cartilage T2 and Changes in Knee Morphologic Abnormalities
We then studied the relationship between absolute longitudinal T2 changes (in all compartments combined, calculated by subtracting baseline T2 from follow-up T2) or relative longitudinal T2 changes ([absolute T2 change/baseline T2] × 100) and longitudinal changes in summation WORMS (follow-up summation WORMS − baseline summation WORMS) or longitudinal change in cartilage WORMS (follow-up cartilage WORMS − baseline cartilage WORMS) by using a multiple linear regression model after adjustment for age, sex, BMI, and PASE score (10). Our results showed that neither absolute nor relative T2 changes contributed significantly to correlation with the changes in summation WORMS (P = .27 and .24, respectively). However, both absolute and relative longitudinal T2 changes showed significant correlation to the longitudinal change in cartilage WORMS (P = .038 for both absolute and relative longitudinal T2 changes). Representative images showing a significant increase in the presence and severity of focal morphologic abnormalities in subjects with a significant increase in T2 over 2 years are presented in the Figure.
Figure a:
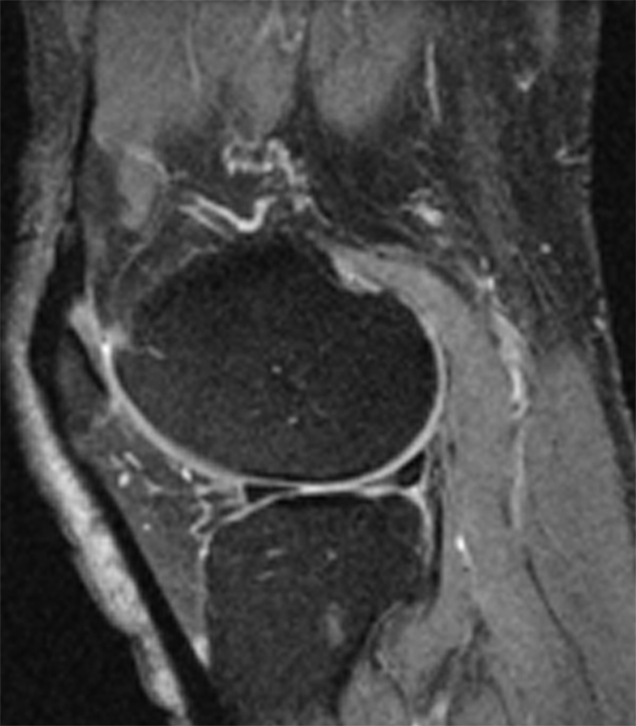
Representative MR images obtained at (a,c) baseline and (b, d) 2-year follow-up demonstrate interval progression of OA-related focal morphologic abnormalities. (a, b) Sagittal T2-weighted images obtained in a subject with a 5.1% increase in cartilage T2 over 2 years (all compartments combined, change in T2 = 1.96 msec) and a 24.5-point increase in summation WORMS. There was interval development of tearing of the posterior horn of the lateral meniscus (curved arrow in b), subchondral cyst in lateral tibial plateau (arrowhead in b), and joint effusion (straight arrow in b). The focal cartilage defect overlying the lateral tibial subchondral cyst also appeared worse in b than in a. (c, d) Transverse intermediate-weighted images from another subject with a 2.6% increase in cartilage T2 (change in T2 = 1.15 msec) and an eight-point increase in summation WORMS. At baseline (c), the patellar cartilage was essentially normal. However, there was interval development of signal heterogeneity in the lateral facet of the patellar cartilage at follow-up (arrow in d), which is suggestive of early degeneration. A trace joint effusion is also evident in d.
Figure b:
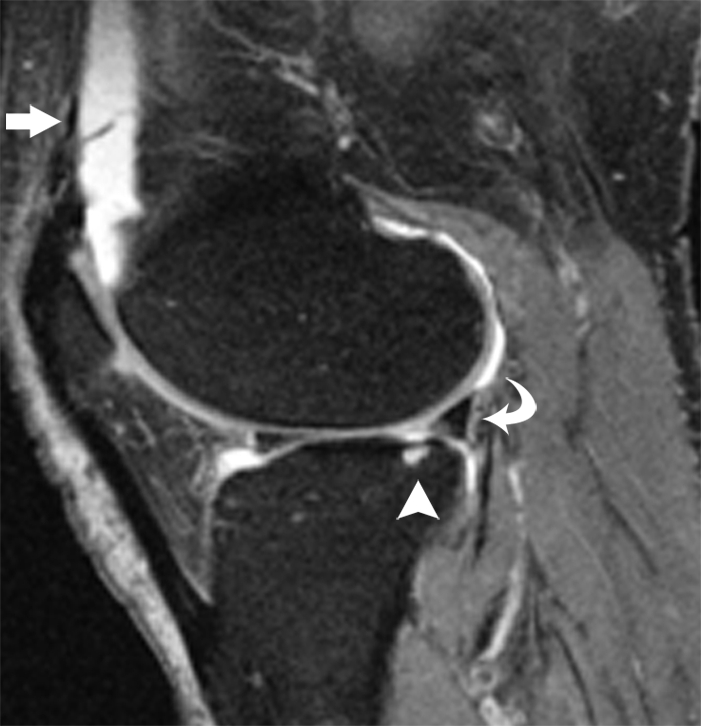
Representative MR images obtained at (a, c) baseline and (b, d) 2-year follow-up demonstrate interval progression of OA-related focal morphologic abnormalities. (a, b) Sagittal T2-weighted images obtained in a subject with a 5.1% increase in cartilage T2 over 2 years (all compartments combined, change in T2 = 1.96 msec) and a 24.5-point increase in summation WORMS. There was interval development of tearing of the posterior horn of the lateral meniscus (curved arrow in b), subchondral cyst in lateral tibial plateau (arrowhead in b), and joint effusion (straight arrow in b). The focal cartilage defect overlying the lateral tibial subchondral cyst also appeared worse in b than in a. (c, d) Transverse intermediate-weighted images from another subject with a 2.6% increase in cartilage T2 (change in T2 = 1.15 msec) and an eight-point increase in summation WORMS. At baseline (c), the patellar cartilage was essentially normal. However, there was interval development of signal heterogeneity in the lateral facet of the patellar cartilage at follow-up (arrow in d), which is suggestive of early degeneration. A trace joint effusion is also evident in d.
Figure c:
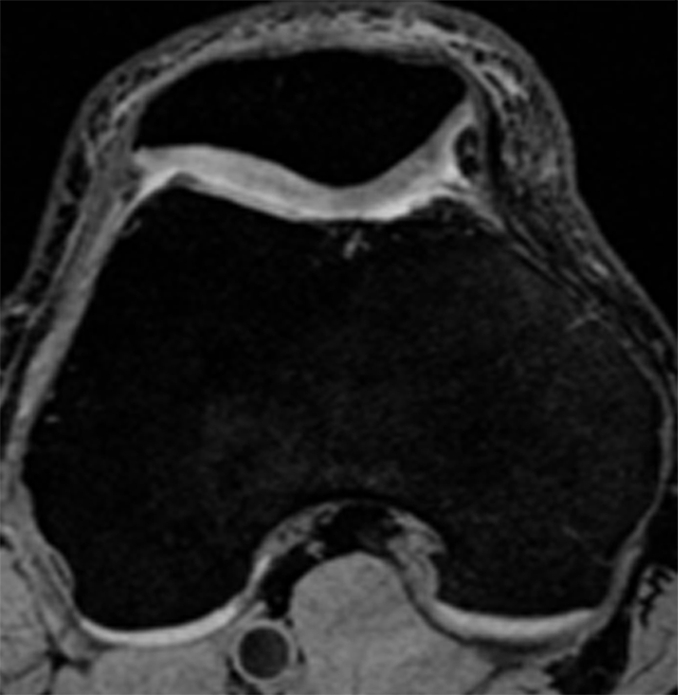
Representative MR images obtained at (a, c) baseline and (b, d) 2-year follow-up demonstrate interval progression of OA-related focal morphologic abnormalities. (a, b) Sagittal T2-weighted images obtained in a subject with a 5.1% increase in cartilage T2 over 2 years (all compartments combined, change in T2 = 1.96 msec) and a 24.5-point increase in summation WORMS. There was interval development of tearing of the posterior horn of the lateral meniscus (curved arrow in b), subchondral cyst in lateral tibial plateau (arrowhead in b), and joint effusion (straight arrow in b). The focal cartilage defect overlying the lateral tibial subchondral cyst also appeared worse in b than in a. (c, d) Transverse intermediate-weighted images from another subject with a 2.6% increase in cartilage T2 (change in T2 = 1.15 msec) and an eight-point increase in summation WORMS. At baseline (c), the patellar cartilage was essentially normal. However, there was interval development of signal heterogeneity in the lateral facet of the patellar cartilage at follow-up (arrow in d), which is suggestive of early degeneration. A trace joint effusion is also evident in d.
Figure d:
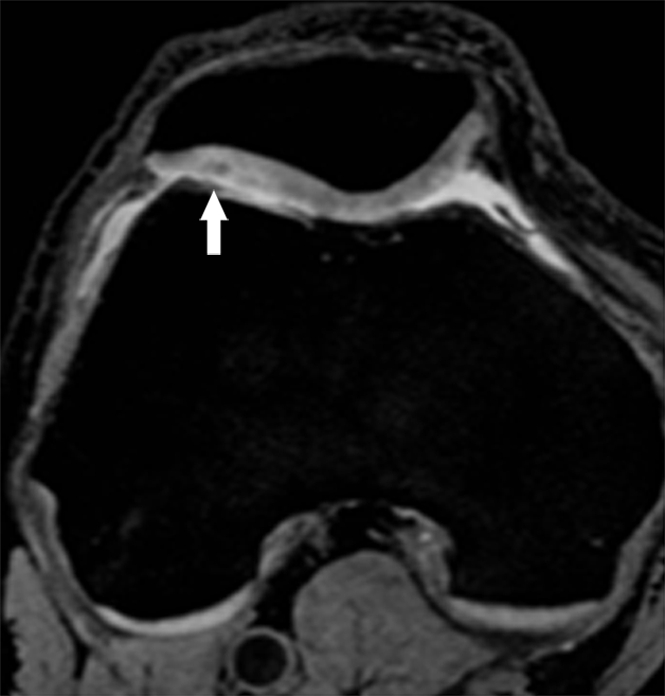
Representative MR images obtained at (a, c) baseline and (b, d) 2-year follow-up demonstrate interval progression of OA-related focal morphologic abnormalities. (a, b) Sagittal T2-weighted images obtained in a subject with a 5.1% increase in cartilage T2 over 2 years (all compartments combined, change in T2 = 1.96 msec) and a 24.5-point increase in summation WORMS. There was interval development of tearing of the posterior horn of the lateral meniscus (curved arrow in b), subchondral cyst in lateral tibial plateau (arrowhead in b), and joint effusion (straight arrow in b). The focal cartilage defect overlying the lateral tibial subchondral cyst also appeared worse in b than in a. (c, d) Transverse intermediate-weighted images from another subject with a 2.6% increase in cartilage T2 (change in T2 = 1.15 msec) and an eight-point increase in summation WORMS. At baseline (c), the patellar cartilage was essentially normal. However, there was interval development of signal heterogeneity in the lateral facet of the patellar cartilage at follow-up (arrow in d), which is suggestive of early degeneration. A trace joint effusion is also evident in d.
Reproducibility
The WORMS analysis (all lesions combined) interobserver agreement was 95.0%, and the intraobserver agreement was 95.7% and 96.7%. The interobserver agreement had a Cohen κ of 0.64, and the intraobserver agreements had Cohen κ values of 0.73 and 0.77, respectively. The coefficients of variation for T2 measurements (all compartments combined) were 1.12% and 1.08% for baseline and follow-up, respectively.
Discussion
Our results showed that asymptomatic individuals free of risk factors for OA from the OAI normal control subcohort had a high prevalence of focal knee morphologic abnormalities, particularly cartilage lesions, at 3-T MR imaging. We found a significant longitudinal increase in tibiofemoral cartilage T2 values in asymptomatic individuals and demonstrated that increased progression of cartilage abnormalities correlated with a greater increase in T2.
Multiple previous studies of the prevalence of OA (23–25) evaluated the presence and severity of OA primarily with use of the radiography-based Kellgren and Lawrence grading system (26), which is heavily dependent on osteophytes for classification of disease and suffers from its own limitations (eg, intrinsic insensitivity of radiographs to early OA change and the invalid assumptions that changes in radiographic features are linear over the course of the disease and that the relationship between these features is constant) (27,28). Conversely, MR imaging enables quantitative assessment of cartilage thickness and volume (4) and semiquantitative evaluation of various soft tissue features (3,29). A recent study demonstrated a high prevalence of OA-related cartilage and meniscal abnormalities in middle-aged, asymptomatic individuals with risk factors for OA (10). Our data suggest a high prevalence of OA-related focal knee abnormalities in asymptomatic subjects who are free of OA risk factors and who have normal knee radiographs. This is in keeping with findings of Guermazi et al (13), who suggested that MR imaging can depict OA abnormalities at a much earlier stage than conventional radiography.
Our results showed an asymmetric distribution of morphologic abnormalities, with the patellofemoral joint having a significantly higher prevalence of cartilage lesions than the tibiofemoral joint. It is interesting that, despite its high prevalence of morphologic abnormalities, the patellofemoral joint had a less significant increase in cartilage T2 values over 2 years as compared with the tibiofemoral joint. These findings may suggest that the patellofemoral joint may have a distinct mechanism of pathogenesis in OA compared with the tibiofemoral joint. Several previous studies have demonstrated that the patellar cartilage differs from the tibiofemoral cartilage in terms of biochemical and mechanical properties (30,31). Froimson et al (31) reported that, compared with the patellar cartilage, the femoral cartilage showed a higher proteoglycan content and compressive aggregate modulus and lower water content and permeability. The patellar cartilage was shown to demonstrate more in vivo deformation than the femoral and tibial cartilages with weight-bearing loaded activities (30). Our results are also in keeping with those of Friedrich et al (32), who demonstrated that cartilage T2 values in the medial compartment were significantly higher than those in the lateral compartment and that patients with varus alignment had significantly higher T2 values than those with valgus alignment, suggesting that joint alignment has an effect on T2 values.
Findings in several studies have shown that cartilage T2 is dependent on age (7). Previous cross-sectional studies involving asymptomatic volunteers demonstrated an age-related increase in knee cartilage T2 values (33), progressing from the superficial cartilage layer to the deep layer (34). Our results demonstrated a significant longitudinal increase in knee cartilage T2 in the tibiofemoral joint over a period of 2 years in asymptomatic individuals, further supporting the hypothesis that an increase in cartilage T2 values is associated with aging.
It has been suggested that the limited efficacy of various OA treatment strategies may be related to the presence of irreversible disease in a large number of preclinical and clinical OA trial participants (35). Therefore, the development of OA biomarkers for the identification of early, reversible cartilage changes will enable more accurate and cost-effective screening of potential disease and structure-modifying compounds. There is increasing evidence to suggest a significant correlation between cartilage T2 values and OA-related morphologic abnormalities. Previous studies have shown that femoral and tibial cartilage T2 values increased with increased severity of OA (6) and were significantly higher in patients with early knee OA than in asymptomatic control subjects (8). A recent study in middle-aged, asymptomatic individuals with risk factors for knee OA suggested that there was a significant association between patellar cartilage T2 and the prevalence of cartilage lesions (10).
A limitation of our study is that it was not designed to investigate whether a change in T2 is predicative of future progression of a focal cartilage defect. Instead, our results only suggest that the change in T2 correlated with worsening of cartilage morphologic changes. To understand the role of cartilage T2 change in predicting future cartilage degradation, a follow-up study with a cohort design is necessary. Another limitation of our study is that only subjects without knee pain or other OA symptoms were included. These individuals (aged 45–78 years) were somewhat atypical of the usual older population, which has a high prevalence of OA. Therefore, a selection bias in which subjects with particularly asymptomatic cartilage were included may exist.
In summary, our results showed a high prevalence of OA-related morphologic abnormalities, in particular cartilage lesions, in asymptomatic individuals free of risk factors for OA from the OAI normal control subcohort. A significant increase in cartilage T2 values in the tibiofemoral joint was noted over a 2-year period. A greater increase in cartilage T2 was found to correlate with an increase in the progression of cartilage abnormalities, suggesting that characterizing and monitoring the cartilage matrix integrity with longitudinal T2 measurements might enable identification of individuals at risk for the development of early OA before irreversible cartilage loss occurs.
Advances in Knowledge.
Asymptomatic individuals without risk factors for osteoarthritis had a high prevalence of focal morphologic abnormalities, particularly cartilage lesions.
A significant longitudinal increase in cartilage T2 values was seen in the tibiofemoral joint of asymptomatic subjects over a 2-year period.
Greater longitudinal T2 changes were associated with increased progression of focal cartilage lesions.
Implication for Patient Care.
A greater longitudinal increase in cartilage T2 was shown to correlate with increased progression of cartilage morphologic abnormalities.
Disclosures of Potential Conflicts of Interest: J.P. No potential conflicts of interest to disclose. J.B.P. No potential conflicts of interest to disclose. T.J. No potential conflicts of interest to disclose. D.K. No potential conflicts of interest to disclose. G.B.J. No potential conflicts of interest to disclose. M.C.N. No potential conflicts of interest to disclose. T.M.L. Financial activities related to the present article: none to disclose. Financial activities not related to the present article: received money for consultancy from GE Medical. Other relationships: none to disclose.
Acknowledgments
The OAI is a public-private partnership comprised of five contracts (N01-AR-2-2258, N01-AR-2-2259, N01-AR-2-2260, N01-AR-2-2261, N01-AR-2-2262) funded by the National Institutes of Health, a branch of the Department of Health and Human Services, and conducted by the OAI Study Investigators. Private funding partners include Pfizer, Novartis Pharmaceuticals, Merck Research Laboratories, and GlaxoSmithKline. Private sector funding for the OAI is managed by the Foundation for the National Institutes of Health. This manuscript has received the approval of the OAI Publications Committee based on a review of its scientific content and data interpretation.
Received November 11, 2010; revision requested December 20; revision received June 19, 2011; accepted June 23; final version accepted June 27.
Funding: This research was supported by the National Institutes of Health (grants N01-AR-2-2258, N01-AR-2-2259, N01-AR-2-2260, N01-AR-2-2261, and N01-AR-2-2262).
Abbreviations:
- BMI
- body mass index
- OA
- osteoarthritis
- OAI
- Osteoarthritis Initiative
- PASE
- Physical Activity Scale for the Elderly
- WOMAC
- Western Ontario and McMaster University
- WORMS
- whole-organ MR imaging score
References
- 1.Sweet MB, Thonar EJ, Immelman AR, Solomon L. Biochemical changes in progressive osteoarthrosis. Ann Rheum Dis 1977;36(5):387–398 [DOI] [PMC free article] [PubMed] [Google Scholar]
- 2.Lüsse S, Claassen H, Gehrke T, et al. Evaluation of water content by spatially resolved transverse relaxation times of human articular cartilage. Magn Reson Imaging 2000;18(4):423–430 [DOI] [PubMed] [Google Scholar]
- 3.Link TM, Steinbach LS, Ghosh S, et al. Osteoarthritis: MR imaging findings in different stages of disease and correlation with clinical findings. Radiology 2003;226(2):373–381 [DOI] [PubMed] [Google Scholar]
- 4.Eckstein F, Heudorfer L, Faber SC, Burgkart R, Englmeier KH, Reiser M. Long-term and resegmentation precision of quantitative cartilage MR imaging (qMRI). Osteoarthritis Cartilage 2002;10(12):922–928 [DOI] [PubMed] [Google Scholar]
- 5.Link TM, Stahl R, Woertler K. Cartilage imaging: motivation, techniques, current and future significance. Eur Radiol 2007;17(5):1135–1146 [DOI] [PubMed] [Google Scholar]
- 6.Dunn TC, Lu Y, Jin H, Ries MD, Majumdar S. T2 relaxation time of cartilage at MR imaging: comparison with severity of knee osteoarthritis. Radiology 2004;232(2):592–598 [DOI] [PMC free article] [PubMed] [Google Scholar]
- 7.Mosher TJ, Dardzinski BJ. Cartilage MRI T2 relaxation time mapping: overview and applications. Semin Musculoskelet Radiol 2004;8(4):355–368 [DOI] [PubMed] [Google Scholar]
- 8.Stahl R, Blumenkrantz G, Carballido-Gamio J, et al. MRI-derived T2 relaxation times and cartilage morphometry of the tibio-femoral joint in subjects with and without osteoarthritis during a 1-year follow-up. Osteoarthritis Cartilage 2007;15(11):1225–1234 [DOI] [PubMed] [Google Scholar]
- 9.Stahl R, Luke A, Ma CB, et al. Prevalence of pathologic findings in asymptomatic knees of marathon runners before and after a competition in comparison with physically active subjects—a 3.0 T magnetic resonance imaging study. Skeletal Radiol 2008;37(7):627–638 [DOI] [PubMed] [Google Scholar]
- 10.Stehling C, Liebl H, Krug R, et al. Patellar cartilage: T2 values and morphologic abnormalities at 3.0-T MR imaging in relation to physical activity in asymptomatic subjects from the osteoarthritis initiative. Radiology 2010;254(2):509–520 [DOI] [PMC free article] [PubMed] [Google Scholar]
- 11.Bellamy N. The WOMAC knee and hip osteoarthritis indices: development, validation, globalization and influence on the development of the AUSCAN hand osteoarthritis indices. Clin Exp Rheumatol 2005;23(5 Suppl 39):S148–S153 [PubMed] [Google Scholar]
- 12.Bellamy N, Buchanan WW, Goldsmith CH, Campbell J, Stitt LW. Validation study of WOMAC: a health status instrument for measuring clinically important patient relevant outcomes to antirheumatic drug therapy in patients with osteoarthritis of the hip or knee. J Rheumatol 1988;15(12):1833–1840 [PubMed] [Google Scholar]
- 13.Guermazi A, Hunter DJ, Roemer FW. Plain radiography and magnetic resonance imaging diagnostics in osteoarthritis: validated staging and scoring. J Bone Joint Surg Am 2009;91(Suppl 1):54–62 [DOI] [PubMed] [Google Scholar]
- 14.Washburn RA, Smith KW, Jette AM, Janney CA. The Physical Activity Scale for the Elderly (PASE): development and evaluation. J Clin Epidemiol 1993;46(2):153–162 [DOI] [PubMed] [Google Scholar]
- 15.Johansen KL, Painter P, Kent-Braun JA, et al. Validation of questionnaires to estimate physical activity and functioning in end-stage renal disease. Kidney Int 2001;59(3):1121–1127 [DOI] [PubMed] [Google Scholar]
- 16.Stibrant Sunnerhagen K. Circuit training in community-living “younger” men after stroke. J Stroke Cerebrovasc Dis 2007;16(3):122–129 [DOI] [PubMed] [Google Scholar]
- 17.Willén C, Grimby G. Pain, physical activity, and disability in individuals with late effects of polio. Arch Phys Med Rehabil 1998;79(8):915–919 [DOI] [PubMed] [Google Scholar]
- 18.Peterfy CG, Schneider E, Nevitt M. The osteoarthritis initiative: report on the design rationale for the magnetic resonance imaging protocol for the knee. Osteoarthritis Cartilage 2008;16(12):1433–1441 [DOI] [PMC free article] [PubMed] [Google Scholar]
- 19.Stehling C, Lane NE, Nevitt MC, Lynch J, McCulloch CE, Link TM. Subjects with higher physical activity levels have more severe focal knee lesions diagnosed with 3T MRI: analysis of a non-symptomatic cohort of the osteoarthritis initiative. Osteoarthritis Cartilage 2010;18(6):776–786 [DOI] [PMC free article] [PubMed] [Google Scholar]
- 20.Peterfy CG, Guermazi A, Zaim S, et al. Whole-organ magnetic resonance imaging score (WORMS) of the knee in osteoarthritis. Osteoarthritis Cartilage 2004;12(3):177–190 [DOI] [PubMed] [Google Scholar]
- 21.Glüer CC, Blake G, Lu Y, Blunt BA, Jergas M, Genant HK. Accurate assessment of precision errors: how to measure the reproducibility of bone densitometry techniques. Osteoporos Int 1995;5(4):262–270 [DOI] [PubMed] [Google Scholar]
- 22.Blumenkrantz G, Lindsey CT, Dunn TC, et al. A pilot, two-year longitudinal study of the interrelationship between trabecular bone and articular cartilage in the osteoarthritic knee. Osteoarthritis Cartilage 2004;12(12):997–1005 [DOI] [PubMed] [Google Scholar]
- 23.Centers for Disease Control and Prevention (CDC) Arthritis prevalence and activity limitations—United States, 1990. MMWR Morb Mortal Wkly Rep 1994;43(24):433–438 [PubMed] [Google Scholar]
- 24.Lane NE, Thompson JM. Management of osteoarthritis in the primary-care setting: an evidence-based approach to treatment. Am J Med 1997;103(6A):25S–30S [DOI] [PubMed] [Google Scholar]
- 25.Lawrence RC, Felson DT, Helmick CG, et al. Estimates of the prevalence of arthritis and other rheumatic conditions in the United States. Part II. Arthritis Rheum 2008;58(1):26–35 [DOI] [PMC free article] [PubMed] [Google Scholar]
- 26.The atlas of standard radiographs of arthritis. Rheumatology (Oxford) 2005;44(Suppl 4):iv46–iv72 [PubMed] [Google Scholar]
- 27.Guermazi A, Hayashi D, Crema MD, Roemer FW. Current trends in osteoarthritis imaging: an update from a radiological viewpoint. Eur Musculoskelet Rev 2010;5(1):30–35 [Google Scholar]
- 28.Hunter DJ. Insights from imaging on the epidemiology and pathophysiology of osteoarthritis. Radiol Clin North Am 2009;47(4):539–551 [DOI] [PubMed] [Google Scholar]
- 29.Roemer FW, Eckstein F, Guermazi A. Magnetic resonance imaging–based semiquantitative and quantitative assessment in osteoarthritis. Rheum Dis Clin North Am 2009;35(3):521–555 [DOI] [PubMed] [Google Scholar]
- 30.Eckstein F, Lemberger B, Gratzke C, et al. In vivo cartilage deformation after different types of activity and its dependence on physical training status. Ann Rheum Dis 2005;64(2):291–295 [DOI] [PMC free article] [PubMed] [Google Scholar]
- 31.Froimson MI, Ratcliffe A, Gardner TR, Mow VC. Differences in patellofemoral joint cartilage material properties and their significance to the etiology of cartilage surface fibrillation. Osteoarthritis Cartilage 1997;5(6):377–386 [DOI] [PubMed] [Google Scholar]
- 32.Friedrich KM, Shepard T, Chang G, et al. Does joint alignment affect the T2 values of cartilage in patients with knee osteoarthritis? Eur Radiol 2010;20(6):1532–1538 [DOI] [PMC free article] [PubMed] [Google Scholar]
- 33.Mosher TJ, Dardzinski BJ, Smith MB. Human articular cartilage: influence of aging and early symptomatic degeneration on the spatial variation of T2—preliminary findings at 3 T. Radiology 2000;214(1):259–266 [DOI] [PubMed] [Google Scholar]
- 34.Mosher TJ, Liu Y, Yang QX, et al. Age dependency of cartilage magnetic resonance imaging T2 relaxation times in asymptomatic women. Arthritis Rheum 2004;50(9):2820–2828 [DOI] [PubMed] [Google Scholar]
- 35.Bay-Jensen AC, Hoegh-Madsen S, Dam E, et al. Which elements are involved in reversible and irreversible cartilage degradation in osteoarthritis? Rheumatol Int 2010;30(4):435–442 [DOI] [PubMed] [Google Scholar]


