

Shutter-speed analysis of breast dynamic contrast-enhanced MR imaging data was found to produce 98.6% specificity at 100% sensitivity for a cohort of 92 suspicious lesions.
Abstract
Purpose:
To assess the accuracy of the shutter-speed approach compared with standard approach dynamic contrast material–enhanced magnetic resonance (MR) imaging pharmacokinetic analysis for breast cancer diagnosis.
Materials and Methods:
This study was approved by the institutional review board and was HIPAA compliant. Informed consent was obtained from 89 high-risk women (age range, 28–83 years) who had 92 suspicious lesions with negative findings at mammography (but visible at MR imaging). Each underwent a research dynamic contrast-enhanced MR imaging examination just prior to a clinical MR imaging–guided interventional procedure. Tumor region of interest (ROI) averaged and (for some) pixel-by-pixel dynamic contrast-enhanced time-course data, together with mean arterial input function, were subjected to serial standard and shutter-speed approach analyses to extract pharmacokinetic parameters, including rate constant for passive contrast reagent transfer between plasma and interstitium (Ktrans) and interstitial space volume fraction, or ve. Pathologic findings were used as reference standards. Diagnostic accuracy was assessed with receiver operating characteristic analyses.
Results:
The pathologic analyses revealed 20 malignant and 72 benign lesions. Positive predictive value of the institutional clinical breast MR imaging protocol was 22%. At 100% sensitivity, ROI-averaged shutter-speed approach Ktrans had significantly (P = .008) higher diagnostic specificity than standard approach Ktrans: 86.1% versus 77.8%. The difference in the ROI-averaged Ktrans parameter value, or ∆Ktrans (≡ Ktrans [shutter-speed approach] − Ktrans [standard approach]), had even higher specificity (88.9%). Combined use of ROI analysis and pixel-by-pixel mapping of ∆Ktrans achieved 98.6% specificity at 100% sensitivity.
Conclusion:
The use of the shutter-speed dynamic contrast-enhanced MR imaging method has the potential to improve breast cancer diagnostic accuracy and reduce putatively unnecessary biopsy procedures that yield benign pathologic findings.
© RSNA, 2011
Supplemental material: http://radiology.rsna.org/lookup/suppl/doi:10.1148/radiol.11102413/-/DC1
Introduction
Conventional x-ray mammography—standard for screening and diagnostic imaging—has a high false-positive fraction. Specificities have been reported in the range of 10%–64% (1–3). Approximately 8% of initial screenings have positive results, and approximately 10% of these that persist as a positive result after follow-up imaging (mostly mammographic and sonographic) are referred for invasive biopsy procedures (4–6). More than 70% of the latter lead to benign pathologic reports (4–6) and that has substantial undesirable consequences. These include the medical complications (morbidity) of pain, stress (7), and possible increased cancer risk (8), which contribute to suggestions that overall mammographic effectiveness is less than desired (9,10). The explicit (11,12) and hidden (morbidity) costs of unnecessary biopsies constitute a considerable burden.
With higher sensitivity in malignancy detection, breast magnetic resonance (MR) imaging is increasingly indicated for high-risk population screening, dense breast diagnosis, preoperative staging, therapy monitoring, and residual disease assessment (3,13–18). However, MR imaging is much more expensive than mammography, and as currently implemented, also has limited diagnostic accuracy and reproducibility (3,13,14,19–21). Specificities have been reported in the range of 37%–97% (3,19,20). Because of higher cost and generally inadequate specificity, the use of breast MR imaging as a follow-up imaging test after an initial positive result at mammographic screening has been limited. But, MR imaging is less costly than biopsy procedures (22,23). If its specificity was sufficient, it could substantially reduce unnecessary (benign result) biopsies, leading to reduced morbidity and cost savings.
Dynamic contrast material–enhanced MR imaging has become an important part of routine clinical breast MR imaging examination protocols. Typical clinical approaches to interpret breast dynamic contrast-enhanced MR imaging signal intensity time-course data are qualitative or empirically quantitative. The results are often dependent on the MR imager (magnetic field strength, vendor), data acquisition details (pulse sequence and parameters), contrast reagent dose and/or injection rate, and personnel skills. This contributes to limited breast MR imaging specificity and poor reproducibility (21). Fitting a pharmacokinetic model to signal intensity time-course data to extract tissue parameters, quantitative dynamic contrast-enhanced MR imaging (24,25), is a more desirable approach. These imaging biomarkers are physiologic quantities, in principle independent of the factors listed previously. The usual parameters are variants of a rate constant for passive contrast reagent transfer between plasma and interstitium (Ktrans) and the interstitial space volume fraction (ve) (the putative contrast reagent distribution volume). However, the commonly used standard approach (Tofts model [24]) for dynamic contrast-enhanced MR imaging data analysis demands that equilibrium transcytolemmal water exchange kinetics be treated as if infinitely fast, which is physically unreasonable and contrary to experimental results (26,27). In a study of two patient cohorts (six patients with lesions visible at mammography and 16 patients with lesions occult at mammography, all visible at MR imaging) (26,27), it was shown that this assumption caused pharmacokinetic parameter underestimation. For Ktrans, this is sizable for only malignant lesions and is a major source of the limited standard approach dynamic contrast-enhanced MR imaging specificity in benign and malignant breast disease discrimination (26,27) and of pharmacokinetic parameter dependence on contrast reagent dose and/or delivery rate (28).
The shutter-speed approach for dynamic contrast-enhanced MR imaging data analysis admits finite transcytolemmal water molecule exchange kinetics (29,30). Application of shutter-speed approach analyses to the same six- and 16-patient data indicated previously resulted in 100% specificity at 100% sensitivity for benign and malignant breast lesion discrimination (26,27). This success was found with the tumor region-of-interest (ROI)-averaged ΔKtrans biomarker (≡ Ktrans [shutter-speed approach] − Ktrans [standard approach]) obtained by analyzing each dynamic contrast-enhanced MR imaging time course separately with each approach. ΔKtrans appraises the only standard–shutter-speed difference, which is their treatment of intercompartmental water exchange kinetics.
The purpose of this study was to assess the accuracy of the shutter-speed approach compared with standard approach dynamic contrast-enhanced MR imaging analysis for breast cancer diagnosis.
Materials and Methods
Study Population
This study was approved by the institutional review board and was Health Insurance Portability and Accountability Act compliant. Written informed consent was obtained. The enrollment criteria required patients who were clinically scheduled for MR imaging–guided core-needle biopsy or preoperative needle localization procedures. These were high-risk patients who had been undergoing semiannual or annual clinical breast MR imaging examinations because of family history and/or BRCA1 or BRCA2 mutations with greater than 20% cumulative lifetime risk. From February 2007 to April 2009, a total of 89 women (mean age, 52 years; age range, 28–83 years) were recruited. During routine examinations with the institutional clinical diagnostic breast MR imaging protocol, 92 suspicious breast lesions that were negative at mammography (occult or insufficiently suspicious) were found in these patients (three patients with two lesions each). Results from 16 lesions have been previously reported (26,27). All the clinical imaging examination results (including from mammography and MR imaging) in these patients were reviewed by institutional breast radiologists. The clinical bilateral breast MR imaging protocol included precontrast high-spatial-resolution T2-weighted MR imaging with fat saturation and T1-weighted MR imaging without fat saturation and dynamic contrast-enhanced MR imaging with fat saturation. The sagittal dynamic contrast-enhanced MR imaging acquisition consisted of one precontrast image volume set and three to five postcontrast image volume sets (Table 1). The 92 lesions were clinically classified according to Breast Imaging Reporting and Data System (BI-RADS) 4 (suspicious; n = 83: 38 masses, 34 nonmasses, and 11 focus enhancements) or 5 (highly suggestive of malignancy; n = 9: seven masses and two nonmasses) categories on the basis of tumor morphology and qualitative contrast reagent enhancement kinetics evaluation. The latter was assessed with software (Confirma; Merge CAD, Bellevue, Wash) (31) to classify the lesion dynamic contrast-enhanced MR imaging signal intensity time-course shape as persistent, plateau, or washout. These findings led to referrals for MR imaging–guided interventional procedures. According to the clinical MR imaging examination interpretation reports, the median tumor diameter of this cohort was 7.5 mm, with a 3.0–45.0-mm range (3.0–16.6 mm for 91 lesions).
Table 1.
Clinical and Research Contrast-enhanced MR Imaging Acquisition Details
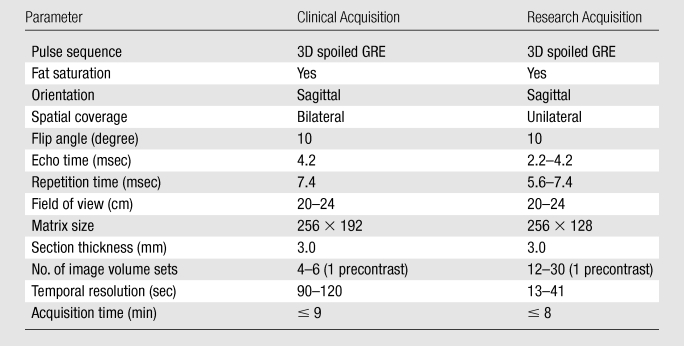
Note.—GRE = gradient-recalled echo. 3D = three dimensional.
Research Dynamic Contrast-enhanced MR Imaging Data Acquisition
Each research dynamic contrast-enhanced MR imaging data acquisition was obtained in the same session as the clinically scheduled MR imaging–guided core-needle biopsy or preoperative needle localization procedure (within 2 weeks of the clinical MR imaging examination), after the pilot acquisition, but just before needle insertion. As with the clinical examinations, the research acquisitions were obtained by using 1.5-T MR systems (Excite; GE Medical Systems, Milwaukee, Wis) with a body transmit and four- or seven-channel phased-array bilateral breast receive radiofrequency coils. The acquisition details are listed in Table 1. The imaging volume covered only the whole breast with the suspicious lesion(s) to undergo biopsy. At the start of the second volume set acquisition, gadopentetate dimeglumine (Magnevist; Berlex Laboratories, Wayne, NJ) contrast reagent was delivered intravenously (0.1 mmol per kilogram of body weight at 2 mL/sec) through an antecubital vein by using a programmable power injector, followed by a saline flush.
Research Dynamic Contrast-enhanced MR Imaging Data Analyses
The radiologist who performed the MR imaging–guided interventional procedure identified the lesion(s) to undergo biopsy on the research dynamic contrast-enhanced MR images. ROIs circumscribing the identified contrast-enhanced lesions and within an axillary artery (if clearly visible within the field of view) were drawn later by one of two authors (W.H. and S.B.T., with 9 and 6 years of experience in breast MR imaging and spectroscopy, respectively), producing the tumor 1H2O signal intensity and arterial input function time courses, respectively. Figure E1 (online) illustrates arterial input function ROI placement. Three individual arterial input functions were measured from data sets with high temporal resolution (two with 13 seconds and one with 16 seconds). They were interpolated with an empirical expression (29) and averaged to generate a mean arterial input function. It has been shown that it is feasible and practical to use a limited-population-based average arterial input function for pharmacokinetic analyses of dynamic contrast-enhanced MR imaging data from a larger population if the contrast reagent dose, injection rate, and injection site are kept the same (32,33). This was the case here. Each tumor ROI and mean arterial input function time-course pair was then subjected to separate standard approach and shutter-speed approach analyses (29,30) by one of three authors (W.H., S.B.T., and I.J.T. [3 years of experience]) who was blinded to pathologic results (Fig 1). The fast-exchange-regime-allowed shutter-speed approach approximation (26,27,29,34) was used. Besides Ktrans and ve, a third variable, mean intracellular water molecule lifetime (τi), was used in shutter-speed approach analyses to admit finite transcytolemmal water exchange kinetics. Contrast enhancement was observed in only one image section for 72 of 92 breast lesions and in two to three contiguous sections for the other 20 lesions. For the latter, the ROI parameter values from the image section with the largest ROI Ktrans (standard approach and shutter-speed approach) were reported. Pixel-by-pixel (within the ROI) pharmacokinetic analyses were retrospectively performed for data sets from 20 lesions that had ROI ΔKtrans values between 0.012 and 0.040 min−1, which was within approximately ±50% of the cutoff ΔKtrans value obtained from the smaller lesion cohort previously reported (26,27). The 20 data sets (from five malignant and 15 benign lesions) included one false-positive and one false-negative finding based on this cutoff value, which was also used for the larger population (see below). The pixel-by-pixel analyses were conducted to investigate if further discrimination of benign and malignant lesions could be achieved. The theory and mathematical formulations for standard approach and shutter-speed approach analyses of dynamic contrast-enhanced MR imaging time-course data obtained with a gradient-echo sequence have been described in great detail (26, 27, 29, 30).
Figure 1:

Contrast-enhanced sagittal fat-suppressed breast MR images (flip angle, 10°; echo time, 4.2 msec; repetition time, 7.4 msec) show, A, malignant invasive ductal carcinoma and ductal carcinoma in situ lesion in 48-year-old woman and, B, benign fibroadenoma in 54-year-old woman. C, D, Graphs show contrast-enhanced MR imaging time courses (●) for ROIs (yellow on A and B) circumscribing, C, malignant and, D, benign lesions. Mean arterial input function (the plasma contrast reagent concentration [CRp] time course) used in the analyses is in the inset of D. The contrast material injection timing is suggested by the rectangular function below the abscissa in D. The shape of the invasive ductal carcinoma and ductal carcinoma in situ ROI data in C is that often reported as characteristic of malignant tumors, faster and greater uptake (followed by washout) compared with a benign lesion such as that of D (34–36). There are two model-fitted curves associated with each lesion data set. Lower dashed curves = best fittings with the standard approach (SA)—constrained to the fast-exchange-limit. Solid curves = best fittings with the fast-exchange-regime-allowed shutter-speed approach (SSA). D, The two fitted curves are essentially superimposed for the benign lesion data (only the upper dashed curve is clearly visible). Underestimations of the Ktrans and ve values returned by using the standard approach fitting are 36% and 28%, respectively, compared with those returned by using the shutter-speed approach fitting (which yielded Ktrans = 0.28 min−1, ve = 0.86, and τi = 0.41 second) for the malignant lesion, and 0.7% and 24%, respectively, for the benign lesion (with shutter-speed approach fitting yielding Ktrans = 0.069 min−1, ve = 0.81, and τi = 0.64 second). The systematic mismatch between standard approach and shutter-speed approach fittings is generally greater, and underestimation of Ktrans by using the standard approach (relative to the shutter-speed approach) is generally larger, for the malignant tumor. This behavior is consistent with results previously reported (26,27,34). Upper dashed curves in C and D = standard approach expectation of the contrast-enhanced time course for the shutter-speed approach Ktrans and ve values in each case. This expectation comes closer to matching the data for the benign lesion.
To assess diagnostic accuracy, biopsy pathologic findings were used as reference standards in correlation analysis with research dynamic contrast-enhanced MR imaging results. There were 62 MR imaging–guided core-needle biopsies and 30 preoperative needle localization procedures. The latter led directly to excisional biopsies. If core-needle biopsy procedures were followed by excisional biopsies as standard care, because core-needle biopsy results revealed cancer or atypical pathologic result (such as atypical ductal hyperplasia), the pathologic results from the latter (available if performed in the same institution; n = 26) were used to correlate with MR imaging results.
Statistical Analysis
The full data set was used to determine the ROI pharmacokinetic parameter cutoff values that best separate benign and malignant lesions while affording 100% sensitivity. The specificities of the diagnostic tests on the basis of the respective cutoff values were calculated and compared between standard approach and shutter-speed approach for selected diagnostic markers by using the McNemar test with Yate correction for continuity. The ratio of false-positive fractions was calculated to evaluate relative probability of a false-positive response for any two markers (37), with confidence intervals computed by using asymptotic property of log (ratio of false-positive fractions). Receiver operating characteristic (ROC) curve analyses were conducted to assess the prediction accuracies of the diagnostic biomarkers. The areas under the curve were compared with a nonparametric test by using bootstrap methods with 1000 bootstrap samples (38). For lesion ROI ΔKtrans, the data from the smaller cohort previously reported (26,27) were considered a training set. The cutoff value at 0.027 min−1, which resulted in 100% sensitivity and 100% specificity in the training set, was used to calculate its corresponding sensitivity and specificity in this 92-lesion data set. Software (SAS, version 9.2; SAS Institute, Cary, NC) was used for all statistical analyses. All statistical tests were two-sided and conducted at statistical significance level of P equals .05.
Results
Standard and Shutter-Speed Approach Analyses of ROI Contrast-enhanced MR Imaging Time Courses
Figure 1 shows representative standard and shutter-speed approach fittings of dynamic contrast-enhanced MR imaging ROI time courses in a malignant (Fig 1, A and C) and a benign (Fig 1, B and D) lesion.
Correlation of Contrast-enhanced MR Imaging with Pathologic Findings
The pathologic analyses revealed that 20 lesions (12 BI-RADS 4 [eight masses, three nonmasses, and one focus] and eight BI-RADS 5 [six masses and two nonmasses]) were malignant, and 72 (71 BI-RADS 4 [30 masses, 31 nonmasses, and 10 foci] and one BI-RADS 5 [mass]) were benign (Tables 2 and E1 [online]). For this population, the institutional clinical breast MR imaging protocol had a positive predictive value for biopsy of 22% (20 of 92). The diameters of the malignant lesions (mean, 10.6 mm; range, 4.7–45.0 mm) were not statistically different (P = .25) from those of the benign lesions (mean, 8.0 mm; range, 3.0–16.6 mm).
Table 2.
Lesion Pathologic Findings
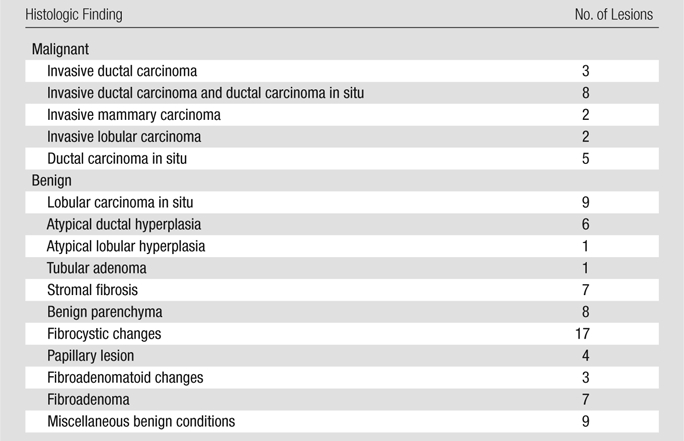
Figure 2 demonstrates that, going from the standard to the shutter-speed approach, the increases in ROI Ktrans values were substantially larger for malignant lesions than for benign lesions, providing better separation of the two groups. Values of ROI ΔKtrans (a measure of standard approach Ktrans underestimation, relative to the shutter-speed approach, thus exchange effects) of the malignant group were significantly (P = .03) greater than those of the benign group (Table E2 [online]). By using the ROI Ktrans value as an independent imaging biomarker binary classifier at 100% sensitivity, the shutter-speed approach analysis discriminated benign from malignant lesions significantly better than the standard approach analysis (P = .008), with a higher diagnostic specificity (86.1% [62 of 72] at a cutoff value of 0.095 min−1) than that of the standard approach analysis (77.8% [56 of 72] at a cutoff value of 0.072 min−1). The false-positive fraction for Ktrans (standard approach) was 1.8 times that of Ktrans (shutter-speed approach) (ratio of false-positive fractions = 1.8; 95% confidence interval: 1.16, 2.74). The shutter-speed approach ROI Ktrans, ve, and unidirectional contrast reagent intravasation rate constant (kep) (≡ Ktrans/ve,) parameter areas under the ROC curve were all significantly (P < .05) greater than their standard approach counterparts (Table 3). However, the small standard and shutter-speed approach ve areas under the curve indicated that ve is a poor diagnostic marker, as was the τi parameter (shutter-speed approach analysis only) with an area under the curve of 0.626. At 100% sensitivity, the specificities of ROI kep (standard approach) and kep (shutter-speed approach) were 47.2% (34 of 72) at a cutoff value of 0.15 min−1 and 62.5% (45 of 72) at a cutoff value of 0.12 min−1, respectively. The false-positive fraction of kep (standard approach) was 1.46 times that of kep (shutter-speed approach) (ratio of false-positive fractions = 1.46; 95% confidence interval: 1.18, 1.81).
Figure 2:

Scatterplot of lesion ROI-averaged standard approach (SA) and shutter-speed approach (SSA) Ktrans values. Straight lines connect data points from individual breast lesions. Outlier data point in the inset = shutter-speed approach Ktrans value of one malignant tumor.
Table 3.
Standard and Shutter-Speed Approach Pharmacokinetic Parameter Areas under the ROC Curve
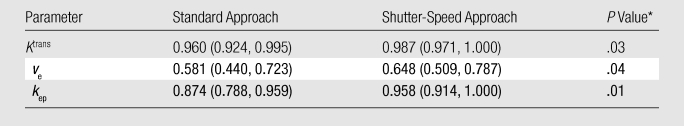
Note.—Data in parentheses are 95% confidence intervals of the estimated areas under the ROC curve.
Nonparametric test was used to assess the difference in areas under the curve between the standard approach and shutter-speed approach analysis.
The ROI ΔKtrans threshold at 0.027 min−1 resulted in 95.0% (19 of 20) sensitivity and 98.6% (71 of 72) specificity in this larger cohort (Fig 3). The only false-positive finding was the only tubular adenoma in this population, and the only false-negative finding was one of two invasive lobular carcinomas. Compared with ROI shutter-speed approach Ktrans at 100% sensitivity, ROI ΔKtrans provided an even higher (although not statistically significant, P = .25) specificity of 88.9% (64 of 72) at a cutoff value of 0.016 min−1. ROC plots of ROI Ktrans (standard approach), Ktrans (shutter-speed approach), and ΔKtrans have areas under the curve of 0.960, 0.987, and 0.992, respectively (Fig 4). The means and ranges of the tumor ROI standard and shutter-speed approach Ktrans, ve, kep, and τi (shutter-speed approach only) and ΔKtrans, ∆ve, and ∆kep parameters are listed in Table E2 (online) for the malignant and benign group comparisons. Both ∆ve and ∆kep are poor diagnostic markers, with areas under the ROC curve between 0.6 and 0.7.
Figure 3:

Scatterplot of lesion ROI-averaged ΔKtrans (≡ Ktrans [shutter-speed approach] − Ktrans [standard approach]). Each column = one pathologic category. These are ranked roughly in the order of decreasing mean ΔKtrans from left to right. Note the ordinate scale break. Because MR imaging and pathologic analyses were blinded, the axes are independent. Solid horizontal cutoff line at 0.027 min−1 = binary classifier value obtained from a smaller cohort (26,27). ADH = atypical ductal hyperplasia, ALH = atypical lobular hyperplasia, BP = benign parenchyma, DCIS = ductal carcinoma in situ, FA = fibroadenoma, FAC = fibroadenomatoid changes, FC = fibrocystic changes, IDC = invasive ductal carcinoma, ILC = invasive lobular carcinoma, IMC = invasive mammary carcinoma, LCIS = lobular carcinoma in situ, MBC = miscellaneous benign conditions, PL = papillary lesion, SF = stromal fibrosis, TA = tubular adenoma.
Figure 4:

ROC plots for tumor ROI-averaged Ktrans (standard approach [SA]), Ktrans (shutter-speed approach [SSA]), and ∆Ktrans. The false-positive fraction abscissa measures (1 − specificity), while the true-positive fraction ordinate measures sensitivity. The area under the curve is a statistical index of the imaging biomarker binary classifier diagnostic accuracy. The Ktrans (standard approach), Ktrans (shutter-speed approach), and ∆Ktrans areas under the curve are 0.960, 0.987, and 0.992, respectively.
Dynamic Contrast-enhanced MR Imaging Parametric Mapping
As a result of pixel-by-pixel analysis, the Ktrans (shutter-speed approach) and ΔKtrans maps (Fig 5) of the false-negative lesion (invasive lobular carcinoma) featured hot spots with values greater than 0.18 min−1 and greater than 0.10 min−1, respectively. The median of the upper quartile of the pixel ∆Ktrans histogram was approximately 0.25 min−1. Among the other 19 data sets that had pixel-by-pixel analyses, four malignant lesions and one benign tubular adenoma also displayed Ktrans (shutter-speed approach) and/or ΔKtrans map hot spots, while the other 14 benign lesions revealed no hot spots. Therefore, in the full 92-lesion population, with the exception of the benign tubular adenoma identified as malignant, all other lesions were correctly classified with the combined ROI and mapping and/or histographic analysis approach, improving the diagnostic accuracy to 98.6% specificity (71 of 72) at 100% sensitivity.
Figure 5:

False-negative ROI ∆Ktrans in a 4.5-cm invasive lobular carcinoma in 57-year-old woman. A, Sagittal contrast-enhanced MR breast image with an ROI circumscribing the contrast-enhanced lesion. Pixel-by-pixel Ktrans color maps within the ROI were generated by using, B, standard approach (SA) and, C, shutter-speed approach (SSA) analyses of contrast-enhanced MR imaging time-course data and were overlaid onto the anatomic image. D, ∆Ktrans map. Scale bars = 10 mm. Note only the Ktrans (shutter-speed approach) and ∆Ktrans maps show numerous hot spots (>0.18 and >0.10 min−1, respectively), and these are mostly in the posterior tumor rim region. Partial-volume averaging keeps the lesion ROI-averaged ∆Ktrans value below the threshold for this malignant tumor.
Discussion
Shutter-speed pharmacokinetic analyses of dynamic contrast-enhanced MR imaging data seemed to provide the long-sought combination of high sensitivity and specificity for breast cancer diagnosis. The combined use of the ROI-averaged ΔKtrans imaging biomarker as a binary classifier and Ktrans (shutter-speed approach) and/or ΔKtrans mapping yielded 98.6% specificity at 100% sensitivity in a cohort of 92 suspicious breast lesions. The low positive predictive value (22%) of the clinical MR imaging protocol for the same population is consistent with previously reported high-risk population MR imaging screening at the same institution (39). Furthermore, the dynamic contrast-enhanced MR imaging acquisitions used here provided by no means optimal data for pharmacokinetic analysis. The dynamic contrast-enhanced MR imaging time courses in this study were obtained as add-ons in protocols for routine clinical procedures. The acquisition parameters were dictated by other requirements in addition to those for dynamic contrast-enhanced imaging. For example, to prevent complete contrast reagent washout before the subsequent MR imaging–guided intervention, the dynamic contrast-enhanced MR imaging acquisition time was limited to less than 8 minutes. The dynamic contrast-enhanced temporal resolution was compromised to achieve adequate spatial resolution. Thus, the encouraging results from this population suggest the shutter-speed approach is rather robust toward data acquisition.
The ∆Ktrans biomarker (26,27) has two distinct advantages. First, it focuses precisely on the effects of finite transcytolemmal water exchange kinetics—the only difference between the shutter-speed and standard approach analyses. Second, many other systematic dynamic contrast-enhanced MR imaging parameter errors (due to, for example, arterial input function or precontrast T1 uncertainties) may be mostly or completely eliminated in the Ktrans subtraction (shutter-speed approach − standard approach), because these are common to both analyses. For cases with borderline ROI ΔKtrans values, dynamic contrast-enhanced MR imaging parametric mapping provides refined diagnostic information. The single false-negative lesion (invasive lobular carcinoma) based on the ROI ΔKtrans cutoff line was the largest (4.5 cm) tumor in this cohort—an outlier greater than twice as large as the next largest lesion. Its ΔKtrans map hot spot values were far above the cutoff line. It was the partial-volume averaging with the small ΔKtrans values in most of the anterior portion of the tumor that pulled the ROI ΔKtrans value below the line. Hot spot–based Ktrans (shutter-speed approach) and ΔKtrans plots (from histographic analyses) likely would show tighter data clustering and greater discrimination. In such plots, all points would certainly move up, but a reasonable expectation is that the malignant points would move up to a greater extent than the benign points, leading to increased separation. The dynamic contrast-enhanced MR imaging data signal-to-noise requirements for successful parametric mapping are more stringent (26,27). A recent meta-analysis study (40) shows that ΔKtrans threshold value is rather independent of population background, imager vendor (platform or software), acquisition, contrast reagent, and magnetic field strength. The sensitivity of dynamic contrast-enhanced MR imaging acquisition to exchange effects can be reduced by increasing flip angle and/or decreasing repetition time (27). When dynamic contrast-enhanced MR imaging exchange-sensitivity is absent, ∆Ktrans will be effectively zero for both malignant and benign tumors. The results here suggest that data acquisition schemes with decreased exchange-sensitivity (41,42) would diminish shutter-speed approach breast cancer diagnostic accuracy.
The pharmacokinetic analysis of dynamic contrast-enhanced MR imaging data mainly appraises vascular phenotypic properties. The Ktrans parameter is a measure of contrast reagent capillary extra- and intravasation kinetics (26,27). Although it has a small contribution from blood flow, it mainly reflects vessel wall contrast reagent permeability (43). It is expected that capillaries of malignant breast tumors have inherently larger Ktrans values than those of benign lesions if the former are more angiogenic. The differences in malignant and benign Ktrans values are not as pronounced in the standard compared with the shutter-speed approach analyses. The standard approach underestimates Ktrans (relative to the shutter-speed approach) substantially for only malignant tumors. This argues that the shutter-speed approach is closer to absolute accuracy. It has been known for more than 40 years that equilibrium transcytolemmal water exchange is not infinitely fast (27). The molecular bases for shutter-speed effects have been described (26): competitive water exchange chemical reactions are written therein, which explain why the effects of finite water exchange kinetics are manifested transiently during contrast reagent bolus passage. It is the resultant considerable upward correction in malignant tumor Ktrans value by using the shutter-speed approach analysis that provides the almost perfect specificity (98.6%). Furthermore, our parametric mapping results suggest that transient departures from fast-exchange-limit condition (ie, increased ΔKtrans) are often focal within a tumor ROI. Interestingly, the mean τi value of the malignant tumors was significantly (P = .008, Table E2 [online]) smaller than that of the benign tumors. 1/τi was recently found (44) to provide measure of cell membrane ion pump adenosine triphosphatase kinetics, a metabolic activity metric.
Currently, a benign pharmacokinetic parameter value would not prevent a spiculated lesion from biopsy. Radiologists make MR imaging interpretations from morphologic as well as qualitative or empirical kinetic patterns. However, incorporation of quantitative shutter-speed approach dynamic contrast-enhanced MR imaging into overall evaluation of breast MR imaging lesions may improve specificity and reduce unnecessary benign biopsies, especially for those BI-RADS 4 lesions that are suspicious but have no compelling features (such as spiculated or irregular masses or rim enhancement).
Although our results are promising, there were limitations to this study. The threshold cutoff values were determined from this particular lesion cohort, which may overestimate diagnostic accuracy obtainable in other populations. Accurate derivation of pharmacokinetic parameters from dynamic contrast-enhanced MR imaging data demands high data acquisition temporal resolution. By simulating degradation of data temporal resolution to mimic the 1–2-minute temporal resolution typical of many clinical breast dynamic contrast-enhanced MR imaging protocols, it has been shown that diagnostic accuracies of both standard and shutter-speed approaches decrease substantially (45). Conversely, increasing temporal resolution from that used here may further increase diagnostic accuracy (45). Another limitation was that this population includes high-risk patients with negative findings at mammography who did not undergo sonographic biopsy, but rather were referred for MR intervention. This may have biased our population.
In conclusion, shutter-speed analysis of breast dynamic contrast-enhanced MR imaging data was found to produce 98.6% specificity at 100% sensitivity for a cohort of 92 suspicious lesions. Incorporation of the shutter-speed approach dynamic contrast-enhanced MR imaging method in breast MR imaging examinations for high-risk population screening, or after positive mammographic or sonographic screening and diagnostic indications, has the potential to reduce unnecessary benign biopsies.
Advances in Knowledge.
Underestimation of the rate constant for passive contrast reagent transfer between plasma and interstitium, or Ktrans, parameter value by using standard approach pharmacokinetic analysis of dynamic contrast-enhanced MR imaging data, relative to shutter-speed approach analysis, is significantly (P = .03) larger in malignant than in benign breast tumors.
In a population of 92 tumors with negative findings at mammography (but visible at MR imaging), the shutter-speed approach pharmacokinetic analysis of dynamic contrast-enhanced MR imaging data has significantly greater breast cancer diagnostic accuracy than standard approach analysis: 86.1% versus 77.8% specificity (P = .008) at 100% sensitivity.
Implication for Patient Care.
For patients with lesions with negative findings at mammography (but visible at MR imaging) or patients with positive initial mammographic screening and follow-up mammographic or sonographic diagnostic imaging results, the shutter-speed approach contrast-enhanced MR imaging method may potentially be used to improve diagnostic accuracy and reduce putatively unnecessary biopsies that yield benign pathologic findings.
Disclosures of Potential Conflicts of Interest: W.H. Financial activities related to the present article: OHSU and author have a significant financial interest in DeltaPoint, a company that may have a commercial interest in the results of this research and technology. This potential individual and institutional conflict of interest has been reviewed and managed by OHSU. Financial activities not related to the present article: institution has OHSU patent pending (entitled Method and Apparatus Using Magnetic Resonance Imaging for Cancer Identification). Other relationships: none to disclose. L.A.T. No potential conflicts of interest to disclose. X.L. Financial activities related to the present article: OHSU and author have a significant financial interest in DeltaPoint, a company that may have a commercial interest in the results of this research and technology. This potential individual and institutional conflict of interest has been reviewed and managed by OHSU. Financial activities not related to the present article: institution has OHSU patent pending (entitled Method and Apparatus Using Magnetic Resonance Imaging for Cancer Identification). Other relationships: none to disclose. S.B.T. No potential conflicts of interest to disclose. Y.C. No potential conflicts of interest to disclose. E.A.M. No potential conflicts of interest to disclose. I.J.T. Financial activities related to the present article: OHSU and author have a significant financial interest in DeltaPoint, a company that may have a commercial interest in the results of this research and technology. This potential individual and institutional conflict of interest has been reviewed and managed by OHSU. Financial activities not related to the present article: institution has OHSU patent pending (entitled Method and Apparatus Using Magnetic Resonance Imaging for Cancer Identification). Other relationships: none to disclose. M.E.K. No potential conflicts of interest to disclose. W.D.R. Financial activities related to the present article: OHSU and author have a significant financial interest in DeltaPoint, a company that may have a commercial interest in the results of this research and technology. This potential individual and institutional conflict of interest has been reviewed and managed by OHSU. Financial activities not related to the present article: institution has OHSU patent pending (entitled Method and Apparatus Using Magnetic Resonance Imaging for Cancer Identification). Other relationships: none to disclose. J.A.K. No potential conflicts of interest to disclose. C.S.S. Financial activities related to the present article: none to disclose. Financial activities not related to the present article: none to disclose. Other relationships: author wrote U.S. patent application based on the pharmacokinetic analyses in this work but has formally assigned any royalties back to institution.
Supplementary Material
Acknowledgments
We thank Ralph Wynn, MD, Sandra Brennan, MD, and Jennifer Kaplan, MD, for lesion identification on research MR images and Charles Nyman and Thomas Mair for technical assistance.
Received December 8, 2010; revision requested February 10, 2011; revision received May 2; accepted May 25; final version accepted June 2.
Funding This research was supported by the National Institutes of Health (grants RO1 CA120861, RO1 NS040801, and RO1 EB000422).
Supported in part by the Memorial Sloan-Kettering Cancer Center Byrne Fund and the W. M. Keck Foundation.
Abbreviations:
- BI-RADS
- Breast Imaging Reporting and Data System
- kep
- unidirectional contrast reagent intravasation rate constant
- K trans
- rate constant for passive contrast reagent transfer between plasma and interstitium
- τi
- mean intracellular water molecule lifetime
- ROC
- receiver operating characteristic
- ROI
- region of interest
- ve
- interstitial space volume fraction
References
- 1.Kacl GM, Liu P, Debatin JF, Garzoli E, Caduff RF, Krestin GP. Detection of breast cancer with conventional mammography and contrast-enhanced MR imaging. Eur Radiol 1998;8(2):194–200 [DOI] [PubMed] [Google Scholar]
- 2.Feig SA. Decreased breast cancer mortality through mammographic screening: results of clinical trials. Radiology 1988;167(3):659–665 [DOI] [PubMed] [Google Scholar]
- 3.Sinha S, Sinha U. Recent advances in breast MRI and MRS. NMR Biomed 2009;22(1):3–16 [DOI] [PubMed] [Google Scholar]
- 4.Rosenberg RD, Yankaskas BC, Abraham LA, et al. Performance benchmarks for screening mammography. Radiology 2006;241(1):55–66 [DOI] [PubMed] [Google Scholar]
- 5.Yabroff KR, Ballard-Barbash R, Carney P, Barlow W. Evaluation of mammography performance in the United States: the Breast Cancer Surveillance Consortium. Semin Breast Dis 2007;10(2):89–101 [Google Scholar]
- 6.Carney PA, Abraham LA, Miglioretti DL, et al. Factors associated with imaging and procedural events used to detect breast cancer after screening mammography. AJR Am J Roentgenol 2007;188(2):385–392 [DOI] [PubMed] [Google Scholar]
- 7.Lang EV, Berbaum KS, Lutgendorf SK. Large-core breast biopsy: abnormal salivary cortisol profiles associated with uncertainty of diagnosis. Radiology 2009;250(3):631–637 [DOI] [PubMed] [Google Scholar]
- 8.Ashbeck EL, Rosenberg RD, Stauber PM, Key CR. Benign breast biopsy diagnosis and subsequent risk of breast cancer. Cancer Epidemiol Biomarkers Prev 2007;16(3):467–472 [DOI] [PubMed] [Google Scholar]
- 9.Jørgensen KJ, Gøtzsche PC. Overdiagnosis in publicly organised mammography screening programmes: systematic review of incidence trends. BMJ 2009;339:b2587. [DOI] [PMC free article] [PubMed] [Google Scholar]
- 10.Esserman L, Shieh Y, Thompson I. Rethinking screening for breast cancer and prostate cancer. JAMA 2009;302(15):1685–1692 [DOI] [PubMed] [Google Scholar]
- 11.Saslow D, Boetes C, Burke W, et al. American Cancer Society guidelines for breast screening with MRI as an adjunct to mammography. CA Cancer J Clin 2007;57(2):75–89 [DOI] [PubMed] [Google Scholar]
- 12.Poplack SP, Carney PA, Weiss JE, Titus-Ernstoff L, Goodrich ME, Tosteson ANA. Screening mammography: costs and use of screening-related services. Radiology 2005;234(1):79–85 [DOI] [PubMed] [Google Scholar]
- 13.Van Goethem M, Tjalma W, Schelfout K, Verslegers I, Biltjes I, Parizel P. Magnetic resonance imaging in breast cancer. Eur J Surg Oncol 2006;32(9):901–910 [DOI] [PubMed] [Google Scholar]
- 14.Bartella L, Smith CS, Dershaw DD, Liberman L. Imaging breast cancer. Radiol Clin North Am 2007;45(1):45–67 [DOI] [PubMed] [Google Scholar]
- 15.Rijnsburger AJ, Obdeijn IM, Kaas R, et al. BRCA1-associated breast cancers present differently from BRCA2-associated and familial cases: long-term follow-up of the Dutch MRISC Screening Study. J Clin Oncol 2010;28(36):5265–5273 [DOI] [PubMed] [Google Scholar]
- 16.Lehman CD, Isaacs C, Schnall MD, et al. Cancer yield of mammography, MR, and US in high-risk women: prospective multi-institution breast cancer screening study. Radiology 2007;244(2):381–388 [DOI] [PubMed] [Google Scholar]
- 17.Lehman CD, Gatsonis C, Kuhl CK, et al. MRI evaluation of the contralateral breast in women with recently diagnosed breast cancer. N Engl J Med 2007;356(13):1295–1303 [DOI] [PubMed] [Google Scholar]
- 18.Kuhl CK. The “coming of age” of nonmammographic screening for breast cancer. JAMA 2008;299(18):2203–2205 [DOI] [PubMed] [Google Scholar]
- 19.Drew PJ, Chatterjee S, Turnbull LW, et al. Dynamic contrast enhanced magnetic resonance imaging of the breast is superior to triple assessment for the pre-operative detection of multifocal breast cancer. Ann Surg Oncol 1999;6(6):599–603 [DOI] [PubMed] [Google Scholar]
- 20.Kelcz F, Santyr GE, Cron GO, Mongin SJ. Application of a quantitative model to differentiate benign from malignant breast lesions detected by dynamic, gadolinium-enhanced MRI. J Magn Reson Imaging 1996;6(5):743–752 [DOI] [PubMed] [Google Scholar]
- 21.Jansen SA, Shimauchi A, Zak L, et al. Kinetic curves of malignant lesions are not consistent across MRI systems: need for improved standardization of breast dynamic contrast-enhanced MRI acquisition. AJR Am J Roentgenol 2009;193(3):832–839 [DOI] [PMC free article] [PubMed] [Google Scholar]
- 22.Hadley RD. RBVS fee schedule: a plain-English guide—2009 edition. Rockville, Md: Part B News Group, 2009 [Google Scholar]
- 23.Liberman L, Feng TL, Dershaw DD, Morris EA, Abramson AF. US-guided core breast biopsy: use and cost-effectiveness. Radiology 1998;208(3):717–723 [DOI] [PubMed] [Google Scholar]
- 24.Tofts PS, Brix G, Buckley DL, et al. Estimating kinetic parameters from dynamic contrast-enhanced T(1)-weighted MRI of a diffusable tracer: standardized quantities and symbols. J Magn Reson Imaging 1999;10(3):223–232 [DOI] [PubMed] [Google Scholar]
- 25.Schabel MC, Morrell GR, Oh KY, Walczak CA, Barlow RB, Neumayer LA. Pharmacokinetic mapping for lesion classification in dynamic breast MRI. J Magn Reson Imaging 2010;31(6):1371–1378 [DOI] [PMC free article] [PubMed] [Google Scholar]
- 26.Huang W, Li X, Morris EA, et al. The magnetic resonance shutter speed discriminates vascular properties of malignant and benign breast tumors in vivo. Proc Natl Acad Sci U S A 2008;105(46):17943–17948 [DOI] [PMC free article] [PubMed] [Google Scholar]
- 27.Li X, Huang W, Morris EA, et al. Dynamic NMR effects in breast cancer dynamic-contrast-enhanced MRI. Proc Natl Acad Sci U S A 2008;105(46):17937–17942 [DOI] [PMC free article] [PubMed] [Google Scholar]
- 28.Zhou R, Pickup S, Yankeelov TE, Springer CS, Glickson JD. Simultaneous measurement of arterial input function and tumor pharmacokinetics in mice by dynamic contrast enhanced imaging: effects of transcytolemmal water exchange. Magn Reson Med 2004;52(2):248–257 [DOI] [PubMed] [Google Scholar]
- 29.Yankeelov TE, Rooney WD, Li X, Springer CS., Jr Variation of the relaxographic “shutter-speed” for transcytolemmal water exchange affects the CR bolus-tracking curve shape. Magn Reson Med 2003;50(6):1151–1169 [DOI] [PubMed] [Google Scholar]
- 30.Li X, Rooney WD, Springer CS., Jr A unified magnetic resonance imaging pharmacokinetic theory: intravascular and extracellular contrast reagents. Magn Reson Med 2005;54(6):1351–1359 [Published correction appears in Magn Reson Med 2006;55(5):1217.] [DOI] [PubMed] [Google Scholar]
- 31.Williams TC, DeMartini WB, Partridge SC, Peacock S, Lehman CD. Breast MR imaging: computer-aided evaluation program for discriminating benign from malignant lesions. Radiology 2007;244(1):94–103 [DOI] [PubMed] [Google Scholar]
- 32.Parker GJ, Roberts C, Macdonald A, et al. Experimentally-derived functional form for a population-averaged high-temporal-resolution arterial input function for dynamic contrast-enhanced MRI. Magn Reson Med 2006;56(5):993–1000 [DOI] [PubMed] [Google Scholar]
- 33.Wang Y, Huang W, Panicek DM, Schwartz LH, Koutcher JA. Feasibility of using limited-population-based arterial input function for pharmacokinetic modeling of osteosarcoma dynamic contrast-enhanced MRI data. Magn Reson Med 2008;59(5):1183–1189 [DOI] [PMC free article] [PubMed] [Google Scholar]
- 34.Li X, Huang W, Yankeelov TE, Tudorica A, Rooney WD, Springer CS., Jr Shutter-speed analysis of contrast reagent bolus-tracking data: preliminary observations in benign and malignant breast disease. Magn Reson Med 2005;53(3):724–729 [DOI] [PubMed] [Google Scholar]
- 35.Kuhl CK, Mielcareck P, Klaschik S, et al. Dynamic breast MR imaging: are signal intensity time course data useful for differential diagnosis of enhancing lesions? Radiology 1999;211(1):101–110 [DOI] [PubMed] [Google Scholar]
- 36.Daniel BL, Yen YF, Glover GH, et al. Breast disease: dynamic spiral MR imaging. Radiology 1998;209(2):499–509 [DOI] [PubMed] [Google Scholar]
- 37.Pepe MS. The statistical evaluation of medical tests for classification and prediction. New York, NY: Oxford University Press, 2003; 28 [Google Scholar]
- 38.Gonen M. Analyzing receiver operating characteristic curves with SAS. Cary, NC: SAS Institute, 2007; 33 [Google Scholar]
- 39.Morris EA, Liberman L, Ballon DJ, et al. MRI of occult breast carcinoma in a high-risk population. AJR Am J Roentgenol 2003;181(3):619–626 [DOI] [PubMed] [Google Scholar]
- 40.Springer CS, Tudorica LA, Li X, et al. Meta-population breast cancer screening with the ΔKtrans DCE-MRI parameter (abstr). In: Proceedings of the Nineteenth Meeting of the International Society for Magnetic Resonance in Medicine. Berkeley, Calif: International Society for Magnetic Resonance in Medicine, 2011; 3097 [Google Scholar]
- 41.Buckley DL, Kershaw LE, Stanisz GJ. Cellular-interstitial water exchange and its effect on the determination of contrast agent concentration in vivo: dynamic contrast-enhanced MRI of human internal obturator muscle. Magn Reson Med 2008;60(5):1011–1019 [DOI] [PubMed] [Google Scholar]
- 42.Bains LJ, McGrath DM, Naish JH, et al. Tracer kinetic analysis of dynamic contrast-enhanced MRI and CT bladder cancer data: a preliminary comparison to assess the magnitude of water exchange effects. Magn Reson Med 2010;64(2):595–603 [DOI] [PubMed] [Google Scholar]
- 43.Li X, Springer CS, Jr, Jerosch-Herold M. First-pass dynamic contrast-enhanced MRI with extravasating contrast reagent: evidence for human myocardial capillary recruitment in adenosine-induced hyperemia. NMR Biomed 2009;22(2):148–157 [DOI] [PubMed] [Google Scholar]
- 44.Zhang Y, Poirier-Quinot M, Springer CS, Balschi JA. Nano-osmotic coupling in active cell membrane water permeability (abstr). In: Proceedings of the Nineteenth Meeting of the International Society for Magnetic Resonance in Medicine. Berkeley, Calif: International Society for Magnetic Resonance in Medicine, 2011; 3457 [Google Scholar]
- 45.Tagge IJ, Li X, Tudorica LA, et al. Effects of temporal resolution on breast cancer diagnostic accuracy by quantitative dynamic contrast-enhanced MRI (abstr). In: Proceedings of the Eighteenth Meeting of the International Society for Magnetic Resonance in Medicine. Berkeley, Calif: International Society for Magnetic Resonance in Medicine, 2010; 4748 [Google Scholar]
Associated Data
This section collects any data citations, data availability statements, or supplementary materials included in this article.