Abstract
Motivation: Gene expression profiling has shown great potential in outcome prediction for different types of cancers. Nevertheless, small sample size remains a bottleneck in obtaining robust and accurate classifiers. Traditional supervised learning techniques can only work with labeled data. Consequently, a large number of microarray data that do not have sufficient follow-up information are disregarded. To fully leverage all of the precious data in public databases, we turned to a semi-supervised learning technique, low density separation (LDS).
Results: Using a clinically important question of predicting recurrence risk in colorectal cancer patients, we demonstrated that (i) semi-supervised classification improved prediction accuracy as compared with the state of the art supervised method SVM, (ii) performance gain increased with the number of unlabeled samples, (iii) unlabeled data from different institutes could be employed after appropriate processing and (iv) the LDS method is robust with regard to the number of input features. To test the general applicability of this semi-supervised method, we further applied LDS on human breast cancer datasets and also observed superior performance. Our results demonstrated great potential of semi-supervised learning in gene expression-based outcome prediction for cancer patients.
Contact: bing.zhang@vanderbilt.edu
Supplementary Information: Supplementary data are available at Bioinformatics online.
1 INTRODUCTION
A major challenge in clinical cancer research is the prediction of prognosis at the time of tumor discovery. Accurate outcome prediction can help guide the selection of appropriate therapy for each individual patient. For example, if patients can be accurately assigned to a ‘low-risk’ or a ‘high-risk’ subgroup based on whether the disease would relapse within a certain amount of time after tumor resection, adjuvant chemotherapy (CTX) can be administered to high-risk patients, while low-risk patients might forgo this toxic treatment. Microarray-based gene expression profiling has showed great potential in outcome prediction for different types of cancers (Bild et al., 2006; Chibon et al., 2010; Crijns et al., 2009; Gentles et al., 2010; Goetz et al., 2007; Kim et al., 2009; Mok et al., 2009; Salazar et al., 2011; Sotiriou and Pusztai, 2009; Sotiriou et al., 2006; Stratford et al., 2010; Sun et al., 2008; van de Vijver et al., 2002; Wang et al., 2005). Nevertheless, small sample size remains a bottleneck in obtaining robust and accurate prediction models (Dupuy and Simon, 2007; Ein-Dor et al., 2006). The number of samples in microarray-based cancer studies is usually small because microarray experiments are time consuming, expensive and limited by sample availability. For outcome prediction, sample size is further reduced significantly by the availability of follow-up data for the analyzed samples. In fact, in publicly available gene expression databases such as the Gene Expression Omnibus (GEO), only a small fraction of human-tumor gene expression datasets provide clinical follow-up data.
Gene-expression data-based outcome prediction usually relies on traditional supervised learning techniques, in which only labeled data (i.e. data from samples with clinical follow-up) can be used for learning, while unlabeled data (i.e. data from samples without clinical follow-up) are disregarded. Recent studies in machine learning suggest that unlabeled data, when used in conjunction with limited amount of labeled data, can produce considerable improvement in learning accuracy, a technique called semi-supervised learning (Chapelle et al., 2008). Indeed, semi-supervised learning has proved to be effective in solving different biological problems including protein classification (Weston et al., 2005), peptide identification in shotgun proteomics (Kall et al., 2007), prediction of transcription factor–gene interaction (Ernst et al., 2008) and gene expression-based cancer subtype discovery (Bair and Tibshirani, 2004; Koestler et al., 2010; Steinfeld et al., 2008). Because semi-supervised learning is able to use a large number of unlabeled microarray data in conjunction with some labeled data, we hypothesize that this technique can be used to improve gene expression-based classification of human cancer.
Different algorithms for semi-supervised classification have been proposed (Belkin and Niyogi, 2004; Blum and Mitchell, 1998; Chapelle and Zien, 2005; Chapelle et al., 2008; Johnson and Zhang, 2007; Rigollet, 2007; Wang and Shen, 2007), and many successful algorithms directly or indirectly rely on the assumption that the decision boundary should not cross high density regions but lie in low density regions (usually called ‘cluster assumption’). This can be illustrated by comparing the well-known support vector machines (SVM) to its semi-supervised extension, Transductive SVM (TSVM) (Joachims, 1999). The goal of a standard SVM is to maximize the margin around the decision boundary of the labeled data to enable robust classification. In a TSVM, in addition to the original goal of SVM, unlabeled data are used to guide the boundary away from dense regions by finding a hyperplane that is far away from the unlabeled data points. Finding the exact TSVM solution is NP-hard. Therefore, several approximation algorithms have been proposed (Chen and Wang, 2011; Kulis et al., 2009; Mallapragada et al., 2009; Mann and McCallum, 2010; Sugiyama et al., 2010; Xiang et al., 2010; Xu et al., 2010).
In this article, we aimed to develop and evaluate semi-supervised classifiers for human cancers based on one of the most successful semi-supervised classification method, low density separation (LDS) (Chapelle and Zien, 2005). We started with the prediction of relapse-free survival for Stage I through III colorectal cancer (CRC) patients based on gene expression profiles of primary tumors. Colorectal carcinoma is the third most commonly occurring noncutaneous carcinoma and the second leading cause of cancer-related deaths in the USA. Although clinical trials have showed clear benefit of adjuvant CTX for Stage III patients, 40–44% of Stage III patients enrolled in ‘surgery-only’ groups did not recur in 5 years even without adjuvant treatment. On the other hand, while clinical trials have failed to show the benefit of adjuvant CTX when applied to unselected Stage II patients, some studies suggest that a subset of high-risk Stage II patients may benefit from adjuvant therapy. Moreover, although the standard treatment for Stage I patients requires no adjuvant treatment after surgery, about 10% of Stage I cancer will recur (Gray et al., 2007; Lu et al., 2009). Therefore, an accurate and reliable method that identifies high-risk Stages I and II patients and low-risk Stage III patients could improve the selection of individualized therapy.
Using five CRC gene expression datasets from the GEO database, we demonstrated that, (i) Semi-supervised classification improved prediction accuracy as compared with the state of the art supervised method SVM, (ii) performance gain increased with the number of unlabeled samples, (iii) unlabeled data from different institutes could be employed after appropriate processing and (iv) the LDS method is robust with regard to the number of input features. To test the general applicability of the semi-supervised method, we further applied it on human breast cancer datasets and demonstrated superior accuracy as compared with SVM.
2 METHODS
2.1 Gene expression datasets
Five CRC gene expression datasets were downloaded from the GEO database (Table 1). Stage IV samples were excluded from this study. Overlapping samples in GSE17536 and GSE14333 were removed from GSE14333. Remaining samples were assigned to the ‘recurrence’ group if recurrence was observed within 5 years of follow-up and the ‘nonrecurrence’ group if recurrence was not observed within 5 years of follow-up. Samples with insufficient or no clinical follow-up data were assigned to the ‘unlabeled’ group. Distribution of samples in these three groups is listed in Table 1 for each dataset. In this study, part or all of labeled samples from GSE17536 in combination with varied numbers of unlabeled samples were used for training, whereas the labeled samples from GSE14333 were used for independent validation.
Table 1.
Microarray datasets for classifier development and validation
| Tissue | GEO ID | No. of labeled samplesa | No. of unlabeled samples | No. of probe sets after filtering |
|---|---|---|---|---|
| CRC | GSE17536 | 66 (30 +1, 36 −1) | 72 | 26 790 |
| CRC | GSE14333 | 23 (12 +1, 11 −1) | 26 790 | |
| CRC | GSE13294 | 155 | 26 790 | |
| CRC | GSE18105 | 77 | 26 790 | |
| CRC | GSE2109 | 292 | 26 790 | |
| Breast | GSE2034 | 275 (95 +1, 180 −1) | 10 918 | |
| Breast | GSE2990 | 158 (43 +1, 115 −1) | 10 918 | |
| Breast | GSE20271 | 178 | 10 918 |
arecurrence +1, nonrecurrence −1.
Two breast cancer gene expression datasets were downloaded from GEO and the samples were classified into the ‘recurrence’ and ‘non-recurrence’ groups as described above (Table 1). Semi-supervised classifiers were built based on GSE2034 through randomly removing labels from different proportions of samples and then tested on the independent GSE2990 dataset.
All CRC datasets were generated on the Affymetrix U133 plus 2.0 array, whereas the three breast cancer datasets were generated on the Affymetrix U133A array. Cel files for the datasets were processed using MAS5 followed by quantile normalization. Training and validation datasets were processed separately to ensure the independency of the validation datasets. For training datasets, probe sets were first ranked based on average gene expression value and the bottom 30% with the lowest values were eliminated to rule out genes that were likely to be unexpressed. Remaining probe sets were ranked based on coefficient of variance and the bottom 30% were eliminated to remove genes with very low variation. To make expression level comparable across genes, expression values for each gene were standardized using a z-score transformation.
2.2 Low density separation approach
The LDS algorithm is based on the cluster assumption. It implements two effective procedures to place the decision boundary in low density regions between clusters. First, it derives graph-based distances that emphasize low density regions. Second, it uses a gradient descent approach to optimize the TSVM objective function in order to find a decision boundary that avoids high density regions. By combining these two procedures, LDS achieves clearly superior accuracy compared to the supervised method SVM and other state of the art semi-supervised methods on several test datasets (Chapelle and Zien, 2005). More details of the LDS algorithm can be found in the original article (Chapelle and Zien, 2005).
2.3 Evaluation of LDS and SVM predictions
A Matlab implementation available from http://olivier.chapelle.cc/lds was used for LDS and an R implementation of a Library for Support Vector Machine (LIBSVM) available in the e1071 package was used for SVM. SVM has two parameters C and γ, where C is the soft margin parameter and γ is the parameter for the radial basis kernel function. LDS has several parameters, but we only considered two most critical ones C and ρ, where C is the soft margin parameter and ρ is a softening parameter for graph distance computation. Default values were used for other parameters. For the parameters to be tuned, we let each of them vary among the candidate set {10−3, 10−2, 10−1, 10−0, 101, 102} to form different parameter combinations. Each combination of parameter choices was evaluated using stratified 5-fold cross-validation, and the parameters with best cross-validation AUC [the Area under the Receiver Operating Characteristic (ROC) Curve] were identified. The final classifier model was then trained on the whole training set using the optimal parameters, tested on the independent validation dataset, and evaluated based on both AUC and accuracy.
3 RESULTS
3.1 Overview of the semi-supervised classifier development and evaluation workflow
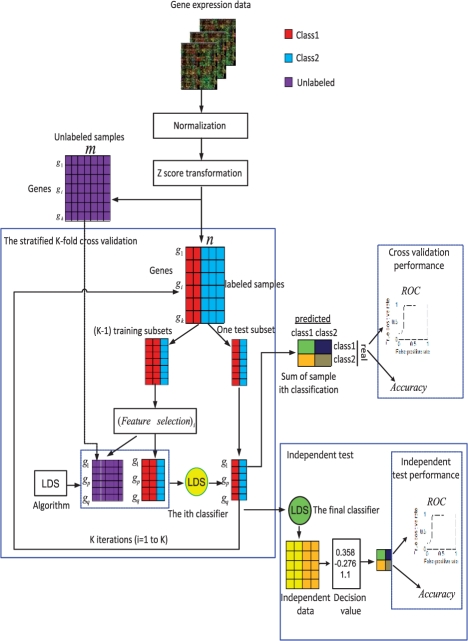
Figure 1 illustrates the overview of the semi-supervised classifier development and evaluation workflow. Microarray gene expression data on a specific cancer type are collected, processed and separated into labeled samples and unlabeled samples. A stratified K-fold cross-validation is used for classifier development. Specifically, the labeled samples are randomly partitioned into K subsets, with each subset containing roughly the same proportions of the two types of class labels. Of the K subsets, a single subset is retained as a temporary test subset and the remaining K−1 subsets are used as a temporary training set. On the training set, a feature selection method is used to select a group of outcome-related genes. Although different methods can be used for feature selection, the most commonly used method, t-test, was employed in this study. Data on selected genes for samples in the training set is combined with those for unlabeled samples and used to parameterize the LDS classification algorithm. The parameterized classifier (yellow circle) is then used to classify samples in the test subset. The cross-validation process is then repeated K times, with each of the K subsets used exactly once as the test subset. The K results from the subsets then can be combined to produce a single estimation. Fully developed classifier (green circle) based on the optimal parameters identified by the cross-validation process is then validated by an independent dataset. The performance is evaluated based on both accuracy and AUC.
Fig. 1.
Workflow for the development and evaluation of the semi-supervised low density separation (LDS) classifier. Gene expression data are collected, normalized, z-score transformed, and then separated into labeled data and unlabeled data. A stratified K-fold cross-validation is used for classifier development. Features are selected based on labeled data, whereas LDS classifier is developed by combining labeled and unlabeled data. Fully developed classifier based on the optimal parameters identified in cross-validation is then evaluated in an independent dataset.
3.2 Integrating unlabeled data from the same dataset improves prediction performance
In a cancer gene expression dataset, it is common that only some of the samples have sufficient clinical follow-up data and others are unlabeled with regard to the clinical question of interest. Therefore, we first investigated whether integrating unlabeled data from the same dataset could improve prediction performance using 5-year relapse-free survival in CRC as an example. GSE17536 was used for classifier development, in which 66 samples were labeled (30 recurrence and 36 nonrecurrence) and 72 samples were unlabeled. Of them, twenty three labeled samples in GSE14333 were used for independent validation (12 recurrence and 11 nonrecurrence). For reference, we compared performance from the semi-supervised method LDS to that from the state of the art supervised method SVM. To simulate different numbers and percentages of labeled samples in different datasets, we performed comparisons for three different sizes of labeled samples, 20, 40 and 66. For LDS, unlabeled samples were added at two different ratios. For each combination, results were generated for five random samples when possible in order to obtain robust performance evaluation results. For each random sample, t-test was used for feature selection with a cutoff value of P=0.05.
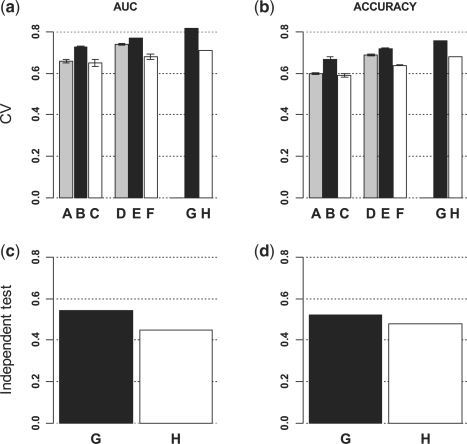
Figure 2 (a–b) depicts the average AUC and accuracy of LDS and SVM classifiers from the cross-validation studies. For sample size of 20, LDS achieved 1.9 and 11.7% increase in AUC and 1.7 and 13.6% increase in accuracy as compared with SVM when 20 (1:1) or 72 (1:3.6) unlabeled samples were added, respectively. For sample size of 40, 9.4 and 13.9% increase in AUC and 8.7 and 13.4% increase in accuracy were achieved when 40 (1:1) or 72 (1:1.8) unlabeled samples were added, respectively. For sample size of 66, 15.5% increase in AUC and 11.8% increase in accuracy were achieved when 72 (1:1.1) unlabeled samples were added. These figures also show small variance across the five random samples for each combination, suggesting the robustness of the evaluation results.
Fig. 2.
Integrating labeled and unlabeled data in a CRC dataset improves the prediction of cancer recurrence. Unlabeled data (UL) were added at different ratios to labeled data (L) for LDS classifier development, and the performance of LDS classifiers were compared with that of SVM classifiers based on both cross-validation and independent test. (a) AUC from 5-fold cross-validation results. (b) Accuracy from 5-fold cross-validation results. (c) AUC from independent test. (d) Accuracy from independent test. A:LDS (20L + 20UL), B:LDS (20L + 72UL), C:SVM (20L), D:LDS (40L + 40UL), E:LDS (40L + 72UL), F:SVM (40L), G:LDS (66L + 72UL), H:SVM (66L).
Using parameters selected based on cross-validation results, full models were developed based on all available data in GSE17536 (66 labeled and 72 unlabeled) and tested on the independent dataset GSE14333. The LDS classifier achieved an AUC of 0.55, which was 21% higher than that from the SVM classifier. Similarly, the LDS classifier obtained an accuracy of 0.52, which was 8.3% higher than that from the SVM classifier. Both cross-validation results and independent test results clearly demonstrated that LDS was able to integrate unlabeled data from the same dataset and achieve significantly better performance.
3.3 LDS is robust to the number of selected features
We used the t-test for feature selection and applied various cutoff values. The number of features selected depended on the cutoff used. In order to evaluate the robustness of LDS to the number of selected features, we tested different P-value cutoffs including 0.01, 0.05 and 0.1. From GSE17536, 40 randomly selected labeled samples and 72 unlabeled samples were used for the stratified 5-fold cross-validation analysis, and results were generated for five random samples and averaged.
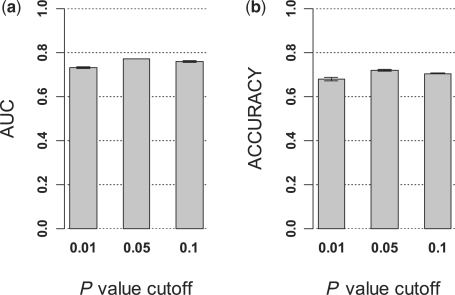
According to both AUC and accuracy, performance based on the P-value cutoffs 0.05 and 0.1 were very similar, whereas that based on the cutoff 0.01 was slightly worse (Fig. 3). However, the performance decrease between the 0.05 cutoff and the 0.01 cutoff was only 5.2% based on AUC and 5.5% based on accuracy. These results suggest that LDS was reasonably robust to the number of selected features with different P-value cutoffs. Because the 0.05 cutoff seemed to perform slightly better than its looser or more stringent alternatives, we continued the study using the 0.05 cutoff.
Fig. 3.
Performance of LDS classifiers derived from different numbers of features. In a CRC dataset, LDS classifiers were developed from 40 labeled and 72 unlabeled samples using features selected based on different P-value cutoffs (0.01, 0.05 and 0.1) and the cross-validation results were plotted. (a) AUC from 5-fold cross-validation results. (b) Accuracy from 5-fold cross-validation results.
3.4 Integrating unlabeled data from different datasets improves prediction performance
Although there exists many gene expression datasets from different institutions in the public databases for many cancer type, very few datasets provide clinical follow-up information. Therefore, it is of particular interest to investigate whether integrating labeled data with unlabeled data from different datasets can lead to improved prognosis, and how performance changes with increased number of unlabeled samples.
In addition to the two datasets used above (GSE17536 and GSE14333), we further collected three CRC datasets (GSE13294, GSE18105 and the CRC data in GSE2109) from the GEO database (Table 1). Similar to the above analysis, we kept GSE14333 as an independent test dataset and integrated the other four datasets for classifier development. A total of 662 samples in the four datasets were processed using the MAS5 algorithm followed by quantile normalization, removal of lowly expressed probe sets and removal of probe sets with low variation. Because strong batch effect was observed between different datasets, a gene-wise z-score transformation was applied to each dataset separately, that successfully reduced the batch effect (Supplementary Figure S1). After data processing, 40 labeled samples were randomly selected from the GSE17536 dataset. Unlabeled samples were added to achieve different ratios between labeled and unlabeled samples (1:1, 1:4, 1:8, 1:12, 1:15). The t-test was used for feature selection with a cutoff value of P=0.05. Semi-supervised classifiers were developed through stratified 5-fold cross-validation, and then evaluated using the 23 labeled samples in the GSE14333 dataset. For each ratio, the process was repeated five times and performance results were averaged.
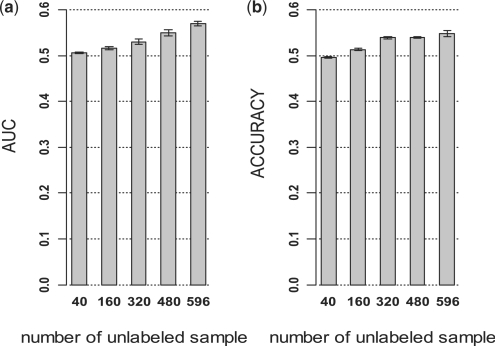
As shown in Figure 4, improvement in AUC and accuracy on independent validation set was observed with increased number of unlabeled samples. The AUC and accuracy were 0.57 and 0.55, respectively with 40 labeled and 596 unlabeled samples (1:15), which were 14 and 10% higher than those with 40 labeled and 40 unlabeled samples (1:1). Compared with the performance of SVM with 66 labeled samples (Fig. 2), LDS achieved 26% higher AUC and 14% higher accuracy with 40 labeled and 596 unlabeled samples. These results demonstrated that unlabeled data from different datasets could help improve prediction performance, and the improvement coincided with increased number of unlabeled samples.
Fig. 4.
Performance of LDS classifiers in CRC based on different numbers of unlabeled samples. Totally, forty labeled samples were combined with different numbers of unlabeled samples (ULs) from different CRC datasets for the development LDS classifiers, which were tested on an independent dataset. (a) AUC from independent test. (b) Accuracy from independent test.
3.5 LDS is effective in breast cancer datasets
To test the general applicability of this semi-supervised method, we applied the LDS procedure to human breast cancer datasets. A breast cancer dataset GSE2034 with 275 samples was used to develop classifiers for the prediction of 5-year recurrence. About thirty labeled samples were randomly selected as labeled samples while all other samples were treated as unlabeled samples. Similar to the observation in colon cancer, the semi-supervised prediction performance was robust to the number of selected features when different P-value cutoffs were tested (Supplementary Figure S2). Therefore, we used the 0.05 cutoff in the following studies. Semi-supervised classifiers were developed through stratified 5-fold cross-validation, and then evaluated using 158 labeled samples in an independent dataset GSE2990. This process was repeated five times and performance results were averaged.
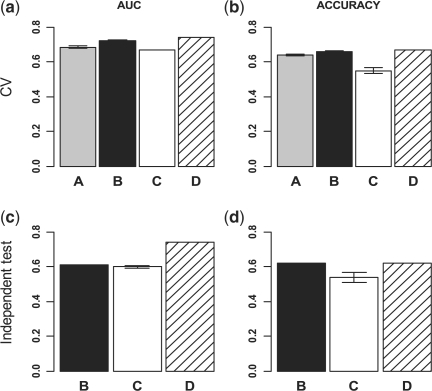
In cross-validation studies, LDS achieved 16.3 and 20% increase in accuracy as compared with SVM when 30 (1:1) and 245 (1:8.1) unlabeled samples were added respectively (Fig. 5b). When AUC was used as the performance metric, 2.2 and 7.45% increase were observed as compared with SVM when 30 and 245 unlabeled samples were added, respectively (Fig. 5a). Interestingly, the accuracy and AUC obtained by SVM with 275 labeled samples was only 1.5 and 2.6% higher than that by LDS with 30 labeled and 245 unlabeled samples, suggesting great potential of the semi-supervised method.
Fig. 5.
Comparison of LDS and SVM classifiers for the prediction of breast cancer recurrence. Unlabeled data (UL) were added at different ratios to labeled data (L) for LDS classifier development, and the performance of LDS classifiers were compared with that of SVM classifiers based on both cross-validation and independent test. (a) AUC from 5-fold cross-validation results. (b) Accuracy from 5-fold cross-validation results. (c) AUC from independent test. (d) Accuracy from independent test. A:LDS (30L + 30UL), B:LDS (30L + 245UL), C:SVM (30L), D:SVM (275L).
Applying the full model developed by LDS with 30 labeled and 245 unlabeled samples on the independent validation set GSE2990 resulted in an accuracy of 0.62, which was 14.8% higher than that obtained by SVM with 30 labeled samples and was comparable with that obtained by SVM with 275 labeled samples (Fig. 5d). However, significant gain in accuracy did not translate into superior AUC (Fig. 5c).
To test whether integrating unlabeled data from different datasets could improve prediction performance in breast cancer, we used an additional dataset GSE20271 with 178 samples (Table 1). We kept GSE2990 as an independent test dataset and integrated GSE2034 and GSE20271 for classifier development. After data processing as described in the CRC study, 30 labeled samples were randomly selected from the GSE2034 dataset. Unlabeled samples were added to achieve different ratios between labeled and unlabeled samples (1:1, 1:5, 1:10, 1:14). The t-test was used for feature selection with a cutoff value of P=0.05. Semi-supervised classifiers were developed through stratified 5-fold cross-validation, and then evaluated using the 158 labeled samples in the GSE2990 dataset. For each ratio, the process was repeated five times and performance results were averaged.
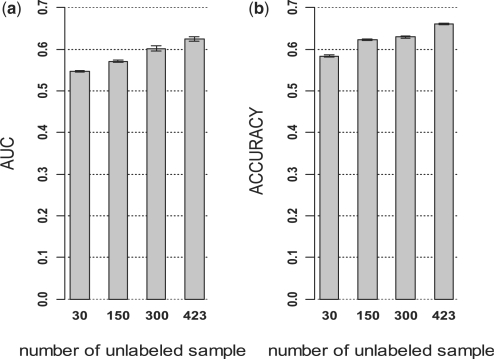
As shown in Figure 6, improvement in AUC and accuracy on independent validation set was observed with increased number of unlabeled samples. These results were consistent with the observations in CRC and further demonstrated that unlabeled data from different datasets could help improve prediction performance.
Fig. 6.
Performance of LDS classifiers in breast cancer based on different numbers of unlabeled samples. About 30 labeled samples were combined with different numbers of unlabeled samples (ULs) from different breast cancer datasets for the development of LDS classifiers, which were tested on an independent dataset. (a) AUC from independent test. (b) Accuracy from independent test.
4 DISCUSSION
The present study was designed to address the small sample size problem in gene expression-based outcome prediction for human cancers. As compared with SVM, the semi-supervised LDS approach successfully employed unlabeled gene expression data and achieved significantly better performance.
Previous studies in the machine learning field suggest that unlabeled data do not always help improve the performance (Cozman and Cohen, 2002). If labeled data and unlabeled data follow different distributions, integrating unlabeled data may even lead to worse performance. This is a big concern for integrating datasets from different institutes, as these datasets are likely to follow different distributions because of both biological and technical reasons. In our analysis, we used quantile normalization to make distributions for all samples comparable. However, an unsupervised clustering analysis suggested that strong batch effect remained after this step (Supplementary Figure S1A). Further application of a gene-wise z-score transformation to each dataset separately, effectively reduced the batch effect (Supplementary Figure S1B). Without these data preprocessing steps, LDS was not able to achieve improved performance (data not shown). It is possible that more advanced data preprocessing (Johnson et al., 2007) might further improve the LDS performance.
Cross-validation provides an estimate of the expected prediction error for the classifier developed using the full dataset. We performed gene selection from scratch within each loop of the cross-validation to avoid overestimation of the performance. Moreover, we also repeated the 5-fold cross-validation for five times when possible to obtain a more robust estimation. However, when a fully developed model was applied on an independent data, the performance was notably worse than that estimated, based on cross-validation. This was true for both LDS and SVM classifiers, and performance degradation was more severe in the CRC study than the breast cancer study. Indeed, SVM performed worse than random (AUC < 0.5 and accuracy <0.5) on the independent test set in the CRC study. One explanation is the different class proportions between the training and the independent test datasets, given the small sample size in both datasets. Previously, it has been reported that varying class proportions in training and test datasets can lead to pessimistic biases for both accuracy and AUC, and this problem is common in microarray studies with small sample size and weak signals (Parker et al., 2007). Although the class proportion can be well maintained in a stratified cross-validation, it is not controlled for independent test sets. Another explanation is the biological difference between different patient cohorts. For example, in the CRC study, the training dataset GSE17536 was from a US population, whereas, the test dataset GSE14333 was from an Australian population.
AUC and accuracy are the two commonly used metrics for evaluating the predictive ability of learning algorithms. Previously, it has been reported that AUC and accuracy do not always coincide, and may even contradict one another. In our study, we also noticed clear difference between performance gain in AUC and accuracy. For example, in the breast cancer study, LDS achieved much higher accuracy as compared with SVM in both cross-validation and independent validation. However, the increase in AUC was relevantly smaller. Therefore, reporting both metrics is necessary for a more complete picture on the performance improvement.
Although semi-supervised learning has been applied to different biological problems including gene expression-based cancer subtype discovery (Bair and Tibshirani, 2004; Koestler et al., 2010; Steinfeld et al., 2008), based on our knowledge, this is the first report on its application to gene expression-based classification of human cancer. Our results demonstrated great potential of semi-supervised learning in this critical but difficult clinical problem. The LDS algorithm used in this study is based on the ‘cluster assumption’. An important future work is to compare the LDS algorithm with other semi-supervised algorithms such as those based on the ‘manifold assumption’ (Chapelle et al., 2006) to further investigate the application of semi-supervised learning to gene expression-based disease classification.
Funding: The National Institutes of Health (NIH)/National Institute of General Medical Sciences (NIGMS) (grant R01GM088822). This work was conducted in part using the resources of the Advanced Computing Center for Research and Education at Vanderbilt University, Nashville, TN.
Conflict of Interest: none declared.
Supplementary Material
REFERENCES
- Bair E, Tibshirani R. Semi-supervised methods to predict patient survival from gene expression data. Plos Biol. 2004;2:511–522. doi: 10.1371/journal.pbio.0020108. [DOI] [PMC free article] [PubMed] [Google Scholar]
- Belkin M, Niyogi P. Semi-supervised learning on Riemannian manifolds. Mach. Learn. 2004;56:209–239. [Google Scholar]
- Bild AH, et al. Oncogenic pathway signatures in human cancers as a guide to targeted therapies. Nature. 2006;439:353–357. doi: 10.1038/nature04296. [DOI] [PubMed] [Google Scholar]
- Blum A, Mitchell T. Proceedings of the 11th Annual Conference on Computational Learning Theory. Madison, Wisconsin, USA: ACM Press; 1998. Combining labeled and unlabeled data with co-training; pp. 92–100. [Google Scholar]
- Chapelle O, Zien A. Proceedings of the Tenth International Workshop on Artificial Intelligence and Statistics. Barbados, USA: Morgan Kaufmann Publishers Inc.; 2005. Semi-supervised classification by low density separation; pp. 57–64. [Google Scholar]
- Chapelle O, et al. Semi-Supervised Learning. London: The MIT Press; 2006. [Google Scholar]
- Chapelle O, et al. Optimization techniques for semi-supervised support vector machines. J. Mach. Learn. Res. 2008;9:203–233. [Google Scholar]
- Chen K, Wang SH. Semi-supervised learning via regularized boosting working on multiple semi-supervised assumptions. IEEE T. Pattern Anal. 2011;33:129–143. doi: 10.1109/TPAMI.2010.92. [DOI] [PubMed] [Google Scholar]
- Chibon F, et al. Validated prediction of clinical outcome in sarcomas and multiple types of cancer on the basis of a gene expression signature related to genome complexity. Nat. Med. 2010;16:781–787. doi: 10.1038/nm.2174. [DOI] [PubMed] [Google Scholar]
- Cozman FG, Cohen I. Proceedings of the 15th International Conference of the Florida Artificial Intelligence Research Society. Pensacola, Florida, USA: AAAI Press; 2002. Unlabeled data can degrade classificaion performance of generative classifiers; pp. 327–331. [Google Scholar]
- Crijns APG, et al. Survival-related profile, pathways, and transcription factors in ovarian cancer. Plos Med. 2009;6:181–193. doi: 10.1371/journal.pmed.1000024. [DOI] [PMC free article] [PubMed] [Google Scholar]
- Dupuy A, Simon RM. Critical review of published microarray studies for cancer outcome and guidelines on statistical analysis and reporting. J. Natl Cancer I. 2007;99:147–157. doi: 10.1093/jnci/djk018. [DOI] [PubMed] [Google Scholar]
- Ein-Dor L, et al. Thousands of samples are needed to generate a robust gene list for predicting outcome in cancer. Proc. Natl Acad. Sci. USA. 2006;103:5923–5928. doi: 10.1073/pnas.0601231103. [DOI] [PMC free article] [PubMed] [Google Scholar]
- Ernst J, et al. A semi-supervised method for predicting transcription factor-gene interactions in Escherichia coli. Plos Comput. Biol. 2008;4:e1000044. doi: 10.1371/journal.pcbi.1000044. [DOI] [PMC free article] [PubMed] [Google Scholar]
- Gentles AJ, et al. Association of a leukemic stem cell gene expression signature with clinical outcomes in acute myeloid leukemia. JAMA. 2010;304:2706–2715. doi: 10.1001/jama.2010.1862. [DOI] [PMC free article] [PubMed] [Google Scholar]
- Goetz MP, et al. Gene-expression-based predictors for breast cancer. New Engl. J. Med. 2007;356:752–753. doi: 10.1056/NEJMc062416. [DOI] [PubMed] [Google Scholar]
- Gray R, et al. Adjuvant chemotherapy versus observation in patients with colorectal cancer: a randomised study. Lancet. 2007;370:2020–2029. doi: 10.1016/S0140-6736(07)61866-2. [DOI] [PubMed] [Google Scholar]
- Joachims T. Proceedings of the Sixteenth International Conference on Machine Learning. Bled, Slovenia, USA: Morgan Kaufmann Publishers Inc.; 1999. Transductive inference for text classification using support vector machines; pp. 200–209. [Google Scholar]
- Johnson R, Zhang T. On the effectiveness of laplacian normalization for graph semi-supervised learning. J. Mach. Learn. Res. 2007;8:1489–1517. [Google Scholar]
- Johnson WE, et al. Adjusting batch effects in microarray expression data using empirical Bayes methods. Biostatistics. 2007;8:118–127. doi: 10.1093/biostatistics/kxj037. [DOI] [PubMed] [Google Scholar]
- Kall L, et al. Semi-supervised learning for peptide identification from shotgun proteomics datasets. Nature Methods. 2007;4:923–925. doi: 10.1038/nmeth1113. [DOI] [PubMed] [Google Scholar]
- Kim HK, et al. Gene expression signatures to predict the response of gastric cancer to cisplatin and fluorouracil. J. Clin. Oncol. 2009;27:4628. [Google Scholar]
- Koestler DC, et al. Semi-supervised recursively partitioned mixture models for identifying cancer subtypes. Bioinformatics. 2010;26:2578–2585. doi: 10.1093/bioinformatics/btq470. [DOI] [PMC free article] [PubMed] [Google Scholar]
- Kulis B, et al. Semi-supervised graph clustering: a kernel approach. Mach. Learn. 2009;74:1–22. [Google Scholar]
- Lu ATT, et al. Gene expression profiles as predictors of poor outcomes in stage ii colorectal cancer: a systematic review and meta-analysis. Clin. Colorectal Canc. 2009;8:207–214. doi: 10.3816/CCC.2009.n.035. [DOI] [PubMed] [Google Scholar]
- Mallapragada PK, et al. SemiBoost: boosting for semi-supervised learning. IEEE T. Pattern Anal. 2009;31:2000–2014. doi: 10.1109/TPAMI.2008.235. [DOI] [PubMed] [Google Scholar]
- Mann GS, McCallum A. Generalized expectation criteria for semi-supervised learning with weakly labeled data. J. Mach. Learn. Res. 2010;11:955–984. [Google Scholar]
- Mok SC, et al. A gene signature predictive for outcome in advanced ovarian cancer identifies a survival factor: microfibril-associated glycoprotein 2. Cancer Cell. 2009;16:521–532. doi: 10.1016/j.ccr.2009.10.018. [DOI] [PMC free article] [PubMed] [Google Scholar]
- Parker BJ, et al. Stratification bias in low signal microarray studies. BMC Bioinformatics. 2007;8:326. doi: 10.1186/1471-2105-8-326. [DOI] [PMC free article] [PubMed] [Google Scholar]
- Rigollet P. Generalization error bounds in semi-supervised classification under the cluster assumption. J. Mach. Learn. Res. 2007;8:1369–1392. [Google Scholar]
- Salazar R, et al. Gene expression signature to improve prognosis prediction of stage II and III colorectal cancer. J. Clin. Oncol. 2011;29:17–24. doi: 10.1200/JCO.2010.30.1077. [DOI] [PubMed] [Google Scholar]
- Sotiriou C, Pusztai L. Gene-expression signatures in breast cancer. N. Engl. J. Med. 2009;360:790–800. doi: 10.1056/NEJMra0801289. [DOI] [PubMed] [Google Scholar]
- Sotiriou C, et al. Gene expression profiling in breast cancer: Understanding the molecular basis of histologic grade to improve prognosis. J. Natl Cancer Inst. 2006;98:262–272. doi: 10.1093/jnci/djj052. [DOI] [PubMed] [Google Scholar]
- Steinfeld I, et al. Clinically driven semi-supervised class discovery in gene expression data. Bioinformatics. 2008;24:I90–I97. doi: 10.1093/bioinformatics/btn279. [DOI] [PubMed] [Google Scholar]
- Stratford JK, et al. A six-gene signature predicts survival of patients with localized pancreatic ductal adenocarcinoma. Plos Med. 2010;7:e1000307. doi: 10.1371/journal.pmed.1000307. [DOI] [PMC free article] [PubMed] [Google Scholar]
- Sugiyama M, et al. Semi-supervised local Fisher discriminant analysis for dimensionality reduction. Mach. Learn. 2010;78:35–61. [Google Scholar]
- Sun ZF, et al. Non-overlapping and non-cell-type-specific gene expression signatures predict lung cancer survival. J. Clin. Oncol. 2008;26:877–883. doi: 10.1200/JCO.2007.13.1516. [DOI] [PubMed] [Google Scholar]
- van de Vijver MJ, et al. A gene-expression signature as a predictor of survival in breast cancer. N. Engl. J. Med. 2002;347:1999–2009. doi: 10.1056/NEJMoa021967. [DOI] [PubMed] [Google Scholar]
- Wang JH, Shen XT. Large margin semi-supervised learning. J. Mach. Learn. Res. 2007;8:1867–1891. [Google Scholar]
- Wang Y, et al. Gene-expression profiles to predict distant metastasis of lymph-node-negative primary breast cancer. Lancet. 2005;365:671–679. doi: 10.1016/S0140-6736(05)17947-1. [DOI] [PubMed] [Google Scholar]
- Weston J, et al. Semi-supervised protein classification using cluster kernels. Bioinformatics. 2005;21:3241–3247. doi: 10.1093/bioinformatics/bti497. [DOI] [PubMed] [Google Scholar]
- Xiang SM, et al. Semi-supervised classification via local spline regression. IEEE T. Pattern Anal. 2010;32:2039–2053. doi: 10.1109/TPAMI.2010.35. [DOI] [PubMed] [Google Scholar]
- Xu ZL, et al. Discriminative semi-supervised feature selection via manifold regularization. IEEE T. Neural Networ. 2010;21:1033–1047. doi: 10.1109/TNN.2010.2047114. [DOI] [PubMed] [Google Scholar]
Associated Data
This section collects any data citations, data availability statements, or supplementary materials included in this article.


