

Abstract
Pulmonary hypertension (PH) is a relatively misunderstood disease, partly related to the fact that many perceive PH to be a singular diagnosis. An unintended consequence of this is the misapplication of the role of the Doppler-Echocardiographic (DE) examination, as well as an underappreciation for its ability to help discern PH pathophysiology prior to right heart catheterization. Since DE often serves as the “gatekeeper” to invasive right heart catheterization, misinterpretation of the DE can lead to missed or delayed diagnosis with devastating consequences. Too often, the primary or nearly exclusive focus of the DE examination is placed on the pulmonary artery pressure estimation. Two main issues with this approach are that Doppler pressure estimations can be inaccurate and even when accurate, without integration of additional 2-D and Doppler information, the clinician will often still not appreciate the pathophysiology of the PH nor its clinical significance. This review will focus on the 2-D and Doppler features necessary to assess pulmonary vascular disease (PVD), discern the salient differences between PVD and pulmonary venous hypertension (PVH), and how to integrate these key DE parameters such that PH pathophysiology can be determined noninvasively and early in the patient workup. Overreliance on any single DE metric, and especially PA pressure estimation, detracts from the overall diagnostic potential of the DE examination. Integrating the relative balance of right and left heart findings, along with proper Doppler interpretation provides a wealth of clinical and pathophysiologic insight prior to invasive hemodynamic assessment. The end results are heightened awareness and improved identification of which patients should be referred for further invasive testing, as well the use of the DE information to compliment the findings from invasive testing.
Keywords: pulmonary hypertension, right ventricular function, echocardiogram, Doppler
INTRODUCTION
This review will focus on the principles and uses of the echo-Doppler examination (DE) in patients with pulmonary vascular disease (PVD). That is, patients whom have pulmonary hypertension that is primarily related to an increase in the pulmonary vascular resistance (PVR) and loss of large pulmonary artery compliance. We will also address the role of DE in the initial assessment of patients with undifferentiated pulmonary hypertension (PH), as the diagnosis of PH typically precedes confirmation or exclusion of PVD as the cause of PH. We will emphasize noninvasive clues that provide insight into the pathophysiology of PH pulmonary hypertension prior to invasive hemodynamic assessment. To accomplish this, a basic understanding of the right heart and pulmonary circulation is required, then how various forms of pulmonary hypertension, including pulmonary vascular disease, can disrupt the right ventricular-pulmonary artery interaction. Using a more integrated approach helps the clinician avoid some of the pitfalls of the DE examination, especially the overreliance on the Doppler pressure estimation in the initial diagnosis and serial assessment of patients with pulmonary hypertension. This approach also improves the diagnostic sensitivity of the DE examination for PVD and improves patient selection for further invasive hemodynamic testing.
ANATOMY AND PHYSIOLOGY OF THE PULMONARY CIRCULATION AND RIGHT HEART
The right ventricle is comprised of inflow (sinus) and outflow (conus) regions, separated by a muscular ridge, the crista supraventricularis. The inflow region includes the tricuspid valve (TV), the chordae/papillary muscles as well as the body of the RV.[1,2] The boundaries of the body of the RV are formed by the RV free wall, extending with a radius of curvature approximating that of a large sphere, from the anterior and posterior aspects of the interventricular septum. The normal septal curvature is convexed toward the RV cavity, imparting a crescentic shape to the right ventricle in cross section. The interior surface of the RV is heavily trabeculated; this feature along with the moderator band and more apical insertion of the TV-annulus impart key morphologic differences that distinguish the RV from the LV by echocardiography. In contrast, the infundibulum is a smooth, funnel shaped outflow portion of the RV that ends at the pulmonic valve. Thus, the RV has a complex geometry which largely precludes calculation of RV volume (and thus RV ejection fraction) by 2D echo. However, this limitation does not preclude alternative, non-volumetric methods of RV function assessment (vide infra).
Normal RV free wall thickness is 0.3-0.5 cm, imparting greater distensability and larger cavity volumes in the RV versus the LV, despite lower end-diastolic filling pressures. This translates to an RVEF that is typically 35% to 45% (versus 55-65% in the LV) yet generates the identical SV as the LV.
Systolic function of the RV, like the LV, is influenced by changes in preload, afterload, and the intrinsic contractility of the ventricle. Differences in RV muscle fiber orientation dictate that the body of the RV shortens symmetrically in the longitudinal and radial planes; thus, longitudinal shortening accounts for a much larger proportion of RV ejection than in the LV.[3] This relatively conspicuous RV shortening along the longitudinal axis can be exploited to measure RV systolic function using relatively simple techniques that do not require geometric assumptions or meticulous endocardial definition, both of which are known limitations to the noninvasive assessment of RV systolic function.[3,4]
The right ventricle and the pulmonary circulation function as a coupled unit. In health, a normal pulmonary vasculature couples to an appropriately thin-walled, distensible RV that is designed to generate large amounts of blood flow without a resulting high pressure (‘flow generator’). As long as this normal interaction holds, so will this physiologic paradigm. As pulmonary vascular disease develops, the pulmonary vascular resistance increases and the large arteries stiffen. As a result, the (formerly appropriate) non-muscular RV is typically incapable of completely matching, or coupling its contractile performance to its new afterload.[5,6] This relative RV-PA uncoupling leads to a stereotypical triad of changes that occur at the level of the RV, including RV systolic dysfunction, increased size and altered shape of the RV, as well as varying degrees of systolic and diastolic bowing of the interventricular septum. This triad of changes forms the basis of the echocardiographic diagnosis of PVD. The degree to which these changes occur is contingent upon the degree of RV-PA uncoupling. At a PVR of 5 WU, a patient with depressed RV contractility is far more uncoupled to their vascular load than a patient with an intrinsically normal RV coupled to the same afterload. The RV dysfunction triad helps to adjudicate and assess the physiologic and clinical significance of any given degree of PVD. The greater the RV impairment, the greater the overall significance of the PVD, no matter what the noninvasive pressure estimate is reported to be.
Hypertrophy typically denotes chronicity, thus in more chronic forms of PH, RV hypertrophy predominates over RV dilatation. In contrast, in more acute forms such as pulmonary embolism, or even pulmonary arterial hypertension, dilatation of the RV occurs disproportionate to hypertrophy. It also seems that chronicity affects the degree of adaptation of the RV to a given afterload. The RV in Eisenmenger's syndrome is often massively hypertrophied, not dilated, and maintains relatively normal function despite decades of systemic level afterload; this is the most likely explanation for the more favorable long term prognosis of these patients as compared to other forms of pulmonary arterial hypertension (PAH).[5,6]
Doppler data provides further physiologic and hemodynamic characterization of the varying etiologies of pulmonary hypertension. Importantly, varying degrees of pulmonary hypertension often result from an abnormal RV-PA interaction. However, the increased pulmonary artery pressure is the result, not the cause, of the RV-PA mismatch. Thus, a simple, but critically important distinction is that PA pressure is a poor measure of RV afterload, which is why pulmonary artery pressure is also a poor predictor of clinical RV failure and prognosis in PAH.[7] Understanding this physiologic paradigm puts the clinician at a distinct advantage when assessing a patient with known or suspected PH. The presence or absence (whether a true negative or false negative) of elevated pulmonary artery pressure should not necessarily dissuade the clinician from suspecting PVD if there is evidence of RV dysfunction, especially when occurring in the form of the above noted triad.
PRESSURE ASSESSMENT BY DOPPLER
Despite its shortcomings as a measure of RV afterload, the pulmonary artery pressure assessment is a central component of the evaluation of patients with known or suspected PVD. This relates to the fact that varying degrees of pulmonary hypertension are nearly always present in patients with PVD, and the workup of these patients typically emanates from the initial noninvasive pressure assessment. A PASP>40 mmHg is generally accepted as the upper limit of normal in most subjects, however the cutoff may be higher in elderly subjects.[8,9]
The most common method used in Doppler pressure assessment utilizes continuous wave Doppler to determine the peak tricuspid regurgitant jet velocity, which estimates the pressure difference between the right ventricle and right atrium using the modified Bernoulli equation (4v2; v equals the peak velocity of the TR jet),[10,11] as shown in Figure 1. The TV must be interrogated from multiple different views (i.e. RV inflow, short axis, apical four chamber, subcostal views) to ensure that the ultrasound beam is parallel to the regurgitant signal, thus allowing optimal Doppler envelope quality and an accurate peak transtricuspid flow velocity (TTFV). In general, the highest velocity obtained should be used to calculate the peak RV systolic pressure. One exception is the inclusion of a post-extrasystolic beat, which will often have a substantially higher peak velocity than steady state beats, relating to the larger stroke volume generated following the compensatory pause. If pulmonic stenosis is present, the gradient across the pulmonic valve must be subtracted from the peak RV systolic pressure to obtain the peak PA pressure, otherwise, a distinction between ‘RV hypertension’ and pulmonary hypertension can be missed and PH medical therapy may be misapplied over mechanical intervention on the stenotic valve. In a technically limited study, agitated saline can be injected intravenously (IV) to enhance the TR jet signal and improve the measurement of the maximum TR jet velocity.[12] The absence of TR precludes pressure assessment via this method. An estimated right atrial pressure (RAP) is then added to the RV-RA pressure gradient to approximate PA systolic pressure. Thus, PASP≈4v2+ estimated RA pressure.
Figure 1.
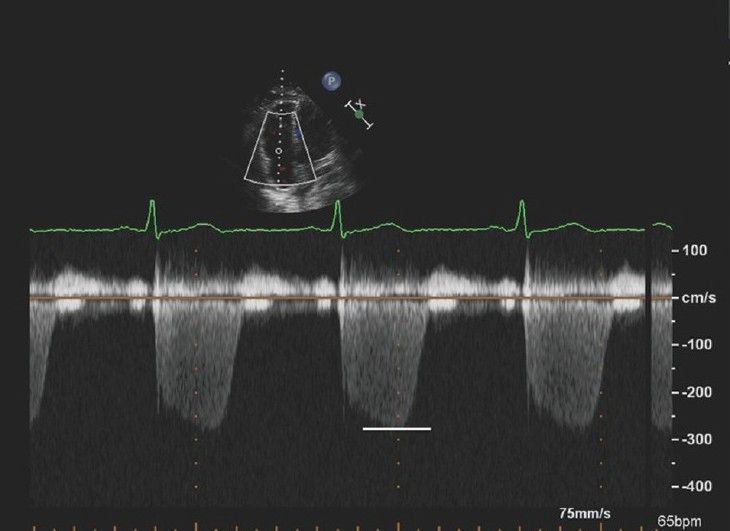
Four chamber apical view with continuous wave Doppler interrogation across the tricuspid valve. The peak velocity is 2.7 m/sec, thus estimating a pressure gradient between the right ventricle and right atrium of 29 mmHg. This added to an RA pressure estimate will estimate PA systolic pressure. The high quality Doppler signal with a clearly defined peak lends to more reproducible and reliable pressure estimation.
When all “conditions” required for this method are met-namely sufficient TR for interrogation, proper Doppler alignment, optimal visualization of the peak of the TR jet, and accurate RAP estimation–this method indeed correlates strongly with invasive PA systolic pressure assessment.[13,14] However, one or more of these limitations frequently occur in clinical practice leading to varying degrees of discrepancy between Doppler and invasive pressure. Clinicians experienced in assessing patients with PH will attest to the limitations of the Doppler pressure estimate, and recognize that the Doppler PA systolic pressure estimates should not be viewed as synonymous with invasive pressure recordings. Fisher et al. examined the correlation between Doppler estimated and invasively measured PA systolic pressure in a cohort of 65 patients with more severe pulmonary hypertension (62% with pulmonary arterial hypertension).[15] Although the correlation between Doppler and invasive PA systolic pressure measurements was reasonable (r=0.66; P<0.001), Bland-Altman analysis revealed that 48% of patients had a Doppler-estimated PA systolic pressure that was at least 10 mmHg different from the catheterization (16 underestimates, 15 overestimates). Pressure overestimations arose from either overestimation of the peak velocity signal (Fig. 2) or an overestimated RAP arising from IVC diameter and collapsibility assessment (vide infra). The magnitude of underestimation (–30 mmHg) was significantly greater than the degree of overestimation (+19 mmHg), with the underestimates leading to more frequent and marked misclassification of the degree of PH. Subjects with Doppler pressure underestimation had lower quality TR Doppler signals, leading to peak velocity (and thus pressure) underestimation (Fig. 3). Of note, of the 6 subjects in the study with no TR, 4 of these patients had pulmonary hypertension by catheterization. Thus, the absence of TR is not sufficient to exclude significant PH, even though it typically denotes a more compensated right ventricle. Twelve of the 16 patients in whom PA pressure was underestimated by DE had evidence of RV enlargement and/or dysfunction on their DE exam. Multiple studies have now shown a misclassification or improper estimation of PASP ranging from 48-54%.[16,17]
Figure 2.
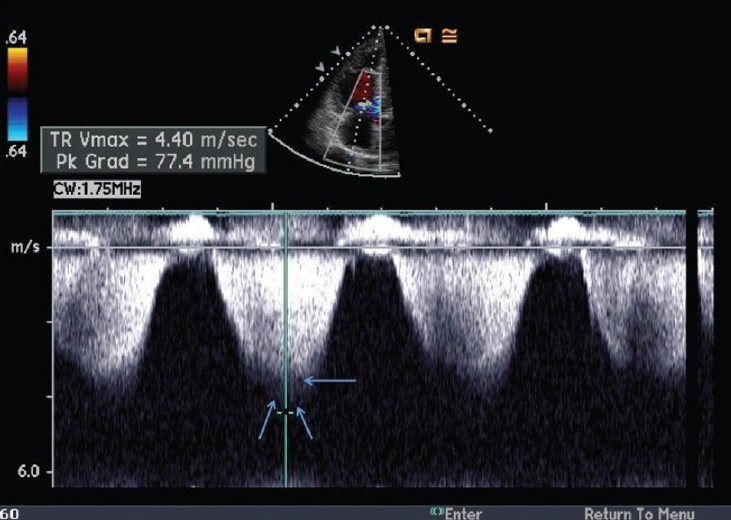
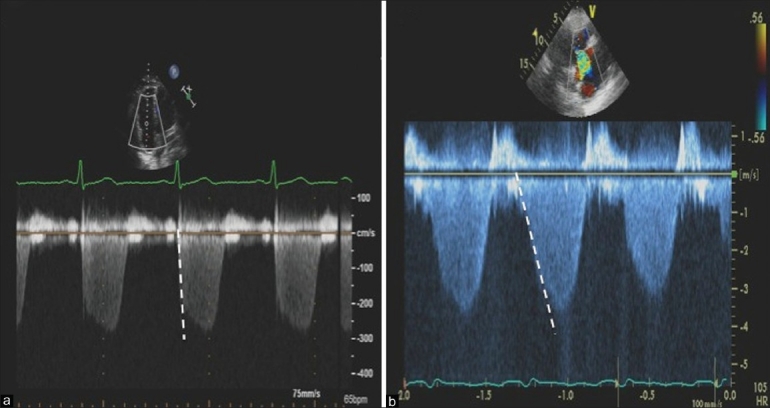
Example of pulmonary artery systolic pressure overestimation by the continuous-wave Doppler method. The reported peak velocity is 4.4 m/s, estimating a gradient between the RV and the RA of 77 mmHg. However, the true peak velocity (b) is only 3.6 m/s, estimating an RV to RA gradient of only 52 mmHg. This figure highlights the importance of measuring the peak velocity carefully, as the peak velocity is squared, thus amplifying the error. Note the true peak Doppler velocity (single arrow) and the ‘shadow’ (double arrow) above the true peak of the Doppler envelope.
Figure 3.
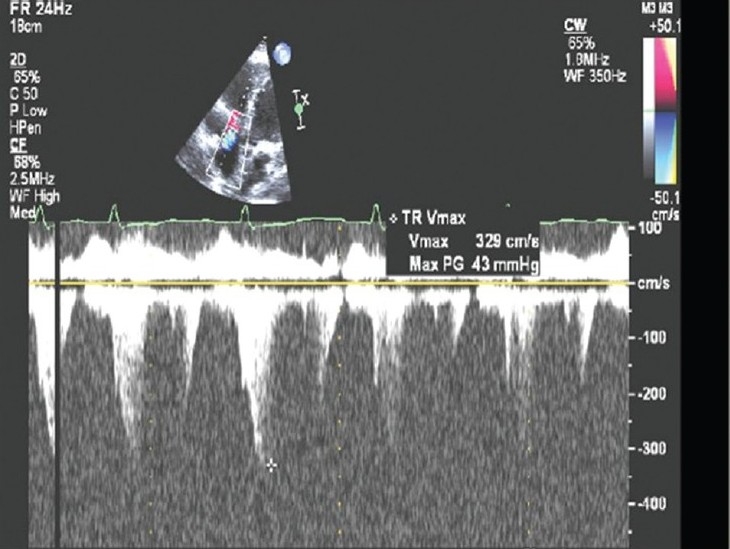
Example of pulmonary artery systolic pressure underestimation by continuous wave Doppler method. Note the Doppler signal dropout and a poorly defined peak TR velocity. The peak velocity is estimated at 3.3 m/sec, estimating an RV to RA gradient of 43mmHg and PA systolic pressure of 53 mmHg. A right heart catheterization within 24 hours of the DE examination revealed a pulmonary artery systolic pressure of 95 mmHg. Note the RV dilation on the above 2-D image; the RV dilatation is an important clue to potential PA systolic pressure underestimation.
A variety of techniques have been used to estimate RAP, most often using the inferior cava dimensions and/or the degree of IVC collapsibility with inspiration or “sniff.”[18,19] None of these techniques have proved particularly accurate, with RAP overestimation being the more frequently observed limitation.[15] In fact, an overestimated RAP was the primary source of error in nearly 50% of the subjects with an overestimated PASP.[15] The relative inaccuracy of the IVC-estimated RAP relates to a number of factors, including the fact that IVC dilatation and collapsibility are dictated not only by the intravascular distending pressure, but also by the relative compliance of the IVC, the degree of chronic remodeling of the IVC, and also the relative degree and transmission of the fall in pleural pressure to the vena cava. Recently, Utsunomiya et al. compared right atrial pressure estimates obtained via the ratio of tricuspid inflow E wave velocity to the tricuspid annular tissue Doppler E wave velocity (E/Ea) with near simultaneous invasive pressure values in 50 patients with chronic PAH. The echo measured E/Ea had a reasonable correlation to RHC measured mean RAP (r=0.80), with most error arising from echocardiogram overestimation.[20] Given the significant variation in these methods, we prefer to add the clinically estimated right atrial pressure from the jugular venous pressure examination to the Doppler derived transtricuspid gradient in order to obtain the most accurate PA systolic pressure estimate.
The Doppler pressure estimate should not be viewed as a “stand alone” test in the assessment of a patient with known or suspected pulmonary vascular disease. Rather, the Doppler pressure estimate should be integrated into the context of the remainder of the examination; if the Doppler examination estimates mild pulmonary hypertension in the context of moderate RV enlargement and systolic dysfunction, it is more likely that the pressure has been underestimated and a right heart catheterization should be performed. In contrast, borderline or mild pulmonary hypertension in the context of normal RV size, shape and systolic function often is associated with a false positive diagnosis of pulmonary hypertension.
Pulmonary artery diastolic pressure (PADP) can be derived from the end-diastolic point of the pulmonary regurgitation signal, added to an estimate of right atrial pressure[21] (Fig. 4). Alternatively, PADP can be estimated from the velocity obtained from the TR jet at the time of pulmonic valve opening.[22,23] In either case, the accuracy of the method is contingent on the presence of PR or TR and the quality of the respective Doppler envelopes.
Figure 4.
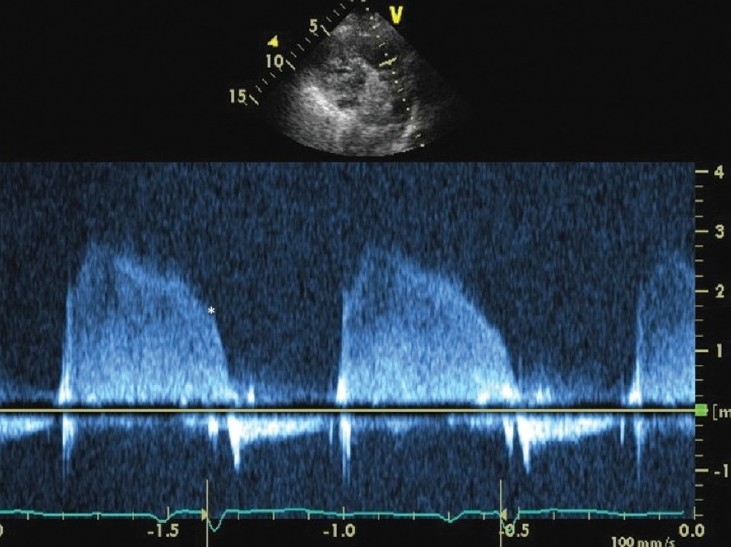
Continuous wave Doppler interrogation of the right ventricular outflow tract. The end diastolic regurgitant velocity is 1.9 m/sec. When added to an estimate of right atrial pressure of 15 mmHg, this estimates a pulmonary artery diastolic pressure of 30 mmHg.
The mean pulmonary artery pressure can also be estimated by Doppler. The most common method takes advantage of the inverse correlation between the time to peak velocity (acceleration time; AcT) of the pulsed wave Doppler profile obtained in the RV outflow tract [mPAP=79-0.45 (RVOT AcT)] (Fig. 5). Kitabatake et al. showed that patients with a mean PA pressure of 19 mmHg had an average AcT of 137±24 msec, whereas an AcT of 97±20 msec and 65±14 msec was seen in patients with a mPAP of 20-39 mmHg, and ≥40 mmHg, respectively.[24] This method is relatively easy to perform, highly reproducible, and unlike pressure estimates based on tricuspid regurgitation velocity, Doppler recordings from the RVOT are available in virtually all patients. The AcT can provide very useful corroborative information that aids in the accuracy of PH diagnosis; for example, in the presence of borderline PH by TR jet velocity, a AcT >100 msec would suggest there is no PH, whereas an AcT of <70 ms would greatly increase the likelihood of PH being present.
Figure 5.
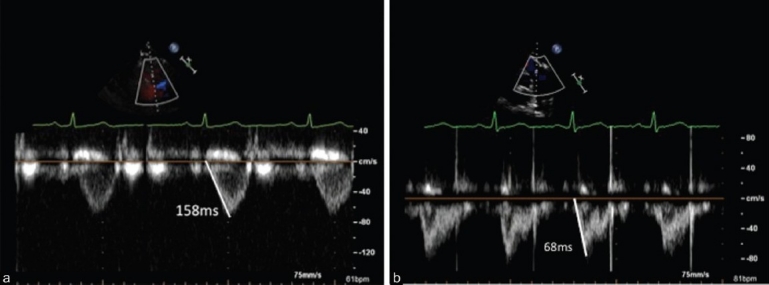
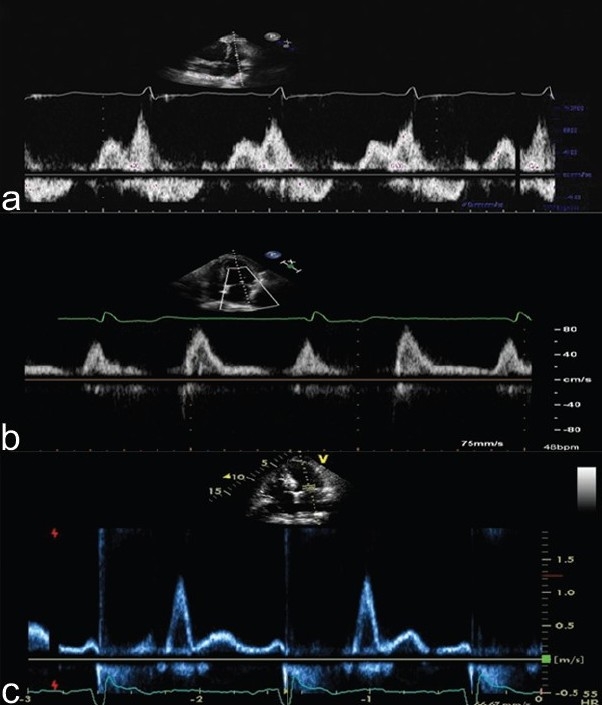
Pulse wave Doppler interrogation of the right ventricular outflow tract. Panel A represents the time to peak velocity of the Doppler envelope, or Acceleration Time (AcT)=158ms, consistent with normal mean pulmonary artery pressure. Panel B illustrates an AcT=68ms, in a patient with a mean pulmonary artery pressure of 42 mmHg.
Another method of deriving the mPAP uses the standard formula for mPAP, taken from the Doppler-estimated SPAP and DPAP from tricuspid and pulmonic reguritant flow velocities (mPAP=DPAP+(SPAP-DPAP/3), respectively. However, since this method relies on two Doppler pressure estimates, this method is potentially subject to compounding error. Alternatively, the mean PAP can be estimated from the Doppler PA systolic pressure estimate using the Chemla (mPAP=0.61 (sPAP)+2 mmHg) or the Syyed (mPAP=0.65 (sPAP)+0.55 mmHg) formulas.[25] These formulas take advantage of the predictable hemodynamic relationship between mean and systolic pulmonary artery pressure in most patients.[26]
RV FUNCTION ASSESSMENT
Direct measures of RV systolic function
Assessment of right ventricular function is the single most important aspect of the DE examination in patients with known or suspected PVD, given the morbidity and mortality associated with this condition is heavily dependent on the degree of adaptation of the right ventricle to its excessive pulmonary vascular load. Virtually all echocardiographic measures shown to have prognostic significance in PAH are either direct or indirect measures of RV systolic performance.[7]
As mentioned above, RV geometry does not lend to simple modeling, and thus formulae to estimate RV volumes are not nearly as reliable. As a result, accurate RV ejection fraction assessments have proved elusive, and thus most measures of RV function employ changes in RV dimension or area. Future use of three-dimensional echocardiography should make RVEF assessment more accurate and feasible.
The most common and arguably least ideal method of RV function assessment by echocardiography is visual estimation. The echocardiographer visually integrates the relative change in RV cavity area to estimate global RV systolic function, typically reporting RV function as normal, mild, moderate, or severely reduced. However, the inherent limitations of RV imaging combined with reader subjectivity lends to significant inter-observer variability, with unreliable or highly inconsistent reporting of RV function. Thus, one must be very cautious in how to interpret RV function by this method, as one reader's “severe” may be another reader's “mild” RV dysfunction.
A more quantitative approach is to measure the total systolic area change of the RV, referred to as the RV fractional area of change (RVFAC). This measure is derived from the planimetered areas of the RV at end-diastole and end-systole ([RVFAC=RV Area ED -RV areaES/RV AreaED] × 100) from the apical four-chamber view. The RVFAC does not require geometric assumptions and correlates with the RV ejection fraction.[27] However, incomplete visualization of the RV cavity (more common in the setting of RV enlargement) as well as suboptimal endocardial definition lead to relatively high inter- and intra-observer variablility.[28,29]
As mentioned above, differences in muscle fiber orientation of the RV dictate that there is proportionally greater RV longitudinal shortening in the RV than in the LV.[3] In a recent study, longitudinal fractional area change (LFAC) accounted for the majority of total RVFAC (77%) in normal subjects.[30] Others have shown that longitudinal systolic displacement of the RV base toward the RV apex (referred to as tricuspid annular plane systolic excursion, or TAPSE) correlates strongly (r=0.79-0.92) with RV ejection fraction derived from radionuclide angiography.[4,31] The predominantly longitudinal contractile pattern of the RV can be exploited in order to assess RV systolic function.
TAPSE can be derived from 2D echo or M-Mode (fig. 6a–c), is simple to perform and has been shown to be highly reproducible, owed in part to the lack of reliance on RV endocardial definition or geometric assumptions.[4,29] Evidence from prior studies indicates that a normal TAPSE is 2.4-2.7 cm, with lesser values indicating mild (2.0-2.3 cm), moderate (1.5-1.9 cm) and severe (<1.5 cm) RV dysfunction.[32,33] A TAPSE<1.8 cm predicts a stroke volume index <29 ml/m2 with 87% accuracy, and is associated with increased hospitalization rates for right heart failure and decreased survival in patients with PAH.[29,31] Ghio et al. recently showed in a PAH cohort that a TAPSE≤1.5 cm was associated with a nearly three-fold higher event rate (death or emergent lung transplant) versus subjects with a TAPSE>1.5 cm.[34]
Figure 6.
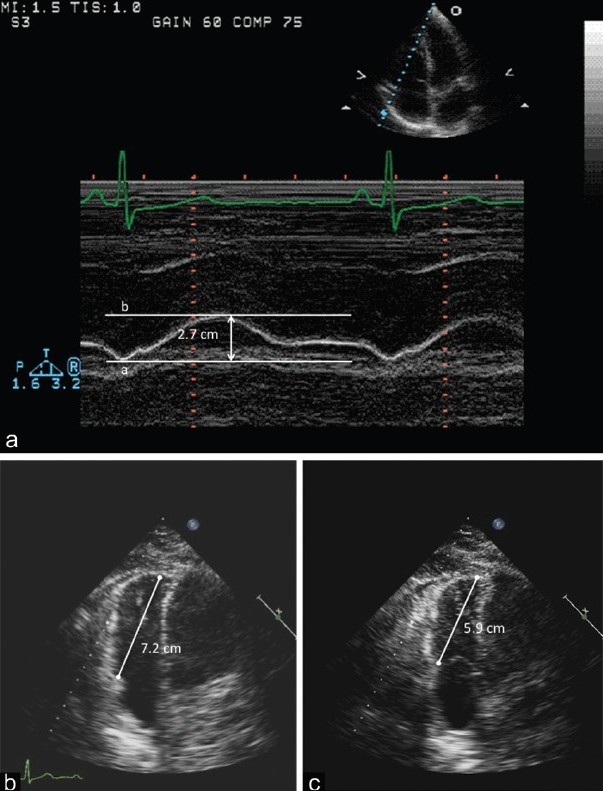
Tricuspid annular plane systolic excursion (TAPSE) in M-mode obtained in the apical four chamber view. The distance between the enddiastolic (a) and end-systolic (b) represents TAPSE (2.7 cm). Panel B represents end-diastolic measurement (7.2 cm) from the apex to the tricuspid valve plane. Panel C represents the end-systolic measurement (5.9 cm) from the apex to the tricuspid valve plane. The difference between these two measurements is the 2-D TAPSE (1.3 cm). M-mode is more commonly used, but the methods yield comparable results.
Tissue Doppler imaging (TDI) can also be used to measure the velocity of RV contraction in the longitudinal axis (denoted S‘ or Sa), correlates with TAPSE (r=0.90), and is another simple and reproducible method of RV function assessment[35] (Fig. 7). An S’ <10 cm/sec predicts a cardiac index <2.0 l/min/m2 with 89% sensitivity and 87% specificity.[36] In addition, the RV TDI signal can be integrated to measure the longitudinal tissue displacement.[37] Using ROC curve analysis, an RV tissue displacement >1.5 cm predicted an RV stroke volume index ≥30 ml/m2 (AUC 0.79); changes in RV tissue displacement related strongly to changes in RV stroke volume index in response to intravenous epoprostenol infusion.
Figure 7.
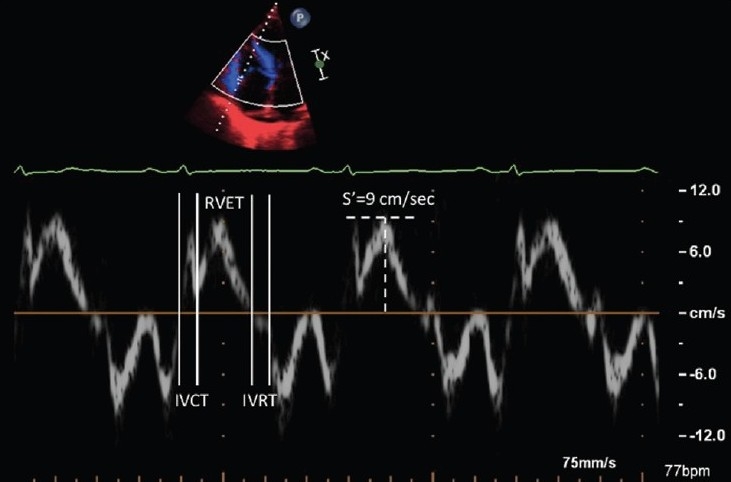
Right ventricular Tissue Doppler imaging along the basal long axis of the right ventricular free wall. The longitudinal shortening is labeled S’ and is measured at 9cm/sec. Right ventricular myocardial performance index can be obtained from the isovolumic contraction time (IVCT), relaxation time (IVRT), and ejection time (RVET).
The myocardial performance index (MPI or Tei-Doppler index) uses a different approach to RV function assessment, integrating systolic and diastolic function parameters in a single measure, using the formula IVRT+IVCT/RVET, where IVRT is the RV isovolumic relaxation time, IVCT is the isovolumic contraction time, and RVET is the RV ejection time. The time intervals are typically derived from tissue Doppler signals (Fig. 7). Increasing values represent worsening function, with an increased RV MPI associated with decreased survival in PAH.[38] In certain centers, RV MPI is a standard noninvasive measure of global RV function, whereas other centers have found the method somewhat cumbersome and thus is used less often in clinical practice.
All of the clinically used noninvasive methods of RV (and LV) function are load-dependent, and thus will change in response to different loading conditions, most notably RV afterload. The afterload sensitivity of these RV function measures may be viewed as a strength or weakness. A strength, in that the vast majority of RV dysfunction in the setting of PVD is indeed afterload-dependent and thus it is desirable that these measures will track with changes in RV afterload. A weakness, in that a fall in TAPSE, for example, does not indicate the intrinsic, load-independent performance of the RV (RV contractility). This distinction becomes clinically relevant when a patient with PAH is referred for lung vs. heart-lung transplantation, and the question is raised as to whether normalizing RV afterload with lung transplant will be sufficient to allow for RV function recovery.
Indirect measures of RV systolic function
The fundamental response of the relatively non-muscular RV to progressive increases in RV afterload is a fall in RV systolic function. In most forms of PVD (save chronic systemic to pulmonary shunts), the rise in RV afterload occurs relatively quickly, which in turn impedes RV ejection and increases RV wall tension. Due to the relative compliance of the RV and RA, this leads to increased chamber size, which in part, helps restore RV stroke volumes closer to baseline (heterometric autoregulation). As a result, increases in right heart chamber size can be thought of as an important indirect measure of RV systolic dysfunction. The normal RV measures approximately 2.5-3.5 cm at end-diastole, with a planimetered area of 15-18 cm2.[39] Typically, the RV dimension and area are two-thirds that of the LV. Expressing RV size as a ratio of RV:LV dimension is especially practical and is easily derived from the apical four chamber view, where the RV and LV are viewed side-by-side. The normal RV:LV ratio is approximately 0.6-0.8, with increasing RV:LV ratios in patients with mild (0.8-1.0), moderate (1.1-1.4), and severe (≥1.5) RV dilatation. A useful rule of thumb is that the RV:LV ratio should be <1.0, and any value >1.0 is strongly suggestive of RV dilatation, often coinciding with RV dysfunction. Similarly, the angle and position of the RV apex change in response to increased RV afterload, thus leading to an overall change in RV shape. Normally, the RV apex forms a relatively acute angle and does not form, or occupy the apex of the heart. Thus, in the apical four chamber view, the normal RV has a triangular or sickle shape. In the setting of PVD, the RV apical angle often “opens” and the RV and LV will often “share” the apex of the heart, taking on a more oblong shape (Fig. 8). Lopéz-Candeles showed that a relatively large or “open” RV apical angle was a common finding in the setting of chronic pulmonary hypertension, relating inversely to decreases in TAPSE and RV fractional area change.[40] The RA:LA ratio should also not exceed 1.0. Moreover, the direction of interatrial septal bowing can provide important information as to the relative pressure differences in the right and left atrium.
Figure 8.
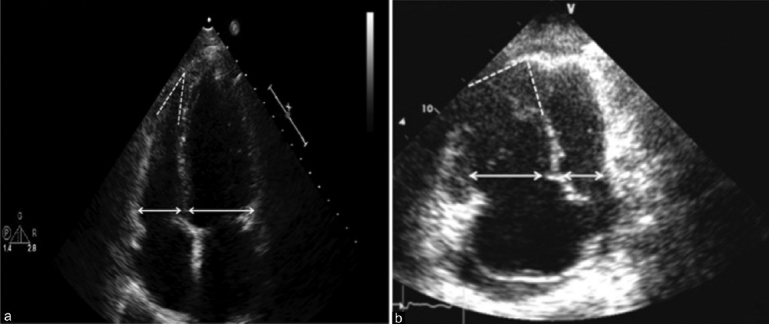
Apical four chamber view. Panel A demonstrates normal RV:LV size ratio (<1.0) and shape, with a preserved acute angle of the RV apex in a patient either without PH or with pulmonary venous hypertension. Panel B represents a patient with PAH or another form of PH with pulmonary vascular disease. Note the RV:LV ratio is increased (>1.0), the angle of the apex is less acute, and the RV is apex-sharing with the LV.
Unlike mitral regurgitation, which occurs due to either intrinsic mitral valve (MV) disease (i.e., myxomatous mitral valve disease, rheumatic heart disease) or secondary regurgitation from LV dysfunction, the vast majority of cases of TR occur secondary to RV dysfunction and tricuspid annular dilatation. As a result, TR is a common accompanying feature of RV dysfunction, with greater degrees of TR typically signifying greater degrees of RV decompensation. Moreover, the rate of rise in TR velocity provides qualitative insight into RV systolic function, and forms the basis for estimating RV dP/dt by Doppler[41,42] (Fig. 9).
Figure 9.
Continuous wave Doppler interrogation across the tricuspid valve. Panel A demonstrates a rapid rise in the peak velocity of TR envelope consistent with preserved RV function. Panel B demonstrates a slower rise to peak velocity consistent with significant right ventricular dysfunction.
As the right heart progressively dilates, the nondistensible pericardium becomes an increasingly important determinant of ventricular diastolic function and diastolic ventricular interaction (pericardial constraint). Once the pericardial space has been fully occupied by a dilated right heart, further increases in RV size lead to diastolic septal bowing from right to left, with reciprocal reductions in LV (and LA) chamber size.[43] Systolic flattening of the septum is also common in PVD, and likely occurs due to a delay in the time to peak RV contraction, creating mechanical RV/LV asynchrony[44] (Fig. 10). Magnetic resonance imaging studies have shown relatively strong correlations between the degree of RV systolic septal bowing and pulmonary vascular resistance.[45,46] Importantly, even mild systolic septal flattening is a distinctly abnormal finding, and occurring in relative isolation, is often one of the earliest signs of underling PVD and pulmonary hypertension.
Figure 10.
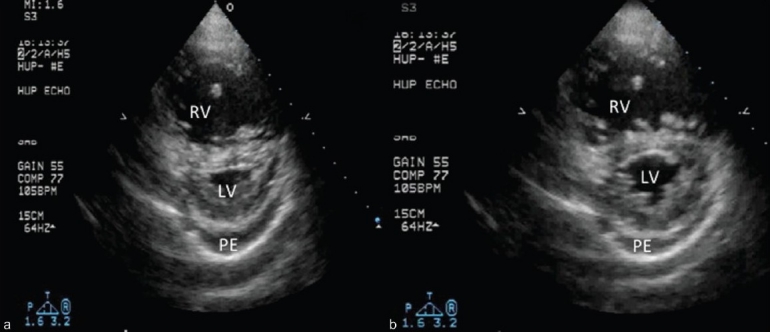
Short axis image at the midventricular level. Note the difference in the degree of septal flattening between systole (A) and diastole (B). The predominant systolic septal bowing is typical for PAH and other pulmonary vascular disease states. Also note the mild-moderate, circumferential pericardial effusion (PE), a common accompanying feature of the decompensated right ventricle.
Eventually, septal bowing leads to impaired early diastolic filling of the left heart. Thus, a common Doppler feature in PVD with RV dysfunction is Doppler evidence of “diastolic dysfunction” (i.e., “E to A reversal” of the transmitral Doppler pattern).[47] However, Doppler evidence of diastolic dysfunction should not be considered synonymous with left atrial hypertension. Thus, it is important to develop a sense, noninvasively, for whether a patient's Doppler evidence of diastolic dysfunction is the cause of the PH or instead, is a marker of impaired LV filling related to RV dysfunction and septal bowing. This will be discussed in further detail below.
In the setting of PAH, a mild to moderate circumferential pericardial effusion is seen in up to half of patients, and is particularly common at the time of initial clinical presentation.[48] In general, a pericardial effusion typically indicates right heart decompensation, and is likely conferred on the basis of longstanding right atrial hypertension and impaired myocardial lymphatic drainage.[49] The presence of a pericardial effusion has been one of the most consistent echocardiographic findings indicative of a poor prognosis in PAH.[7,48] Importantly, the temptation to pursue percutaneous or surgical pericardial drainage should be avoided unless there is especially compelling evidence of tamponade, as the effusion typically is the result (not the cause) of RV failure and right atrial hypertension. Hemnes et al. reported that attempted drainage of pericardial effusions in patients with PAH has been associated with very poor outcomes, with most deaths occurring within 12-24 hours of the procedure.[50] In our experience, pericardial effusions in PAH progressively decrease in size or resolve over weeks or months as the RV failure responds to diuresis and pulmonary vasodilator therapy.
Thus, there are numerous ways to quantify right ventricular function, either directly or indirectly. Often, the limitations of the DE examination are so frequently cited that echocardiography laboratories, including at major academic medical centers, do not have a single quantitative measurement of RV function in their clinical echo protocol. This is unfortunate, as the inability to obtain an RV ejection fraction, for instance, should not be interpreted to mean that RV function cannot be assessed. It is important that clinical echo protocols include basic measurements of RV size, the relative proportion of the RV to the LV, and a direct measurement of RV systolic function. Whether the direct RV function assessment be RVFAC, TAPSE, RV TDI or another measurement is perhaps not as important as the laboratory making that particular measurement consistently, and properly, such that the sonographers, echocardiographers, and clinicians can develop an understanding of ‘their’ measurement so that it may be optimally integrated into clinical practice.
DOPPLER HEMODYNAMIC ASSESSMENT
Pulmonary vascular resistance
An elevated pulmonary vascular resistance (PVR) is the sine qua non of pulmonary vascular disease. Thus, a reliable, simple and noninvasive method of PVR assessment would be of great value. Abbas et al. showed that the ratio of trans-tricuspid flow velocity (surrogate of pressure) to the velocity-time interval obtained from the RV outflow tract (surrogate of flow) closely correlates to PVR in a population of patients with an average PVR of 2 mmHg/l/min.[51] This approach proved much less reliable in subjects with a PVR>8 mmHg/l/min.[52] This method is also, in actuality, an estimate of total pulmonary resistance, as there is no accounting for left atrial pressure. Thus, in a patient, or population of patients with significant left atrial hypertension, this formula would consistently lead to significant overestimations of the PVR and wrongly implicate pulmonary vascular disease as the cause of the PH in a patient with pulmonary venous hypertension. We will discuss a simpler approach to PVR estimation below.
Cardiac output
Cardiac output can be estimated by Doppler examination, employing the formula Q=A×V (Q=flow; A=cross sectional area; V=flow velocity. Typically, the LV outflow tract is used as the site for Doppler interrogation, as LVOT dimensions and flow velocity are more easily obtained than in the RV outflow tract. The flow velocity envelope is integrated to obtain the velocity time integral (VTI). Heart rate is recorded. The cardiac output is then estimated using the following formula: CODoppler =[VTILVOT×(diameter of LVOT)2×(0.785)]×heart rate. Several studies have shown reasonable correlations between Doppler and invasively derived cardiac output.[53] In a cohort with moderate or severe PH, Doppler-estimated CO correlated reasonably well with invasive CO (r=0.74), however there were substantial discrepancies between values on an individual patient basis. Using a simpler approach, an RV outflow tract VTI<12 cm predicted a cardiac index <2.2 with a sensitivity and specificity of 86% and 71%, respectively.[29] Likewise, a TAPSE<1.8 cm or an Sa<10 cm/sec also are strong predictors of a low cardiac index.[29,36] Thus, even if precise CO estimation is not feasible, easily obtained Doppler and 2D echocardiographic measures can still provide useful information in identifying patients with a low cardiac index.
Integrated assessment of RV-PA interaction
Doppler interrogation in the RV outflow tract can provide important information in the patient with known or suspected pulmonary vascular disease, as this is a key anatomic and physiologic interface between the RV and pulmonary vasculature.
Pulsed wave Doppler interrogation in the RV outflow tract is performed just proximal to the pulmonic valve, with the goal being to obtain a flow velocity envelope (FVE) without pulmonic valve artifact. The AcT measured as the time from baseline to peak velocity) is measured from this envelope, and most commonly is used to estimate mean pulmonary artery pressure, as mentioned above.[24] Aside from the AcT however, the shape of the FVE can be used to qualitatively differentiate varying levels of pulmonary hypertension. Prior work has shown that a rounded FVE has been associated with normal PA pressures, while patients with mild-moderate PH more often have a triangular, or dagger-shaped FVE (often with late-systolic notching), while those with severe PH typically manifest prominent midsystolic notching of the FVE (Fig. 11). However, these same authors pointed out that only 53% of patients with PH evidenced a notched FVE, suggesting that pressure is an associate, but not the actual physiologic cause of this notching pattern.
Figure 11.
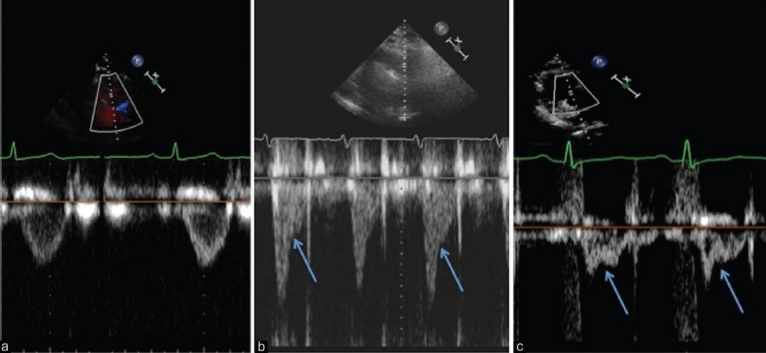
Pulsed wave Doppler signals from the RV outflow tract. Panel A demonstrates a non-notched flow velocity envelope. Panel B is more triangular with a late-systolic notching pattern. Panel C has a pronounced mid-systolic notching pattern. The difference in the shape of the Doppler patterns is largely determined by differences in pulmonary vascular resistance, not PA pressure.
The actual cause of Doppler notching in the RV FVE is early arrival of reflected arterial waves from the pulmonary vasculature, leading to “real-time” impedance to flow.[54] This was initially described in the setting of acute and chronic pulmonary emboli, relating to the introduction of a more proximal site of wave reflection owed to proximal clot burden.[55,56] However, Torbicki et al. showed that the time to midsystolic flow deceleration of the FVE did not differ between patients with chronic thromboembolic pulmonary hypertension (CTEPH) and idiopathic PAH (IPAH).[55] Thus, exaggerated wave reflection is likely present in other forms of PH (i.e., PAH) aside from thromboembolic disease, and that analyses of RVOT Doppler FVE may be applied more broadly to detect pulmonary vascular disease in a referral population of PH patients.
Recent work reported on the hemodynamic differences seen among a cohort of 79 patients (patients with acute and chronic pulmonary emboli excluded) with undifferentiated pulmonary hypertension, on the basis of differences in the shape of the Doppler FVE.[57] The normal PW Doppler profile in the RV outflow tract (RVOT) is smooth, parabolic, without “notching” of the Doppler envelope (Fig. 11, panel A). In contrast to early reports, this study showed that the absence of Doppler notching did not indicate a lack of PH. Instead, the lack of Doppler notching was strongly associated with PH arising from increased left atrial pressure in the absence of pulmonary vascular disease. In contrast, in the presence of an increased pulmonary artery stiffness and a high PVR, reflected waves will return to the RV during systole, impede RV ejection and cause "notching" of the Doppler profile (Fig. 11, panels B, C). A mid-systolic notch pattern is especially abnormal, and associated with an average PVR>8 Wood Units (WU), along with moderate to severe RV dysfunction. A notched Doppler pattern was present in 100% of incident cases of PAH, and predicted a PVR>3 WU with an odds ratio of 22:1.[57] These findings suggest that notching of the FVE is more indicative of pulmonary vascular disease (high PVR, low compliance) than pulmonary pressure, and helps explain why notching is present in some, but not all patients with PH. Thus, visual inspection of the RVOTDoppler profile represents a simple, rapid method of gleaning insight into the relative presence (‘notched’ pattern) or absence (‘no notch’ pattern) of pulmonary vascular disease. We have found this approach to be extremely useful and applicable in clinical practice. Potential future applications of FVE analysis include its use as a screening tool to predict present or future development of PAH in high-risk conditions such as scleroderma, and whether serial changes in notching coincide with clinical and hemodynamic changes in PVD patients on medical therapy.
ECHO-DOPPLER FINDINGS IN PULMONARY VASCULAR DISEASE
PAH
The relatively non-muscular, compliant RV is put at a distinct physiologic disadvantage in PAH and other PVD states, yet these same characteristics allow the RV to act as a relatively reliable “transducer” of its increased vascular load. Therefore, the triad of decreased RV systolic function, increasing RV size, and septal bowing form the fundamental basis for the echocardiographic recognition of PAH, with or without demonstration of an increase in Doppler estimated PA systolic pressure.
In 1973, Goodman et al. published one of the first studies describing the echocardiographic features of IPAH.[58] They noted that all patients had RV dilatation, and half had an RV dimension greater than their LV dimension. In addition, patients commonly demonstrated abnormal, or paradoxical, septal motion, where the interventricular septum moved away from the center of the LV cavity in systole. This occurs when the curvature of the septum is convexed toward the LV at end-diastole, such that LV systole serves to ‘push’ the septum toward the RV. Aside from being a common echo feature in PAH, the relative loss of inward septal motion can account for a mild loss of LV systolic function in PAH, and thus low-normal or mildly reduced LV function can occur in PAH on this basis.[59] In a larger series, Bossone et al. showed that 96% of patients had a Doppler estimated pressure >60 mmHg at diagnosis, however, the overall correlation between Doppler and invasive pressure estimates was relatively low (r=0.31). The time to peak velocity (AcT) in the RV outflow tract was <100 ms in 94% of subjects. Ninety-eight percent of subjects had RV enlargement whereas three quarters of the patients had qualitatively reduced RV systolic function. Systolic flattening of the interventricular septum occurred in 90% of subjects. Moderate or severe tricuspid regurgitation occurred in 80% of subjects, whereas mild to moderate mitral regurgitation was present in only one patient. A small or moderate sized pericardial effusion was noted in about 16% of subjects. The average ratio of transmitral Doppler E wave velocity to A wave velocity (E/A ratio) was 0.93, with 70% of subjects demonstrating “E to A reversal,” typically denoted Grade I LV diastolic dysfunction. Importantly, all subjects in this study were shown to have normal left atrial pressure by right heart catheterization, underscoring the fact that Doppler evidence of ′diastolic dysfunction‘ is not necessarily synonymous with left atrial hypertension. In fact, the pattern of “E to A reversal,” also referred to as grade I diastolic dysfunction, typically equates to normal left atrial pressure, reflecting the necessary redistribution of LV filling into late diastole that must occur when LV relaxation is impaired in the context of a normal LV filling pressure.[60] In clinical practice, the presence of any or all of the triad of findings of RV dysfunction accompanied by grade I diastolic dysfunction, is a strong indicator of severe pulmonary hypertension in the context of a normal left atrial pressure and high pulmonary vascular resistance.
Subsequent studies have reported on the clinical and prognostic significance of many of the typical echo-Doppler findings in PAH. Earlier studies focused on more indirect measures of RV dysfunction, such as right heart dilatation, septal bowing, pericardial effusion and TR severity. Eysmann showed that the presence and severity of a pericardial effusion is a strong independent predictor of mortality in PAH. Similarly, a mitral E/A ratio <1.0 was a strong predictor of adverse outcome.[61] Raymond et al. also showed that the presence of a pericardial effusion, along with an increased right atrial area index were predictive of mortality.[62] Eysmann et al. showed that a peak pulmonic flow velocity >60 cm/sec was predictive of a drop in PVR of >30% on acute vasodilator testing; none of the patients with a peak velocity <60 cm/sec were vasoreactive.[63] Likewise, decreased left ventricular and left atrial area, increasing RV:LV area ratio, and the degree of leftward septal bowing are also associated with an increased risk of systemic hypotension in response to calcium channel blocker therapy, likely reflecting the inability to sufficiently recruit RV stroke volume to overcome the drop in systemic vascular resistance.[64]
Subsequent studies have focused on more direct assessment of RV systolic function. In a retrospective study by Tei et al., the mean RV MPI of patients with IPAH (0.83) was higher than in healthy controls (0.28), and patients with an RV MPI≥0.83 had <10% event free survival at five years, vs. >70% in those with an RV MPI<0.83.[38,65] A prospective study in patients with IPAH and PAH associated with connective tissue disease showed that a TAPSE<1.8 cm was associated with lower invasively derived stroke volume index, higher right atrial pressure, greater RV dilatation, right to left heart disproportion, septal bowing and a higher incidence of pericardial effusion. Two-year survival estimates were 88% and 50% for patients with a TAPSE≥1.8 cm and <1.8 cm, respectively.[29]
The typical changes in RV size, function, and septal position have been shown to improve in response to varying therapies. Following four months of therapy with bosentan in patients with PAH (84% IPAH, remainder PAH associated with CTD) serial DE examination showed an improved RV MPI, reduced RV end-systolic area and RV:LV diastolic area ratio, improved early diastolic LV filling, and decreased pericardial effusion scores.[66] The peak TR velocity did not fall significantly, suggesting either no significant change in PASP or a drop in PASP that was not detectable by Doppler method. Similarly, following three months of intravenous epoprostenol infusion, RV size decreased as did peak TR velocity and the noninvasive PVR estimate; the RV MPI did not change in response to epoprostenol infusion.[67] Preliminary data showed that 21 of 27 subjects with PAH increased their TAPSE>0.2 cm (mean+0.5 cm) after six months of PH specific therapy, and that these subjects exhibited improvements in six minute walk distance (median+115 meters), BNP (–210 pg/ml) and NYHA class (–1.0 functional class). There were no deaths or right heart failure admissions in those with a TAPSE was ≥2.0 cm at six month follow up on PH specific therapy vs. two deaths and four right heart failure hospitalizations in those with a TAPSE <2.0 cm on follow up.[68]
Chronic pulmonary embolism
CTEPH is an uncommon complication of prior acute pulmonary emboli.[69,70] The major site of vascular impedance is often the proximal pulmonary vasculature, owed to the persistence of clot and vessel remodeling in the affected area. However, small vessel pulmonary arteriopathy is also known to occur in CTEPH, such that the degree of PVR elevation may be equal or greater to that seen in IPAH.[71] The end result is often that the overall burden of pulmonary vascular disease is comparable to that in PAH, and in some cases, worse due to the added hemodynamic load from the proximal obstruction. Thus, the typical triad of RV dysfunction, RV dilatation, and septal bowing is present in CTEPH and is largely indistinguishable from the various forms of PAH. Nevertheless, there are hemodynamic differences between CTEPH and PAH that can aid in differentiating the two conditions. Namely, in CTEPH, the presence of a discrete proximal obstruction leads to more exaggerated, earlier arrival of arterial reflected waves and thus a more pulsatile pulmonary vascular bed.[56] This increased pulsatility can be expressed as the fractional pulse pressure (FPP=PA pulse pressure/mean PA pressure); the typical FPP is 0.8 in PAH and ≥1.4 in CTEPH.[72,73] The FPP can also be estimated by Doppler, with a noninvasive FPP of 1.35 predicting CTEPH with a sensitivity of 95% and specificity of 100% over IPAH.[74]
Serial DE exam following pulmonary endarterectomy (PEA) has shown increases in RV fractional area change as well as reductions in RV size, decreased septal bowing, and improved early diastolic LV filling.[75,76] An interesting study by Hardziyenka et al. showed that patients with early arrival of arterial reflected waves, as measured by a shorter time to notching of the pulmonary FVE, were the only CTEPH patients to benefit from PEA.[77] These findings prove that simple FVE analysis was able to predict clinical response to PEA and that a requisite degree of pulmonary vascular impedance and arterial wave reflection is needed in order for sufficient RV-PA recoupling to occur following surgical intervention.
Acute pulmonary embolism
Acute pulmonary embolism, and especially large, proximal emboli lead to a sudden increase in the pulmonary vascular impedance without a marked rise in the pulmonary artery pressure. This relates to the fact that the normal RV is typically incapable of generating a sufficient stroke volume to maintain a PA systolic pressure >60 mmHg (mean pressure of 40 mmHg) when suddenly uncoupled from a normal pulmonary vascular bed.[78,79] As a result, RV failure and cardiogenic shock may ensue despite a mean PA pressure between 20-40 mmHg.[80] Thus, it follows that the degree of RV dysfunction (not PA pressure) predicts the extent of perfusion defects by ventilation/perfusion scan.[81] In contrast, small subsegmental pulmonary emboli that are not associated with a marked rise in PA impedance will not lead to abnormal DE findings, highlighting the fact that the DE examination is insufficient to rule out an acute PE.[82] The relative degree of pulmonary hypertension helps establish the chronicity of the embolic event, as the average trans-tricuspid flow velocity in acute proximal pulmonary emboli (3.0 m/sec) is significantly lower than in patients with subacute PE (4.2 m/sec).[79] In contrast, patients with acute PE with a PASP>50 mmHg at the time of diagnosis are at increased risk of persistent pulmonary hypertension at one year follow up.[83]
From a physiologic viewpoint, acute PE is an important and often dramatic clinical example underscoring the concept that pulmonary artery pressure is a poor measure of RV afterload. In fact, the relative disconnect between vascular impedance and PA pressure forms the basis for several relative “signature” DE findings in the setting of an acute pulmonary embolism. RV dilatation is almost universally present in the setting of a large PE, as the normally compliant RV will rapidly distend in response to the increased vascular load. However, unlike in PAH or other forms of chronic pulmonary vascular disease, RV hypertrophy will be conspicuously absent, and thus a simple qualitative clue for acute PE is RV dilatation and dysfunction in the relative absence of RV hypertrophy. Another common DE finding in acute PE is “McConnell's sign,” which is visually appreciated as RV dysfunction along the RV base and mid segments, with a hinge point or “buckling” of the RV free wall near the RV apex.[84] This relative “sparing” of RV apical function most likely relates to tethering of the RV apex by a normal or hyperdynamic LV, via forces transmitted across the interventricular septum and interlaced muscle fibers shared by the RV and LV. Others have shown that the RVEF, RV TDI (Sa), and TAPSE are reduced in the setting of an acute PE.[85] A characteristic Doppler finding in acute PE is the “60/60 sign,” which refers to a markedly shortened AcT (<60 msec) in the FVE owed to the increased pulmonary artery impedence, combined with a PA systolic pressure <60 mmHg.[86]
Another important finding to look for on the initial DE examination is right-sided heart thrombi or thrombi-in-transit, which complicate approximately 4% of cases of acute pulmonary emboli.[87] Thrombi may be visualized within the right atrium, ventricle, and occasionally, are seen straddling the interatrial septum. Right heart thrombi are a very high-risk feature, typically associated with prior massive PE, severe RV dysfunction, and high in-hospital mortality.[87] In such cases, more aggressive strategies such as thrombolysis, catheter-based, or surgical embolectomy are typically warranted.[87,88]
Systemic to pulmonary venous shunts
A detailed overview of the various DE perturbations associated with the numerous forms of congenital systemic to pulmonary shunts (SPS) is beyond the scope of this review. Suffice to say that a variety of 2D and Doppler findings are associated with shunting at the venous, atrial, and ventricular levels. We will focus on the general principles of RV structure and function in this context as well as basic shunt assessment.
In the case of smaller shunts, or larger shunts at an earlier stage in the disease process, the RV is primarily subject to an increased volume load. Due to the relative compliance of the RV, volume loading is generally well tolerated which is likely why these lesions can go unnoticed for decades. In this circumstance, the primary DE findings are RV dilatation in the context of normal or hyperdynamic RV function. Owed to the increased RV preload in the face of normal RV afterload, a dilated and hyperdynamic RV is an important initial clue to the presence of a left to right shunt. On short axis, there is often bowing of the interventricular septum from right to left that is isolated to diastole. The degree of pulmonary hypertension varies, most often in direct relation to the size of the shunt and thus the amount of pulmonary blood flow. Herein lies another example of the relative disconnect between PA pressure and RV afterload, as the increased pressure is owed to, but not opposing, pulmonary blood flow.
With time, excess pulmonary blood flow can lead to marked remodeling of the pulmonary vasculature, with the PVR reaching levels equal or greater to that seen in other forms of PAH. Under these conditions, the RV must accommodate the persistent volume load as well as a marked increased in RV afterload. However, unlike other forms of PAH, in the setting of a SPS, the rise in RV afterload occurs relatively slowly, often over decades. As a result, the structure and function of the RV is often markedly different in this context, particularly in the presence of Eisenmenger syndrome. Typically, the RV cavity is normal in size, maintains a relatively normal proportion relative to the LV, and exhibits marked concentric hypertrophy.[89] Right ventricular hypertrophy can often be appreciated by both thickening and excess RV trabeculations, along with a very conspicuous moderator band; these findings alone can often help distinguish PAH related to a SPS from other forms of PAH. RV dilatation and dysfunction in the setting of a chronic SPS is especially worrisome and often coincides with very late stage disease.
An initial shunt assessment is often performed using rapid injection of agitated saline (“bubble study”), which opacifies the right heart chambers and allows for detection of both right to left shunts (early passage of bubbles from right to left) or left to right (via a negative contrast jet created from the passage of blood into the opacified right heart chamber). Shunt quantification by Doppler is expressed in the same way as measured by cardiac catheterization, by the ratio of pulmonary to systemic blood flow. Doppler flow in the RV outflow tract (Qp) and LV outflow tract (Qs) are assessed to derive the Doppler Qp/Qs ratio. The RVOT diameter is typically about 0.5- 1.0 cm greater than the LVOT diameter; given that flow is equal to the product of cross sectional area and velocity, it follows that the integrated flow velocity signal (VTI) in the RVOT is typically less than the VTI in the LVOT. Thus, an initial clue to a sizeable left to right shunt is when the RVOT VTI is equal or greater than the LVOT VTI. Shunt localization by DE is performed by first assessing for 2D evidence of interatrial or interventricular septal defects. Further characterizations, including blood flow direction, blood flow velocity and estimated pressure gradients across shunts can be performed by color, pulsed wave and continuous wave Doppler examinations. Proper DE examination in the case of known or suspected congenital heart disease is best performed by a sonographer/echocardiographer who are trained in the assessment of patients with congenital heart disease. Three-dimensional DE as well as cardiac magnetic resonance imaging can provide further characteristics of the location and defect size that assist in the treatment strategy of the SPS. Further SPS severity and shunt fraction quantification requires cardiac catheterization.
ECHO-DOPPLER FINDINGS IN PULMONARY VENOUS HYPERTENSION
By far the most common cause of pulmonary hypertension relates to passive elevation of the pulmonary artery pressure due to an increase in left atrial pressure. A variable degree of “reactive” pulmonary vascular remodeling may occur, typically relating to the severity and chronicity of the left atrial hypertension.[90,91] As a result, patients with pulmonary venous hypertension comprise a large percentage of patient referrals for pulmonary hypertension evaluation. Thus, an understanding of the noninvasive manifestations of pulmonary venous hypertension is critically important in the initial approach to patients with undifferentiated pulmonary hypertension.
It follows that the noninvasive predictors of pulmonary venous hypertension include two-dimensional and Doppler findings that either reflect or predispose to left atrial hypertension, as well as more direct Doppler estimates of increased left atrial pressure.[92,93] Importantly, the LV ejection fraction is a very poor predictor of left atrial hypertension, and thus a normal ejection fraction in no way, provides reassurance that the left atrial pressure is normal.
The two-dimensional echocardiographic examination can provide compelling initial evidence that either supports or refutes the presence of left atrial hypertension. One of the first clues to past or present left atrial hypertension is left atrial enlargement. This should certainly not be considered a physiologic measurement of left atrial pressure, however increasing LA size typically denotes chronically increased left atrial impedance and either the presence of, or predisposition for increased LA pressure. Left atrial enlargement is best appreciated in the parasternal long axis view, with a LA dimension at end-systole of 4.0 cm generally being the accepted cutoff. As an initial visual clue to LAE, one can simply look at the size of the LA relative to the aortic root, which is seen just anterior to the LA in this view; when the LA size exceeds aortic root size, this typically indicates LAE. Another important finding is the presence of left ventricular hypertrophy; LVH, even when mild, denotes chronic remodeling of the LV, typically the result of longstanding systemic hypertension. Even mild concentric LVH is a significant form of structural left heart disease, and is typically associated with increased LV chamber stiffness. Melenovsky et al. showed that left atrial size (expressed as left atrial volume), LV mass index, and the product of these two variables, were the strongest discriminants of non-systolic heart failure from hypertensive heart disease without a history of heart failure.[94]
In the context of pulmonary venous hypertension, the interventricular septum will typically maintain a normal configuration on short axis imaging, convexed toward the right ventricle. Thus, the LV cavity will retain its round shape in both systole and diastole, with no evidence of septal flattening. In the apical four chamber view, the ratio of RV:LV dimension (or area) will typically remain <1.0, with the RV apex maintaining its sharp apical angle, with the LV forming the apex of the heart alone. Thus, the RV dysfunction ‘triad’ is conspicuously absent in most cases, consistent with a lack of pulmonary vascular disease.
The Doppler examination also provides important physiologic information with respect to valvular function, diastolic function, and left atrial pressure assessment. As a general statement, moderate or greater dysfunction of either the aortic or mitral valve is relatively uncommon when PVD is the primary source of the increased PA pressure. This is particularly true of the mitral valve. Of course, moderate or greater mitral stenosis is well known to cause severe pulmonary hypertension, largely on the basis of passive pulmonary venous congestion. However, moderate or greater mitral regurgitation is also distinctly uncommon in the setting of PAH, and therefore also provides compelling evidence for a pulmonary venous source of PH.[60] Importantly, MR severity can be underestimated by transthoracic Doppler imaging, especially when the MR jet is eccentric and off axis. Thus, complete Doppler interrogation using multiple different imaging planes is often required in order to appreciate the full extent of the MR. If there is clinical suspicion that the degree of MR is greater than reported by transthoracic DE examination, a TEE should be performed to obtain a more comprehensive structural and physiologic assessment of the MV.[95,96] Pulsed wave Doppler evidence of systolic pulmonary vein flow reversal also indicates severe MR, and represents the Doppler associate to large V waves in the left atrial pressure tracing.[96]
Lastly, Doppler interrogation of the mitral valve inflow provides a key component to the patient with known or suspected pulmonary hypertension. In normal sinus rhythm, left ventricular filling can be divided into an early, passive phase and a late, active phase. Pulsed wave Doppler interrogation across the mitral valve allows for quantification of these events, with the E wave and A wave Doppler envelopes corresponding to the early and late diastolic events, respectively. In normal individuals, in the absence of structural left heart disease, the E/A ratio is >1.0 with a transmitral E wave deceleration time (DT) between 160-240 msec, indicating that the bulk of LV filling occurs passively in early diastole as left atrial pressure exceeds diastolic ventricular pressure; atrial contraction serves to complete LV filling at end-diastole. The transmitral pattern can be altered in one of three ways, often expressed as Grades I, II, and III diastolic dysfunction.[61] In Grade I diastolic dysfunction, the E/A ratio is <1.0 with a DT>240 msec, denoting a redistribution of left ventricular filling into late diastole due to impaired LV relaxation and typically, a normal left atrial pressure. Grade I diastolic dysfunction is a common feature seen in healthy persons over the age of 60, however may occur at any age in persons with structural left heart disease (i.e., LVH/hypertensive heart disease, impaired LV systolic function). As mentioned previously, an E/A ratio <1.0 is also a common finding in PAH, and is typically caused by RV enlargement, septal bowing and an abnormal diastolic ventricular interaction that impedes LV relaxation. Thus, the presence of Grade I diastolic dysfunction should not dissuade one from suspecting PAH or another PVD-related cause of pulmonary hypertension, particularly when accompanied by features of the RV dysfunction triad. In fact, this constellation of findings suggests the PH is occurring in the context of a normal left atrial pressure.
Grade II diastolic dysfunction, referred to as the pseudonormal transmitral pattern, occurs when there is structural left heart disease and/or age >60 years with an E/A ratio between 1-1.5 and a DT between 160-240 msec. This represents a more advanced stage of diastolic dysfunction, as left atrial hypertension is typically manifest. In grade III diastolic dysfunction, or restrictive transmitral filling, the E/A ratio typically exceeds 2.0 with a DT<160 msec; restrictive transmitral Doppler physiology is strongly suggestive of an increased LA pressure. (Fig. 12) Thus, Grade II and III diastolic dysfunction are strongly suggestive of an increased left atrial pressure at the time of DE examination is performed and are thus very uncommon findings in PAH. A PASP between 40 and 70 mmHg (mean PA pressure of ≈ 25-45 mmHg) in the presence of pseudonormal or restrictive transmitral flow is strongly suggestive of pulmonary venous hypertension as the dominant source of pulmonary hypertension. If this is coupled with normal septal position as well as normal RV size and shape, the diagnosis of pulmonary venous hypertension becomes almost certain.
Figure 12.
Pulsed wave Doppler interrogation of the mitral valve at the level of the leaflet tips. Panel A demonstrates grade I diastolic dysfunction with “E-A reversal”. This finding is commonly seen in patients over the age of 65, or those with underlying left-sided heart disease. In addition, this pattern is commonly seen in PAH, highlighting how decreased RV function and increased RV size increase ventricular interdependence and impair early LV diastolic filling. Importantly, grade I diastolic dysfunction typically denotes normal resting left atrial pressure. Panel B demonstrates grade II diastolic dysfunction or a “pseudonormal” filling pattern (E>A). This is associated with moderate left atrial hypertension. Panel C demonstrates Grade III or restrictive mitral inflow (E>>A with a short deceleration time). This is seen in patients with markedly elevated left heart filling pressures. Pattern A is common in PAH; patterns B and C are rare in PAH and common in PVH.
INTEGRATION OF THE DE EXAMINATION INTO THE INITIAL DIAGNOSTIC ASSESSMENT OF UN-DIFFERENTIATED PULMONARY HYPERTENSION
From a clinician's perspective, a useful initial diagnostic framework considers whether a patient's pulmonary hypertension is from a pulmonary venous (“postcapillary”) or pulmonary arterial (“precapillary”) source. This approach is both rational and practical, given the prevalence of pulmonary venous hypertension, as well as the fact that the diagnostic and therapeutic considerations for these patients differ considerably.
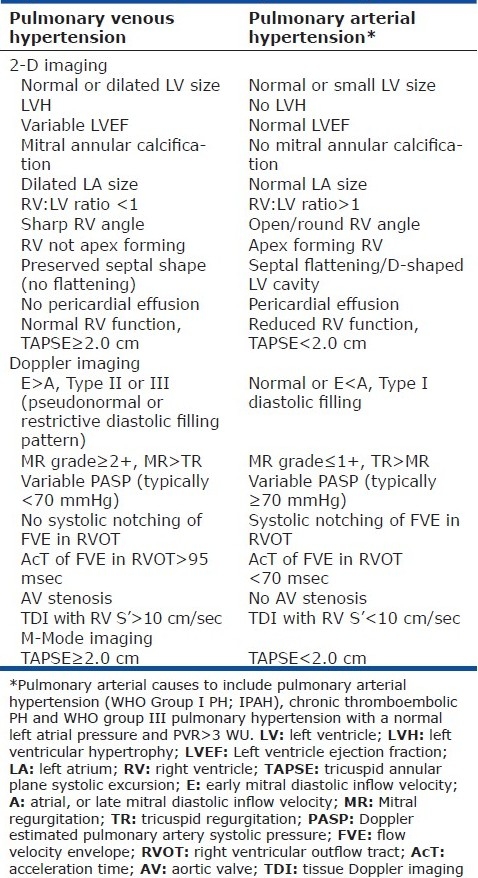
As outlined in the sections above, a variety of DE parameters have significant diagnostic and prognostic value in PH. It is customary that a transthoracic DE report will provide a list of normal and abnormal findings related to cardiac structure and function. Table 1 summarizes some of the salient 2-D and Doppler features that aid in differentiating the type of PH. However, what is often lacking is the needed degree of integration of these findings in order to assist the clinician in arriving at the correct overall diagnosis. For example, what information should prompt referral of a patient for invasive right heart catheterization?
Table 1.
2-D, Doppler, and M-Mode echocardiographic features of pulmonary venous hypertension and pulmonary arterial hypertension
With a more integrated approach to DE interpretation in mind, we recently devised a Doppler-echo scoring system to help discern PH pathophysiology. The initial data included 76 consecutive patients with undifferentiated PH. Components of the score included “left heart” and “right heart” parameters, with features of each receiving a score. The left heart parameters were LA enlargement, LVH, grade II or III diastolic dysfunction; yes=0 points, no=1 point. Right heart parameters included RV enlargement, TAPSE<2 cm, septal bowing (yes=1 point, no=0 points) and Doppler notching of the RVOTDoppler profile (yes=2 points, no=0 points). It is notable that a Doppler estimate of PA pressure was not part of the score. A high score (6-8) would thus be compatible with a pulmonary vascular origin of PH whereas a low score (0-2) would suggest pulmonary venous hypertension. Patients with a score of 0-2 were older, with an elevated PCWP of 18 mm Hg, only mild to moderate PH (mean PA pressure 33 mm Hg) and a mean PVR of only 2.8 WU. By way of contrast, patients with a score of 6-8 had a normal PCWP (12 mm Hg), severe PH (mean PA pressure 50 mm Hg) and mean PVR of 10 WU. Notably, all patients with a score>6 had a PVR>4.5 WU, whereas only one patient with a score <3 had PAH.[97]
Two examples of this integrated assessment are shown in Figures 13 and 14. All images in Figure 13 correspond to patient 1 (pulmonary venous hypertension) and the images in Figure 14 to patient 2 (pulmonary arterial hypertension). In the DE examination of patient 1, the parasternal long axis view (Fig. 13, panel A) reveals LAE and left ventricular hypertrophy. The apical 4 chamber view (panel B) also reveals LAE and bowing of the interatrial septum to the right suggesting higher LA than RA pressure. The LVEF is normal. The transmitral Doppler pattern reveals Grade III diastolic dysfunction (panel C). The RV:LV ratio is <1.0 with a non-apex forming RV and a relatively normal TAPSE. The RVOTDoppler pattern is not notched (panel D). The echo score is 1 of 8. This is highly suggestive of PVH without pulmonary vascular disease. We would not likely refer this patient for invasive right heart catheterization at this stage, as our suspicion for PAH or even for a high PVR is very low. Instead, we would manage the left heart condition and monitor the patient's symptoms and PH closely.
Figure 13.
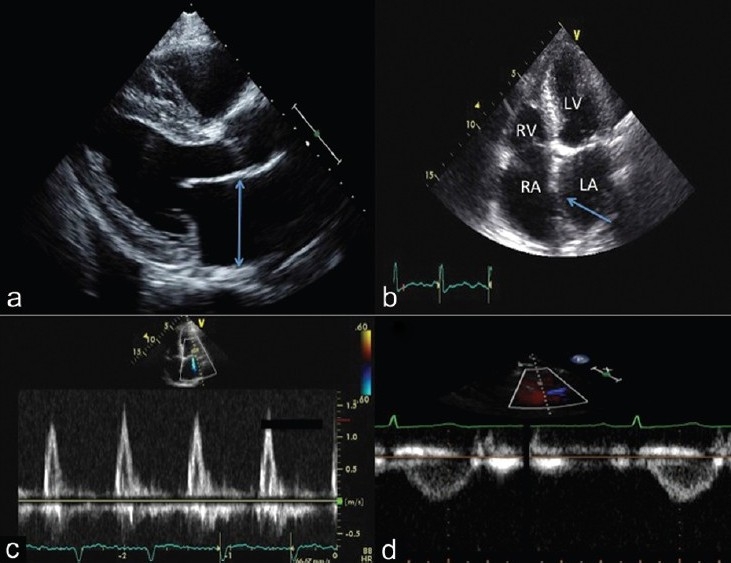
Integrated 2-D and Doppler echocardiographic assessment of a patient with PVH. Note the left atrial enlargement (panel A and B) and the left to right atrial septal bowing (panel B, arrow). Panel C demonstrates a restrictive transmitral flow pattern. The pulsed wave Doppler of the RVOT reveals no notching in the FVE (panel D), consistent with a normal pulmonary vascular resistance.
Figure 14.
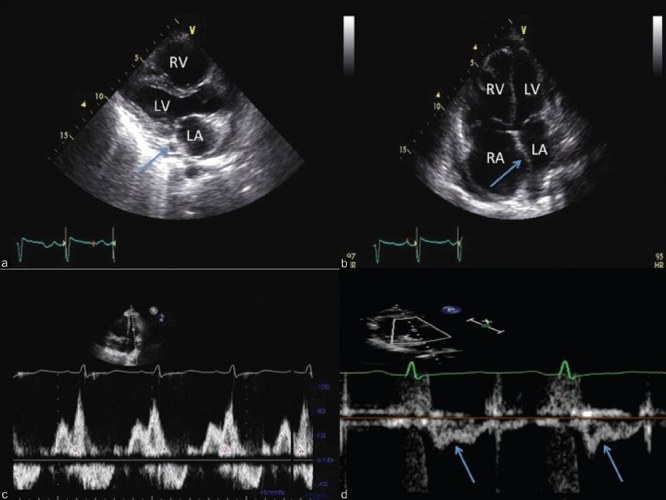
Integrated 2-D and Doppler echocardiographic assessment of a patient with PAH. Note normal left atrial size with a dilated coronary sinus (panel A, arrow) and right to left atrial septal bowing (panel B). Panel C demonstrates a Grade I diastolic dysfunction pattern (panel C) and the pulsed wave Doppler profile in the RVOT reveals mid-systolic notching (panel D, arrows), consistent with a very high pulmonary vascular resistance.
The parasternal long axis view in patient 2 (Fig. 14, panel A) shows normal left ventricular wall thickness and left atrial size. Note the dilated coronary sinus, often indicative of high right atrial pressure (panel A, arrow). On the apical 4-chamber view (panel B), the RV:LV ratio is >1.0, with a rounded RV apical angle and an apex forming RV. The LVEF is normal. The transmitral flow pattern reveals grade I diastolic dysfunction (panel C). The TAPSE (not shown) is reduced (1.7 cm), consistent with moderate RV dysfunction. The RVOTDoppler pattern has a mid-systolic notching pattern (panel D), which has been shown to be 96% specific for a PVR≥5 WU.[98] The echo score here is 8 of 8, which is highly consistent with PH of pulmonary vascular origin. We would refer this patient for urgent right heart catheterization as well as complete the needed imaging and functional studies in order to rule out underlying lung disease or chronic thromboembolic PH.
EXERCISE ECHOCARDIOGRAPHY
Exercise DE is being used with increasing frequency in the assessment of patients with known or suspected PVD as well in the context of dyspnea of unclear etiology. In the former case, the presence or absence of exercise-induced pulmonary hypertension is thought to increase the diagnostic sensitivity of the DE examination for the early stages of pulmonary vascular disease; in the latter case, a rise in PA pressure is often thought to provide ‘proof’ that pulmonary hypertension as an important source of a patient's dyspnea. Although conceptually attractive, exercise DE assessment and interpretation has multiple important limitations that need be addressed in order to best apply this modality in clinical practice.
The first issue to address is whether there should be a rise in PA pressure with exercise. The time-honored teaching on this subject is that the PA pressure should not increase with exercise. However, studies do not support this and indicate that exercise-induced pulmonary hypertension is more common than once appreciated. In 1966, Damato reported on the hemodynamic responses to 24 normal healthy male volunteers who underwent upright treadmill exercise with a pulmonary artery catheter in place. The average peak oxygen consumption (VO2) was 30 ml O2/kg/min (~8-9 METS), indicating normal, but not elite exercise performance. At peak exercise, 10 of the 24 normal subjects had a mean pulmonary artery pressure >30 mmHg, thus meeting the definition of exercise-induced pulmonary hypertension; the increases in PA pressure correlated with increasing cardiac output and the pressure-flow relationship and total pulmonary resistance remained normal in all subjects.[99] In another cohort of more fit subjects, bicycle exercise up to 240 Watts led to an average increase in the mPAP of 37 mmHg.[100] Similarly, Bossone et al. showed that highly conditioned college athletes routinely increased their Doppler estimated PA systolic pressure to >50 mmHg at peak exercise whereas the healthy non-athletes typically did not exceed a PASP of 30 mmHg.[101] The degree of PASP elevation correlated best with changes in stroke volume, again indicating a normal pressure-flow relationship.
The second important limitation of exercise echocardiographic assessment of PA pressure is that changes in left atrial pressure are not accounted for during exercise DE. This is critical, given that exercise-induced pulmonary hypertension (in health and in disease) most commonly arises from the interaction between an increased cardiac output and a rise in the left atrial pressure.[100,102] To the contrary, Laskey et al. showed that the PVR of patients with IPAH remained elevated during exercise, but unchanged from resting values.[103] Thus, exercise-induced pulmonary vasoconstriction is not typical, even in patients with established, severe pulmonary vascular disease.
The third limitation of exercise DE is the accuracy of Doppler PA pressure assessment. Also, age likely exerts an important influence on the relative change in PA pressure with exercise, owed to age-related increases in pulmonary vascular stiffness; thus, exercise-induced pulmonary hypertension, even at relatively low workloads, may be a part of the normal aging process, similar to the exaggerated increase in systemic arterial pressure with aging.[104] Lastly, it seems that the systemic blood pressure response to exercise should be factored into the interpretation of an exercise-induced rise in PA pressure. For example, a rise in PASP from 35 to 70 mmHg in the context of a rise in systemic systolic pressure from 120 to 210 mmHg indicates that the relative proportion of pulmonary to systemic blood pressure has remained quite similar from rest to exercise, thus questioning the clinical significance of the rise in PA pressure in this context.
Investigators have also used exercise echocardiography to help identify latent pulmonary vascular disease in high-risk groups such as scleroderma. Steen et al. showed that 24 of 54 scleroderma patients at high risk for PAH had an increase of 20 mmHg or more with exercise DE examination; 21 of the 24 underwent right heart catheterization. Of these subjects, 4 had resting PH and 17 showed mild exercise-induced PH by catheterization. The average PVR at the end of exercise was <3 WU.[105] Others have defined exercise-induced PAH to be present if the mPAP increased to >30 mmHg with a WP<20 mmHg and a PVR that need only be >1 WU.[106] Though defined differently, both studies confirmed some degree of exercise-induced PH in these subjects, however at such low PVR values, the physiologic and clinical significance of these findings are less clear. Interestingly, Reichenberger observed Doppler estimated increases in PASP with exercise in 16 of 33 patients with scleroderma (mean PASP 47 mmHg at a peak VO2 of 64% predicted), yet only 1 of the 16 subjects with exercise-induced PH developed manifest PAH over a 3 year follow up.[107]
Taken together, one must exercise caution in how they interpret a rise in Doppler estimated PA pressure with exercise, as even when accurate a rise in PA pressure with exercise does not necessarily implicate the pulmonary vasculature as the source of pulmonary hypertension, that the PH is appropriate for PH specific therapies, nor whether the PH is the source of dyspnea in an individual patient. To this last point, patients with chronic obstructive pulmonary disease and pulmonary hypertension demonstrated the same aerobic exercise capacity as COPD patients without pulmonary hypertension; in both groups, exercise capacity was limited by exhaustion of the ventilatory reserve and did not correlate with pulmonary artery pressure.[108] Thus, the demonstration of a rise in PA pressure with exercise in many cases, amounts to an association, but not a diagnosis as to the source of dyspnea in an individual patient. For many of these reasons, the recently published expert consensus document from the American College of Cardiology/American Heart Association, recommends that, no treatment decisions be made on the basis of exercise echocardiography.[9]
An alternative approach to exercise DE may be to focus on the right ventricular functional response to exercise, especially considering that impaired RV functional reserve is the mechanism of exercise limitation in PAH and other forms of PVD.[109] This approach may provide a more direct and clinically relevant answer as to whether a patient has clinically significant latent pulmonary vascular disease or PH as their cause of dyspnea. If the RV function augments normally with exercise, the rise in PA pressure would likely be flow-mediated and of far less clinical significance. In contrast, a dilating and non-augmenting RV in response to exercise should indicate an impedance-mediated process of greater clinical significance. In normal subjects, TAPSE will increase from approximately 2.5 cm at rest to 2.8-3.0 cm at peak exercise. Preliminary evidence suggests that the RV functional response to exercise (change in TAPSE) is linked to clinical outcome. In a relatively small cohort of stable PAH patients, subjects either maintained a TAPSE similar to their resting TAPSE following graded supine ergometry, or had a fall in TAPSE with exercise. A fall in TAPSE with exercise was strongly associated with adverse clinical events within one year of follow up.[110] Importantly, a rise in the peak TR jet velocity following exercise was associated with better exercise-induced RV function and better clinical outcome. We suspect that more evidence will arise in the near future supporting the notion that the focus of exercise echocardiography should be placed primarily on the RV functional response to exercise.
SUMMARY
The echo-Doppler examination is a central part of the initial diagnosis and assessment of patients with pulmonary vascular disease and other forms of pulmonary hypertension. Often, the results of the initial DE examination are pivotal in the decision making process for which patients are referred for further hemodynamic assessment of their PH. As a result, it is important for the clinician to fully appreciate the echocardiographic features associated with underlying pulmonary vascular disease, as a missed or delayed diagnosis can have devastating consequences. Overreliance on any single DE metric, and especially PA pressure estimation, detracts from the overall diagnostic potential of the DE examination. The right ventricle often bears witness to perturbations in the RV-PA interaction, with stereotypical changes in the size, shape and function of the RV often leading to the diagnosis of PVD even without a reliable noninvasive pressure assessment. Thus, clinical DE protocols should include basic measurements of RV size, the relative proportion of the RV to the LV, and a direct measurement of RV systolic function. This is especially important when considering that the morbidity and mortality in pulmonary vascular disease relates rests almost entirely on the ability of the right heart to adapt to its afterload. Attention should be directed toward the shape, or pattern of the flow velocity envelope leaving the RV outflow tract, as this provides important physiologic information about the pulmonary vasculature and its interaction with the ejecting right ventricle. Doppler evidence of diastolic dysfunction should be considered along a continuum that runs in parallel with rising left atrial pressure, and that right heart failure itself is an important cause of impaired LV relaxation. Integrating the relative ‘balance’ of right and left heart findings, along with proper Doppler interpretation often provides a wealth of clinical and pathophysiologic insight prior to invasive hemodynamic assessment. The end results are heightened awareness and improved identification of which patients should be referred for further invasive testing, as well the use of the DE information to compliment the findings from invasive testing.
Footnotes
Source of Support: Nil,
Conflict of Interest: None declared.
REFERENCES
- 1.Dell’italia LJ. The right ventricle: Anatomy, physiology, and clinical importance. Curr Probl Cardiol. 1991;16:653–720. doi: 10.1016/0146-2806(91)90009-y. [DOI] [PubMed] [Google Scholar]
- 2.James TN. Anatomy of the crista supraventricularis: Its importance for understanding right ventricular function, right ventricular infarction and related conditions. J Am Coll Cardiol. 1985;6:1083–95. doi: 10.1016/s0735-1097(85)80313-2. [DOI] [PubMed] [Google Scholar]
- 3.Rushmer RF, Crystal DK, Wagner C. The functional anatomy of ventricular contraction. Circ Res. 1953;1:162–70. doi: 10.1161/01.res.1.2.162. [DOI] [PubMed] [Google Scholar]
- 4.Kaul S, Tei C, Hopkins JM, Shah PM. Assessment of right ventricular function using two-dimensional echocardiography. Am Heart J. 1984;107:526–31. doi: 10.1016/0002-8703(84)90095-4. [DOI] [PubMed] [Google Scholar]
- 5.Kerbaul F, Brimioulle S, Rondelet B, Dewachter C, Hubloue I, Naeije R. How prostacyclin improves cardiac output in right heart failure in conjunction with pulmonary hypertension. Am J Respir Crit Care Med. 2007;175:846–50. doi: 10.1164/rccm.200611-1615OC. [DOI] [PubMed] [Google Scholar]
- 6.Kuehne T, Yilmaz S, Steendijk P, Moore P, Groenink M, Saaed M, et al. Magnetic resonance imaging analysis of right ventricular pressure-volume loops: In vivo validation and clinical application in patients with pulmonary hypertension. Circulation. 2004;110:2010–6. doi: 10.1161/01.CIR.0000143138.02493.DD. [DOI] [PubMed] [Google Scholar]
- 7.McLaughlin VV, Presberg KW, Doyle RL, Abman SH, McCrory DC, Fortin T, et al. Prognosis of pulmonary arterial hypertension: ACCP evidence-based clinical practice guidelines. Chest. 2004;126(Suppl 1):78S–92. doi: 10.1378/chest.126.1_suppl.78S. [DOI] [PubMed] [Google Scholar]
- 8.McQuillan BM, Picard MH, Leavitt M, Weyman AE. Clinical correlates and subjects. Circulation. 2001;104:2797–802. doi: 10.1161/hc4801.100076. [DOI] [PubMed] [Google Scholar]
- 9.McLaughlin VV, Archer SL, Badesch DB, Barst RJ, Farber HW, Lindner JR, et al. ACCF/AHA 2009 expert consensus document on pulmonary hypertension a report of the American College of Cardiology Foundation Task Force on Expert Consensus Documents and the American Heart Association developed in collaboration with the American College of Chest Physicians; American Thoracic Society, Inc.; and the Pulmonary Hypertension Association. J Am Coll Cardiol. 2009;53:1573–619. doi: 10.1016/j.jacc.2009.01.004. [DOI] [PubMed] [Google Scholar]
- 10.Berger M, Haimowitz A, Van Tosh A, Berdoff RL, Goldberg E. Quantitative assessment of pulmonary hypertension in patients with tricuspid regurgitation using continuous wave Doppler ultrasound. J Am Coll Cardiol. 1985;6:359–65. doi: 10.1016/s0735-1097(85)80172-8. [DOI] [PubMed] [Google Scholar]
- 11.Yock PG, Popp RL. Noninvasive estimation of right ventricular systolic pressure by Doppler ultrasound in patients with tricuspid regurgitation. Circulation. 1984;70:657–62. doi: 10.1161/01.cir.70.4.657. [DOI] [PubMed] [Google Scholar]
- 12.Himelman RB, Stulbarg M, Kircher B, Lee E, Kee L, Dean NC, et al. Noninvasive evaluation of pulmonary artery pressure during exercise by saline-enhanced Doppler echocardiography in chronic pulmonary disease. Circulation. 1989;79:863–71. doi: 10.1161/01.cir.79.4.863. [DOI] [PubMed] [Google Scholar]
- 13.Chan KL, Currie PJ, Seward JB, Hagler DJ, Mair DD, Tajik AJ. Comparison of three Doppler ultrasound methods in the prediction of pulmonary artery pressure. J Am Coll Cardiol. 1987;9:549–54. doi: 10.1016/s0735-1097(87)80047-5. [DOI] [PubMed] [Google Scholar]
- 14.Currie PJ, Seward JB, Chan KL, Fyfe DA, Hagler DJ, Mair DD, et al. Continuous wave Doppler determination of right ventricular pressure: A simultaneous Doppler-catheterization study in 127 patients. J Am Coll Cardiol. 1985;6:750–6. doi: 10.1016/s0735-1097(85)80477-0. [DOI] [PubMed] [Google Scholar]
- 15.Fisher MR, Forfia PR, Chamera E, Housten-Harris T, Champion HC, Girgis RE, et al. Accuracy of Doppler echocardiography in the hemodynamic assessment of pulmonary hypertension. Am J Respir Crit Care Med. 2009;179:615–21. doi: 10.1164/rccm.200811-1691OC. [DOI] [PMC free article] [PubMed] [Google Scholar]
- 16.Rich JD, Shah SJ, Swamy RS, Kamp A, Rich S. Inaccuracy of Doppler echocardiographic estimates of pulmonary artery pressures in patients with pulmonary hypertension. Chest. 2011;139:988–93. doi: 10.1378/chest.10-1269. [DOI] [PubMed] [Google Scholar]
- 17.Testani JM, St John Sutton MG, Wiegers SE, Khera AV, Shannon RP, Kirkpatrick JN. Accuracy of noninvasively determined pulmonary artery systolic pressure. Am J Cardiol. 2010;105:1192–7. doi: 10.1016/j.amjcard.2009.11.048. [DOI] [PMC free article] [PubMed] [Google Scholar]
- 18.Brennan JM, Blair JE, Goonewardena S, Ronan A, Shah D, Vasaiwala S, et al. Reappraisal of the use of inferior vena cava for estimating right atrial pressure. J Am Soc Echocardiogr. 2007;20:857–61. doi: 10.1016/j.echo.2007.01.005. [DOI] [PubMed] [Google Scholar]
- 19.Kircher BJ, Himelman RB, Schiller NB. Noninvasive estimation of right atrial pressure from the inspiratory collapse of the inferior vena cava. Am J Cardiol. 1990;66:493–6. doi: 10.1016/0002-9149(90)90711-9. [DOI] [PubMed] [Google Scholar]
- 20.Utsunomiya H, Nakatani S, Nishihira M, Kanzaki H, Kyotani S, Nakanishi N, et al. Value of estimated right ventricular filling pressure in predicting cardiac events in chronic pulmonary arterial hypertension. J Am Soc Echocardiogr. 2009;22:1368–74. doi: 10.1016/j.echo.2009.08.023. [DOI] [PubMed] [Google Scholar]
- 21.Masuyama T, Kodama K, Kitabatake A, Sato H, Nanto S, Inoue M. Continuous wave Doppler echocardiographic detection of pulmonary regurgitation and its application to noninvasive estimation of pulmonary artery pressure. Circulation. 1986;74:484–92. doi: 10.1161/01.cir.74.3.484. [DOI] [PubMed] [Google Scholar]
- 22.Lanzarini L, Fontana A, Lucca E, Campana C, Klersy C. Noninvasive estimation of both systolic and diastolic pulmonary artery pressure from Doppler analysis of tricuspid regurgitant velocity spectrum in patients with chronic heart failure. Am Heart J. 2002;144:1087–94. doi: 10.1067/mhj.2002.126350. [DOI] [PubMed] [Google Scholar]
- 23.Stephen B, Dalal P, Berger M, Schweitzer P, Hecht S. Noninvasive estimation of pulmonary artery diastolic pressure in patients with tricuspid regurgitation by Doppler echocardiography. Chest. 1999;116:73–7. doi: 10.1378/chest.116.1.73. [DOI] [PubMed] [Google Scholar]
- 24.Kitabatake A, Inoue M, Asao M, Masuyama T, Tanouchi J, Morita T, et al. Noninvasive evaluation of pulmonary hypertension by a pulsed Doppler technique. Circulation. 1983;68:302–9. doi: 10.1161/01.cir.68.2.302. [DOI] [PubMed] [Google Scholar]
- 25.Chemla D, Castelain V, Humbert M, Hébert JL, Simonneau G, Lecarpentier Y, et al. New formula for predicting mean pulmonary artery pressure using systolic pulmonary artery pressure. Chest. 2004;126:1313–7. doi: 10.1378/chest.126.4.1313. [DOI] [PubMed] [Google Scholar]
- 26.Aduen JF, Castello R, Daniels JT, Diaz JA, Safford RE, Heckman MG, et al. Accuracy and precision of three echocardiographic methods for estimating mean pulmonary artery pressure. Chest. 2011;139:347–52. doi: 10.1378/chest.10-0126. [DOI] [PubMed] [Google Scholar]
- 27.Schenk P, Globits S, Koller J, Brunner C, Artemiou O, Klepetko W, et al. Accuracy of echocardiographic right ventricular parameters in patients with different end-stage lung diseases prior to lung transplantation. J Heart Lung Transplant. 2000;19:145–54. doi: 10.1016/s1053-2498(99)00121-7. [DOI] [PubMed] [Google Scholar]
- 28.Ghio S, Recusani F, Klersy C, Sebastiani R, Laudisa ML, Campana C, et al. Prognostic usefulness of the tricuspid annular plane systolic excursion in patients with congestive heart failure secondary to idiopathic or ischemic dilated cardiomyopathy. Am J Cardiol. 2000;85:837–42. doi: 10.1016/s0002-9149(99)00877-2. [DOI] [PubMed] [Google Scholar]
- 29.Forfia PR, Fisher MR, Mathai SC, Housten-Harris T, Hemnes AR, Borlaug BA, et al. Tricuspid annular displacement predicts survival in pulmonary hypertension. Am J Respir Crit Care Med. 2006;174:1034–41. doi: 10.1164/rccm.200604-547OC. [DOI] [PubMed] [Google Scholar]
- 30.Brown SB, Rania A, Katz D, Szerlip M, Wiegers SE, Forfia PR. Longitudinal shortening accounts for the majority of right ventricular contraction in normal subjects and in pulmonary artreial hypertension and improves after pulmonary vasodilator therapy. Chest. 2011 Jul;140(1):27–33. doi: 10.1378/chest.10-1136. Epub 2010 Nov 24. [DOI] [PubMed] [Google Scholar]
- 31.Lee CY, Chang SM, Hsiao SH, Tseng JC, Lin SK, Liu CP. Right heart function and scleroderma: Insights from tricuspid annular plane systolic excursion. Echocardiography. 2007;24:118–25. doi: 10.1111/j.1540-8175.2007.00365.x. [DOI] [PubMed] [Google Scholar]
- 32.Hammarström E, Wranne B, Pinto FJ, Puryear Y, Popp RL. Tricuspid annular motion. J Am Soc Echocardiogr. 1991;4:131–9. doi: 10.1016/s0894-7317(14)80524-5. [DOI] [PubMed] [Google Scholar]
- 33.López-Candales A, Dohi K, Rajagopalan N, Edelman K, Gulyasy B, Bazaz R. Defining normal variables of right ventricular size and function in pulmonary hypertension: An echocardiographic study. Postgrad Med J. 2008;84:40–5. doi: 10.1136/pgmj.2007.059642. [DOI] [PubMed] [Google Scholar]
- 34.Ghio S, Klersy C, Magrini G, D’Armini AM, Scelsi L, Raineri C, et al. Prognostic relevance of the echocardiographic assessment of right ventricular function in patients with idiopathic pulmonary arterial hypertension. Int J Cardiol. 2010;140:272–8. doi: 10.1016/j.ijcard.2008.11.051. [DOI] [PubMed] [Google Scholar]
- 35.Saxena N, Rajagopalan N, Edelman K, López-Candales A. Tricuspid annular systolic velocity: A useful measurement in determining right ventricular systolic function regardless of pulmonary artery pressures. Echocardiography. 2006;23:750–5. doi: 10.1111/j.1540-8175.2006.00305.x. [DOI] [PubMed] [Google Scholar]
- 36.Rajagopalan N, Saxena N, Simon MA, Edelman K, Mathier MA, López-Candales A. Correlation of tricuspid annular velocities with invasive hemodynamics in pulmonary hypertension. Congest Heart Fail. 2007;13:200–4. doi: 10.1111/j.1527-5299.2007.06466.x. [DOI] [PubMed] [Google Scholar]
- 37.Urheim S, Cauduro S, Frantz R, McGoon M, Belohlavek M, Green T, et al. Relation of tissue displacement and strain to invasively determined right ventricular stroke volume. Am J Cardiol. 2005;96:1173–8. doi: 10.1016/j.amjcard.2005.06.049. [DOI] [PubMed] [Google Scholar]
- 38.Yeo TC, Dujardin KS, Tei C, Mahoney DW, McGoon MD, Seward JB. Value of a Doppler-derived index combining systolic and diastolic time intervals in predicting outcome in primary pulmonary hypertension. Am J Cardiol. 1998;81:1157–61. doi: 10.1016/s0002-9149(98)00140-4. [DOI] [PubMed] [Google Scholar]
- 39.Bommer W, Weinert L, Neumann A, Neef J, Mason DT, DeMaria A. Determination of right atrial and right ventricular size by two-dimensional echocardiography. Circulation. 1979;60:91–100. doi: 10.1161/01.cir.60.1.91. [DOI] [PubMed] [Google Scholar]
- 40.López-Candales A, Dohi K, Iliescu A, Peterson RC, Edelman K, Bazaz R. An abnormal right ventricular apical angle is indicative of global right ventricular impairment. Echocardiography. 2006;23:361–8. doi: 10.1111/j.1540-8175.2006.00237.x. [DOI] [PubMed] [Google Scholar]
- 41.Imanishi T, Nakatani S, Yamada S, Nakanishi N, Beppu S, Nagata S, et al. Validation of continuous wave Doppler-determined right ventricular peak positive and negative dP/dt: Effect of right atrial pressure on measurement. J Am Coll Cardiol. 1994;23:1638–43. doi: 10.1016/0735-1097(94)90668-8. [DOI] [PubMed] [Google Scholar]
- 42.López-Candales A, Rajagopalan N, Gulyasy B, Edelman K, Bazaz R. A delayed time of the peak tricuspid regurgitation signal: Marker of right ventricular dysfunction. Am J Med Sci. 2008;336:224–9. doi: 10.1097/MAJ.0b013e31815fa56a. [DOI] [PubMed] [Google Scholar]
- 43.Bove AA, Santamore WP. Ventricular interdependence. Prog Cardiovasc Dis. 1981;23:365–88. doi: 10.1016/0033-0620(81)90022-0. [DOI] [PubMed] [Google Scholar]
- 44.Marcus JT, Gan CT, Zwanenburg JJ, Boonstra A, Allaart CP, Götte MJ, et al. Interventricular mechanical asynchrony in pulmonary arterial hypertension: Left-to-right delay in peak shortening is related to right ventricular overload and left ventricular underfilling. J Am Coll Cardiol. 2008;51:750–7. doi: 10.1016/j.jacc.2007.10.041. [DOI] [PubMed] [Google Scholar]
- 45.Benza R, Biederman R, Murali S, Gupta H. Role of cardiac magnetic resonance imaging in the management of patients with pulmonary arterial hypertension. J Am Coll Cardiol. 2008;52:1683–92. doi: 10.1016/j.jacc.2008.08.033. [DOI] [PubMed] [Google Scholar]
- 46.Mauritz GJ, Marcus JT, Westerhof N, Postmus PE, Vonk-Noordegraaf A. Prolonged right ventricular post-systolic isovolumic period in pulmonary arterial hypertension is not a reflection of diastolic dysfunction. Heart. 2011;97:473–8. doi: 10.1136/hrt.2010.193375. [DOI] [PubMed] [Google Scholar]
- 47.Gan CT, Lankhaar JW, Marcus JT, Westerhof N, Marques KM, Bronzwaer JG, et al. Impaired left ventricular filling due to right-to-left ventricular interaction in patients with pulmonary arterial hypertension. Am J Physiol Heart Circ Physiol. 2006;290:H1528–33. doi: 10.1152/ajpheart.01031.2005. [DOI] [PubMed] [Google Scholar]
- 48.Hinderliter AL, Willis PW, 4th, Long W, Clarke WR, Ralph D, Caldwell EJ, et al. Frequency and prognostic significance of pericardial effusion in primary pulmonary hypertension. PPH Study Group. Primary pulmonary hypertension. Am J Cardiol. 1999;84:481–4. doi: 10.1016/s0002-9149(99)00342-2. [DOI] [PubMed] [Google Scholar]
- 49.Miller AJ. Some observations concerning pericardial effusions and their relationship to the venous and lymphatic circulation of the heart. Lymphology. 1970;3:76–8. [PubMed] [Google Scholar]
- 50.Hemnes AR, Gaine SP, Wiener CM. Poor outcomes associated with drainage of pericardial effusions in patients with pulmonary arterial hypertension. South Med J. 2008;101:490–4. doi: 10.1097/SMJ.0b013e31816c0169. [DOI] [PubMed] [Google Scholar]
- 51.Abbas AE, Fortuin FD, Schiller NB, Appleton CP, Moreno CA, Lester SJ. A simple method for noninvasive estimation of pulmonary vascular resistance. J Am Coll Cardiol. 2003;41:1021–7. doi: 10.1016/s0735-1097(02)02973-x. [DOI] [PubMed] [Google Scholar]
- 52.Rajagopalan N, Simon MA, Suffoletto MS, Shah H, Edelman K, Mathier MA, et al. Noninvasive estimation of pulmonary vascular resistance in pulmonary hypertension. Echocardiography. 2009;26:489–94. doi: 10.1111/j.1540-8175.2008.00837.x. [DOI] [PubMed] [Google Scholar]
- 53.Ihlen H, Amlie JP, Dale J, Forfang K, Nitter-Hauge S, Otterstad JE, et al. Determination of cardiac output by Doppler echocardiography. Br Heart J. 1984;51:54–60. doi: 10.1136/hrt.51.1.54. [DOI] [PMC free article] [PubMed] [Google Scholar]
- 54.Furuno Y, Nagamoto Y, Fujita M, Kaku T, Sakurai S, Kuroiwa A. Reflection as a cause of mid-systolic deceleration of pulmonary flow wave in dogs with acute pulmonary hypertension: Comparison of pulmonary artery constriction with pulmonary embolisation. Cardiovasc Res. 1991;25:118–24. doi: 10.1093/cvr/25.2.118. [DOI] [PubMed] [Google Scholar]
- 55.Torbicki A, Kurzyna M, Ciurzynski M, Pruszczyk P, Pacho R, Kuch-Wocial A, et al. Proximal pulmonary emboli modify right ventricular ejection pattern. Eur Respir J. 1999;13:616–21. doi: 10.1183/09031936.99.13361699. [DOI] [PubMed] [Google Scholar]
- 56.Castelain V, Hervé P, Lecarpentier Y, Duroux P, Simonneau G, Chemla D. Pulmonary artery pulse pressure and wave reflection in chronic pulmonary thromboembolism and primary pulmonary hypertension. J Am Coll Cardiol. 2001;37:1085–92. doi: 10.1016/s0735-1097(00)01212-2. [DOI] [PubMed] [Google Scholar]
- 57.Arkles JS, Opotowsky AR, Ojeda J, Rogers F, Liu T, Prassana V, et al. Midsystolic ‘notching’ of the pulmonary artery Doppler flow profile identifies pulmonary vascular disease and RV dysfunction in a mixed PH cohort. Am J Respir Crit Care Med. 2009;179:A3399. [Google Scholar]
- 58.Goodman DJ, Harrison DC, Popp RL. Echocardiographic features of primary pulmonary hypertension. Am J Cardiol. 1974;33:438–43. doi: 10.1016/0002-9149(74)90329-4. [DOI] [PubMed] [Google Scholar]
- 59.Bossone E, Duong-Wagner TH, Paciocco G, Oral H, Ricciardi M, Bach DS, et al. Echocardiographic features of primary pulmonary hypertension. J Am Soc Echocardiogr. 1999;12:655–62. doi: 10.1053/je.1999.v12.a99069. [DOI] [PubMed] [Google Scholar]
- 60.Nishimura RA, Tajik AJ. Evaluation of diastolic filling of left ventricle in health and disease: Doppler echocardiography is the clinician's Rosetta Stone. J Am Coll Cardiol. 1997;30:8–18. doi: 10.1016/s0735-1097(97)00144-7. [DOI] [PubMed] [Google Scholar]
- 61.Eysmann SB, Palevsky HI, Reichek N, Hackney K, Douglas PS. Two-dimensional and Doppler-echocardiographic and cardiac catheterization correlates of survival in primary pulmonary hypertension. Circulation. 1989;80:353–60. doi: 10.1161/01.cir.80.2.353. [DOI] [PubMed] [Google Scholar]
- 62.Raymond RJ, Hinderliter AL, Willis PW, Ralph D, Caldwell EJ, Williams W, et al. Echocardiographic predictors of adverse outcomes in primary pulmonary hypertension. J Am Coll Cardiol. 2002;39:1214–9. doi: 10.1016/s0735-1097(02)01744-8. [DOI] [PubMed] [Google Scholar]
- 63.Eysmann SB, Palevsky HI, Reichek N, Hackney K, Douglas PS. Echo/Doppler and hemodynamic correlates of vasodilator responsiveness in primary pulmonary hypertension. Chest. 1991;99:1066–71. doi: 10.1378/chest.99.5.1066. [DOI] [PubMed] [Google Scholar]
- 64.Ricciardi MJ, Bossone E, Bach DS, Armstrong WF, Rubenfire M. Echocardiographic predictors of an adverse response to a nifedipine trial in primary pulmonary hypertension: Diminished left ventricular size and leftward ventricular septal bowing. Chest. 1999;116:1218–23. doi: 10.1378/chest.116.5.1218. [DOI] [PubMed] [Google Scholar]
- 65.Tei C, Dujardin KS, Hodge DO, Bailey KR, McGoon MD, Tajik AJ, et al. Doppler echocardiographic index for assessment of global right ventricular function. J Am Soc Echocardiogr. 1996;9:838–47. doi: 10.1016/s0894-7317(96)90476-9. [DOI] [PubMed] [Google Scholar]
- 66.Galiè N, Hinderliter AL, Torbicki A, Fourme T, Simonneau G, Pulido T, et al. Effects of the oral endothelin-receptor antagonist bosentan on echocardiographic and doppler measures in patients with pulmonary arterial hypertension. J Am Coll Cardiol. 2003;41:1380–6. doi: 10.1016/s0735-1097(03)00121-9. [DOI] [PubMed] [Google Scholar]
- 67.Hinderliter AL, Willis PW, 4th, Barst RJ, Rich S, Rubin LJ, Badesch DB, et al. Effects of long-term infusion of prostacyclin (epoprostenol) on echocardiographic measures of right ventricular structure and function in primary pulmonary hypertension. Primary Pulmonary Hypertension Study Group. Circulation. 1997;95:1479–86. doi: 10.1161/01.cir.95.6.1479. [DOI] [PubMed] [Google Scholar]
- 68.Basil A, Liu T, Arkles J, Opotowsky A, Taichman D, Palevsky HI, et al. Serial changes in TAPSE correlate with functional assessment and clinical events in patients with PAH. Am J Respir Crit Care Med. 2009;179:A4882. [Google Scholar]
- 69.Dartevelle P, Fadel E, Mussot S, Chapelier A, Hervé P, de Perrot M, et al. Chronic thromboembolic pulmonary hypertension. Eur Respir J. 2004;23:637–48. doi: 10.1183/09031936.04.00079704. [DOI] [PubMed] [Google Scholar]
- 70.Fedullo PF, Auger WR, Kerr KM, Rubin LJ. Chronic thromboembolic pulmonary hypertension. New Engl J Med. 2001;345:1465–72. doi: 10.1056/NEJMra010902. [DOI] [PubMed] [Google Scholar]
- 71.Bresser P, Pepke-Zaba J, Jais X, Humbert M, Hoeper MM. Medical therapies for chronic thromboembolic pulmonary hypertension: An evolving treatment paradigm. Proc Am Thorac Soc. 2006;3:594–600. doi: 10.1513/pats.200605-115LR. [DOI] [PubMed] [Google Scholar]
- 72.Nakayama Y, Nakanishi N, Sugimachi M, Takaki H, Kyotani S, Satoh T, et al. Characteristics of pulmonary artery pressure waveform for differential diagnosis of chronic pulmonary thromboembolism and primary pulmonary hypertension. J Am Coll Cardiol. 1997;29:1311–6. doi: 10.1016/s0735-1097(97)00054-5. [DOI] [PubMed] [Google Scholar]
- 73.Tanabe N, Okada O, Abe Y, Masuda M, Nakajima N, Kuriyama T. The influence of fractional pulse pressure on the outcome of pulmonary thromboendarterectomy. Eur Respir J. 2001;17:653–9. doi: 10.1183/09031936.01.17406530. [DOI] [PubMed] [Google Scholar]
- 74.Nakayama Y, Sugimachi M, Nakanishi N, Takaki H, Okano Y, Satoh T, et al. Noninvasive differential diagnosis between chronic pulmonary thromboembolism and primary pulmonary hypertension by means of Doppler ultrasound measurement. J Am Coll Cardiol. 1998;31:1367–71. doi: 10.1016/s0735-1097(98)00107-7. [DOI] [PubMed] [Google Scholar]
- 75.Casaclang-Verzosa G, McCully RB, Oh JK, Miller FA, Jr, McGregor CG. Effects of pulmonary thromboendarterectomy on right-sided echocardiographic parameters in patients with chronic thromboembolic pulmonary hypertension. Mayo Clin Proc. 2006;81:777–82. doi: 10.4065/81.6.777. [DOI] [PubMed] [Google Scholar]
- 76.Menzel T, Kramm T, Wagner S, Mohr-Kahaly S, Mayer E, Meyer J. Improvement of tricuspid regurgitation after pulmonary thromboendarterectomy. Ann Thorac Surg. 2002;73:756–61. doi: 10.1016/s0003-4975(01)03573-1. [DOI] [PubMed] [Google Scholar]
- 77.Hardziyenka M, Reesink HJ, Bouma BJ, de Bruin-Bon HA, Campian ME, Tanck MW, et al. A novel echocardiographic predictor of in-hospital mortality and mid-term haemodynamic improvement after pulmonary endarterectomy for chronic thrombo-embolic pulmonary hypertension. Eur Heart J. 2007;28:842–9. doi: 10.1093/eurheartj/ehl534. [DOI] [PubMed] [Google Scholar]
- 78.Guyton AC, Lindsey AW, Gilluly JJ. The limits of right ventricular compensation following acute increase in pulmonary circulatory resistance. Circ Res. 1954;2:326–32. doi: 10.1161/01.res.2.4.326. [DOI] [PubMed] [Google Scholar]
- 79.Kasper W, Geibel A, Tiede N, Bassenge D, Kauder E, Konstantinides S, et al. Distinguishing between acute and subacute massive pulmonary embolism by conventional and Doppler echocardiography. Br Heart J. 1993;70:352–6. doi: 10.1136/hrt.70.4.352. [DOI] [PMC free article] [PubMed] [Google Scholar]
- 80.Jardin F, Dubourg O, Guéret P, Delorme G, Bourdarias JP. Quantitative two-dimensional echocardiography in massive pulmonary embolism: Emphasis on ventricular interdependence and leftward septal displacement. J Am Coll Cardiol. 1987;10:1201–6. doi: 10.1016/s0735-1097(87)80119-5. [DOI] [PubMed] [Google Scholar]
- 81.Ribeiro A, Juhlin-Dannfelt A, Brodin LA, Holmgren A, Jorfeldt L. Pulmonary embolism: Relation between the degree of right ventricle overload and the extent of perfusion defects. Am Heart J. 1998;135:868–74. doi: 10.1016/s0002-8703(98)70048-1. [DOI] [PubMed] [Google Scholar]
- 82.Miniati M, Monti S, Pratali L, Di Ricco G, Marini C, Formichi B, et al. Value of transthoracic echocardiography in the diagnosis of pulmonary embolism: Results of a prospective study in unselected patients. Am J Med. 2001;110:528–35. doi: 10.1016/s0002-9343(01)00693-3. [DOI] [PubMed] [Google Scholar]
- 83.Ribeiro A, Lindmarker P, Johnsson H, Juhlin-Dannfelt A, Jorfeldt L. Pulmonary embolism: One-year follow-up with echocardiography Doppler and five-year survival analysis. Circulation. 1999;99:1325–30. doi: 10.1161/01.cir.99.10.1325. [DOI] [PubMed] [Google Scholar]
- 84.McConnell MV, Solomon SD, Rayan ME, Come PC, Goldhaber SZ, Lee RT. Regional right ventricular dysfunction detected by echocardiography in acute pulmonary embolism. Am J Cardiol. 1996;78:469–73. doi: 10.1016/s0002-9149(96)00339-6. [DOI] [PubMed] [Google Scholar]
- 85.Hsiao SH, Lee CY, Chang SM, Yang SH, Lin SK, Huang WC. Pulmonary embolism and right heart function: Insights from myocardial Doppler tissue imaging. J Am Soc Echocardiogr. 2006;19:822–8. doi: 10.1016/j.echo.2006.01.011. [DOI] [PubMed] [Google Scholar]
- 86.Kurzyna M, Torbicki A, Pruszczyk P, Burakowska B, Fijałkowska A, Kober J, et al. Disturbed right ventricular ejection pattern as a new Doppler echocardiographic sign of acute pulmonary embolism. Am J Cardiol. 2002;90:507–11. doi: 10.1016/s0002-9149(02)02523-7. [DOI] [PubMed] [Google Scholar]
- 87.Torbicki A, Galié N, Covezzoli A, Rossi E, De Rosa M, Goldhaber SZ ICOPER Study Group. Right heart thrombi in pulmonary embolism: Results from the International Cooperative Pulmonary Embolism Registry. J Am Coll Cardiol. 2003;41:2245–51. doi: 10.1016/s0735-1097(03)00479-0. [DOI] [PubMed] [Google Scholar]
- 88.Pierre-Justin G, Pierard LA. Management of mobile right heart thrombi: A prospective series. Int J Cardiol. 2005;99:381–8. doi: 10.1016/j.ijcard.2003.10.071. [DOI] [PubMed] [Google Scholar]
- 89.Hopkins WE. The remarkable right ventricle of patients with Eisenmenger syndrome. Coron Artery Dis. 2005;16:19–25. doi: 10.1097/00019501-200502000-00004. [DOI] [PubMed] [Google Scholar]
- 90.Delgado JF, Conde E, Sánchez V, López-Ríos F, Gómez-Sánchez MA, Escribano P, et al. Pulmonary vascular remodeling in pulmonary hypertension due to chronic heart failure. Eur J Heart Fail. 2005;7:1011–6. doi: 10.1016/j.ejheart.2004.10.021. [DOI] [PubMed] [Google Scholar]
- 91.Moraes DL, Colucci WS, Givertz MM. Secondary pulmonary hypertension in chronic heart failure: The role of the endothelium in pathophysiology and management. Circulation. 2000;102:1718–23. doi: 10.1161/01.cir.102.14.1718. [DOI] [PubMed] [Google Scholar]
- 92.Tribouilloy CM, Enriquez-Sarano M, Rossi A, Tajik AJ, Seward JB. Determinants of the pulmonary artery pressure rise in left ventricular dysfunction. Cardiologia. 1997;42:1051–8. [PubMed] [Google Scholar]
- 93.Forfia PR. Approach to patients with heart failure and pulmonary hypertension. Curr Treat Options Cardiovasc Med. 2007;9:302–9. doi: 10.1007/s11936-007-0025-2. [DOI] [PubMed] [Google Scholar]
- 94.Melenovsky V, Borlaug BA, Rosen B, Hay I, Ferruci L, Morell CH, et al. Cardiovascular features of heart failure with preserved ejection fraction versus nonfailing hypertensive left ventricular hypertrophy in the urban Baltimore community: The role of atrial remodeling/dysfunction. J Am Coll Cardiol. 2007;49:198–207. doi: 10.1016/j.jacc.2006.08.050. [DOI] [PubMed] [Google Scholar]
- 95.Grayburn PA. How to measure severity of mitral regurgitation. Postgrad Med J. 2008;84:395–402. doi: 10.1136/hrt.2005.086462. [DOI] [PubMed] [Google Scholar]
- 96.Smith MD, Cassidy JM, Gurley JC, Smith AC, Booth DC. Echo Doppler evaluation of patients with acute mitral regurgitation: Superiority of transesophageal echocardiography with color flow imaging. Am Heart J. 1995;129:967–74. doi: 10.1016/0002-8703(95)90118-3. [DOI] [PubMed] [Google Scholar]
- 97.Prasanna V, Opotowsky A, Ojeda J, Arkles J, Forfia P. Echo-Doppler scoring system provides simple noninvasive assessment of the pathophysiology of pulmonary hypertension in a mixed pulmonary hypertension cohort. Chest. 2009;136:32S–h. [Google Scholar]
- 98.Arkles JS, Opotowsky AR, Ojeda J, Rogers F, Liu T, Prassana V, et al. Shape of the right ventricular Doppler envelope predicts hemodynamics and right heart function in pulmonary hypertension. Am J Respir Crit Care Med. 2011;183:268–76. doi: 10.1164/rccm.201004-0601OC. [DOI] [PubMed] [Google Scholar]
- 99.Damato AN, Galante JG, Smith WM. Hemodynamic response to treadmill exercise in normal subjects. J Appl Physiol. 1966;21:959–66. doi: 10.1152/jappl.1966.21.3.959. [DOI] [PubMed] [Google Scholar]
- 100.Wagner PD, Gale GE, Moon RE, Torre-Bueno JR, Stolp BW, Saltzman HA. Pulmonary gas exchange in humans exercising at sea level and simulated altitude. J Appl Physiol. 1986;61:260–70. doi: 10.1152/jappl.1986.61.1.260. [DOI] [PubMed] [Google Scholar]
- 101.Bossone E, Rubenfire M, Bach DS, Ricciardi M, Armstrong WF. Range of tricuspid regurgitation velocity at rest and during exercise in normal adult men: Implications for the diagnosis of pulmonary hypertension. J Am Coll Cardiol. 1999;33:1662–6. doi: 10.1016/s0735-1097(99)00055-8. [DOI] [PubMed] [Google Scholar]
- 102.West JB. Left ventricular filling pressures during exercise: A cardiological blind spot? Chest. 1998;113:1695–7. doi: 10.1378/chest.113.6.1695. [DOI] [PubMed] [Google Scholar]
- 103.Laskey WK, Ferrari VA, Palevsky HI, Kussmaul WG. Pulmonary artery hemodynamics in primary pulmonary hypertension. J Am Coll Cardiol. 1993;21:406–12. doi: 10.1016/0735-1097(93)90682-q. [DOI] [PubMed] [Google Scholar]
- 104.Kovacs G, Berghold A, Scheidl S, Olschewski H. Pulmonary arterial pressure during rest and exercise in healthy subjects. A systematic review. Eur Respir J. 2009;34:888–94. doi: 10.1183/09031936.00145608. [DOI] [PubMed] [Google Scholar]
- 105.Steen V, Chou M, Shanmugam V, Mathias M, Kuru T, Morrissey R. Exercise-induced pulmonary arterial hypertension in patients with systemic sclerosis. Chest. 2008;134:146–51. doi: 10.1378/chest.07-2324. [DOI] [PubMed] [Google Scholar]
- 106.Tolle JJ, Waxman AB, Van Horn TL, Pappagianopoulos PP, Systrom DM. Exercise-induced pulmonary arterial hypertension. Circulation. 2008;118:2183–9. doi: 10.1161/CIRCULATIONAHA.108.787101. [DOI] [PMC free article] [PubMed] [Google Scholar]
- 107.Reichenberger F, Voswinckel R, Schulz R, Mensch O, Ghofrani HA, Olschewski H, et al. Noninvasive detection of early pulmonary vascular dysfunction in scleroderma. Respir Med. 2009;103:1713–8. doi: 10.1016/j.rmed.2009.05.004. [DOI] [PubMed] [Google Scholar]
- 108.Pynnaert C, Lamotte M, Naeije R. Aerobic exercise capacity in COPD patients with and without pulmonary hypertension. Respir Med. 2010;104:121–6. doi: 10.1016/j.rmed.2009.06.006. [DOI] [PubMed] [Google Scholar]
- 109.Sun XG, Hansen JE, Oudiz RJ, Wasserman K. Exercise pathophysiology in patients with primary pulmonary hypertension. Circulation. 2001;104:429–35. doi: 10.1161/hc2901.093198. [DOI] [PubMed] [Google Scholar]
- 110.Hacobian M, Cohen MC, Atherton D, Wirth JA. Right ventricular exercise echocardiographic predictors of worsened clinical status in patients with pulmonary arterial hypertension. Am J Respir Crit Care Med. 2011;183:A4996. [Google Scholar]