Abstract
Imaging mass spectrometry using Matrix-Assisted Laser Desorption/Ionization allows the detailed mapping of biomolecules directly from tissue. Matrix deposition is the key step for successful imaging. Appropriate concentration and deposition of matrix is critical for extraction, desorption and ionization of molecules from tissue without losing molecular localization. The main challenge to meet these criteria is to deposit matrix droplets homogeneously on the tissue section.
This work shows how a chemical inkjet printer was used for this purpose resulting in the imaging of phosphatidylcholines and sulfatides. The intricacies involved in effective matrix deposition are discussed.
Keywords: Imaging, mass spectrometry, lipids, chemical ink jet printer
Introduction
Ionizable biomolecules are good candidate for direct detection, identification and localization from tissue sections using matrix-assisted laser desorption/ionization mass spectrometry (MALDI MS)1. Molecule distribution is crucial when investigating disease etiology and effects2 as well as drug localization within organs3. MALDI MS directly detects whole molecules compared to approaches based on antigen use which require one to two antibodies to specifically recognize a chemical group only of the targeted molecule. MALDI MS imaging is thus an alternative technique for direct molecular mapping.
Sample preparation for such experiments depends on the targeted molecules. Tissue washing4 with organic solvents to dissolve lipids makes it easier to image peptides. In situ tissue digestion4 can be a solution to shift the m/z range of heavy proteins of interest toward lower detectable masses. Matrix coating is always the final step of the tissue sample preparation. The matrix absorbs the laser energy thus facilitating the embedded analytes desorption/ionization1. Initially, the method most often utilized for matrix deposition in MALDI imaging was to airbrush the matrix onto the tissue section. However, this technique may not be effective for all small molecules, such as chlorisondamine (a therapeutic compound) and cocaine. In a work done prior to publishing reference 5, images of chlorisondamine and of cocaine highlighted their delocalization all over the tissue sections and onto the MALDI plates. The pressure of the solution onto the sample surface and centrifugal movement of the small molecules towards the edge of the tissue section may explain these observations. Indeed, the compounds could only be partially mapped, in fact profiled, by depositing a small volume of matrix solution using a pipette5. Nowadays, new instruments have been designed to overcome the delocalization issue. One of the current leading strategies is based on automated deposition4,6–12 to keep the analytes localization while providing uniform and homogenous deposition of matrix droplets with efficient analytes extraction, desorption/ionization and thus detection.
A chemical inkjet printer is an automated delivery system which micro-dispense diverse fluid solution using piezoelectric technology 3,9,13,14,16. The solution is delivered, drop by drop, through a print head which moves along the (X) and (Y) axes to cover the surface of the sample. The software allows the delineation of the print area, the distance between two spots of deposited matrix, the matrix spots grid geometry, the final volume of matrix solution deposited per spot as well as the rate at which it is deposited. Every one of these parameters was put to the test to cover a surface of tissue with matrix in the minimum amount of time prior to image acquisition. In this study, we focus mainly on the mapping of phosphatidylcholines and sulfatides.
Material and method
The workflow is described Figure 1.
Figure 1.

MALDI imaging schematic workflow using a chemical inkjet printer for matrix coating. a) The tissue sample is sectioned using a cryostat. b) The matrix solution is microprinted onto the sample through a piezo print head following a grid pattern of spots. c) The coated section is ready for d) MALDI imaging experiment. e) Acquired data are processed to create 2D maps of the signals.
Matrix solutions
2,5-dihydroxy benzoic acid (DHB) and 2,6-dihydroxy-acetophenone (DHA) were prepared in 50% ethanol (200 proof). Matrix solutions were saturated, 100mg/mL or 30mg/mL. Both are suitable for lipids detection15.
Tissue sections
Thin coronal sections (18μm) were cut from frozen rat brains, deposited on stainless steel MALDI targets and left at room temperature for temperature equilibration.
Matrix coating
A ChIP-1000™ (Shimadzu-Biotech, Columbia, MD) was used to apply matrix solutions. The dwell time and dwell voltages values were carefully optimized for each matrix to allow for 87pL drops deposition along a vertical axe. A total number of 8 drops/spot were used to form a first layer of matrix. The number of deposited layers was determined as a function of the chosen final volume per spot. Matrix solutions were dispensed following a grid pattern of spots inside a delineated rectangular print area. The chosen pattern used spots placed at the nods of an orthonormal grid (microarray like). Five different volumes of DHB (5, 10, 25, 50 and 100 nL per spot) and four distances between spots center-to-center were tested (300, 250, 200 and 100 μm).
MALDI imaging
Lipid images in the 650–900 m/z range were acquired using a conventional MALDI TOF-TOF mass spectrometer (4700 Proteomics Analyzer, Applied Biosystems, Framingham MA) in positive ion and reflectron modes with a 355nm Nd:YAG laser of 200 Hz of repetition rate. Data presented in this work were acquired with a spatial resolution of 80μm and 80 shots per step. Ion intensity maps were generated using TissueView 1.0 software.
Results and Discussion
Necessity of a fluid matrix solution
The printing of two organic matrices was tested as a function of the matrix concentration (data not shown). Due to fast matrix recrystalization4, saturated and close to saturation solutions rapidly clogged the narrow piezohead. It was prevented by cleaning the external part of the device every 10 minutes with a 50% ethanol solution. Additionally, lower matrix concentrations were used while increasing the deposited volume to keep a constant matrix amount. Consequently, the concentration of each matrix should always be first checked to reach an optimum matrix amount printed within the shortest time scale. A third remedy, first described in our recent work on hard to detect molecules16, should be used when saturated matrices are absolutely necessary. The following results will only focus on 30mg/mL DHB use, for which optimum dwell voltage, dwell time, and air flow were found to be 29V, 34μs and −0.25 kPa, respectively.
Solution volume and signal intensity
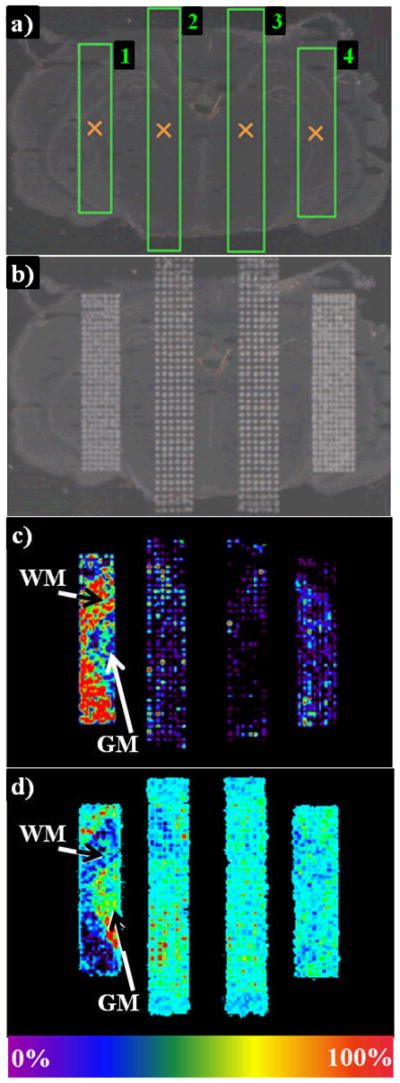
Five volumes ranging from 5 to 100nL/spot were first tested on a single rat brain section. Weak signals were obtained with 5nL/spot whereas 100nL/spot resulted in detector saturation. Better results were obtained when using 10 to 25nL/spot (Data not shown). However, 15nL/spot (Figure 2) was the optimum volume. Indeed, the comparison of the signal intensity from anatomically similar areas 1 and 4 showed a higher intensity for area 1 which received 15nL/spot. Moreover, the use of 15nL/spot decreased printing duration.
Figure 2. Matrix coating efficiency test as a function of the distance between two spots of matrix and the deposited volume of DHB per spot onto a rat brain section, using the chemical inkjet printer.

a) Four rectangular print areas were delineated on the freshly cut tissue section using the spotter printing software. Areas 1 and 2 received 15nL of matrix solution per spot while areas 3 and 4 received 25nL. In addition, a distance of 200μm was set between two spots center-tocenter for areas 1 and 4 versus 250μm for areas 2 and 3. After matrix microprinting b), a MALDI image was acquired. c) PC 32:0+K (m/z 770) and d) PC 38a:4+K (m/z 848) localization in white (WM) and grey matter (GM), respectively, highlights differences in the efficiency of the matrix volume and the raster used in each area.
Adequate distance between two spots
In addition, a small laser raster of 80μm was used during image acquisition to ensure an adequate sampling of each spot. The ultimate image resolution was defined by the distance between two spots center-to-center. This parameter was tested at 100, 200, 250 and 300μm. The 100μm distance resulted in the coalescence of spots, one of the major causes of delocalization, whereas 300μm left wide gaps in between spots (Data not shown). Two grids obtained with 200μm (areas 1 and 4) and 250μm (areas 2 and 3) are shown in Figure 2b. The following two figures (Figure 2c and 2d) display lipid images from white and grey matter, respectively. Comparing areas 1 and 2 show that a better image resolution is obtained when using 200μm.
Repeatability
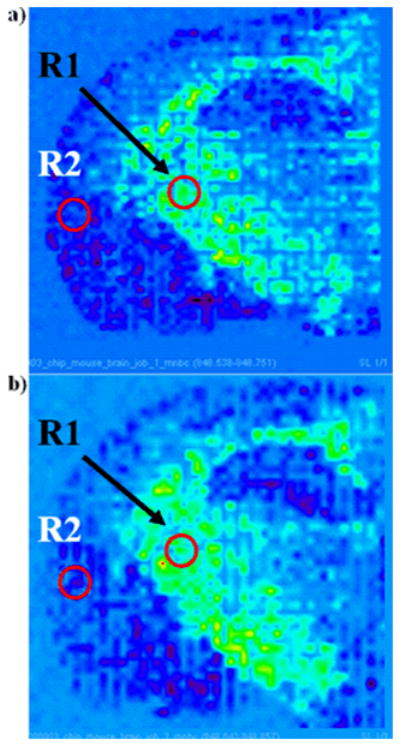
Two images of [PC 36a:1+Na+K]+ (m/z 848) were obtained from two separate half mouse brain sections cut close to bregma −1.355mm (Figure 3). Matrix printing took one hour. The PC mapping displayed the same pattern in each image. Average intensities of two regions, R1 and R2, taken in the same areas from three consecutive sections were compared. For each image, the average intensity in R1 was divided by the average intensity in R2. The resulting ratio was found to be 3.7 and 3.3 in Figure 3a and 3b, respectively. R1/R2 differs by 0.4 only. The qualitative homogeneity of the PC mapping in this figure demonstrates the repeatability of the method.
Figure 3.

Images of [PC 36a:1+Na+K]+ (m/z 848; tentative assignment) obtained from two different coronal mouse brain sections using 15nL of 30mg/mL DHB in 50% ethanol per spot with a 200μm distant center-to-center. Average intensity of two regions of same surface, R1 and R2, were delineated.
Precision: in the matrix coating and in the mapping
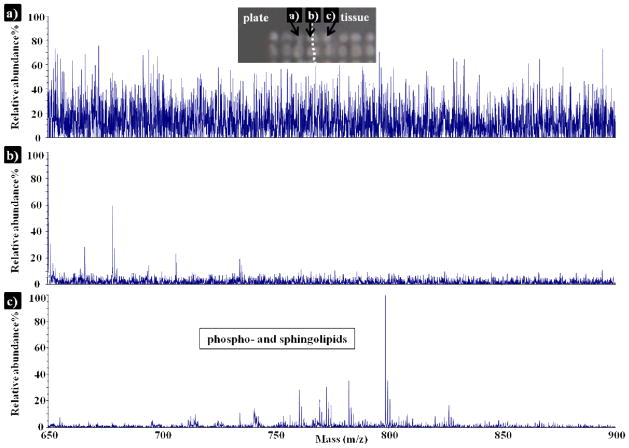
Mass spectra were acquired from three different areas (Figure 4). The signals show progression from high noise to signal ratio, from matrix on the MALDI plate to the detection of lipids from a matrix spot on the tissue. The mass spectrum obtained from the spot at the edge of the tissue section mainly displays ions generated from the DHB matrix solution. It demonstrates the advantage of this matrix coating technique, as analytes localization is precisely kept.
Figure 4.
Positive ion mode MALDI mass spectra of phospho- and sphingolipids detected in a rat brain section, using 15nL/spot of 30mg/mL DHB, and a spot center-to-center distance of 200μm. Mass spectra were collected from matrix spots a) onto the MALDI plate, b) at the edge of the tissue and c) onto the tissue.
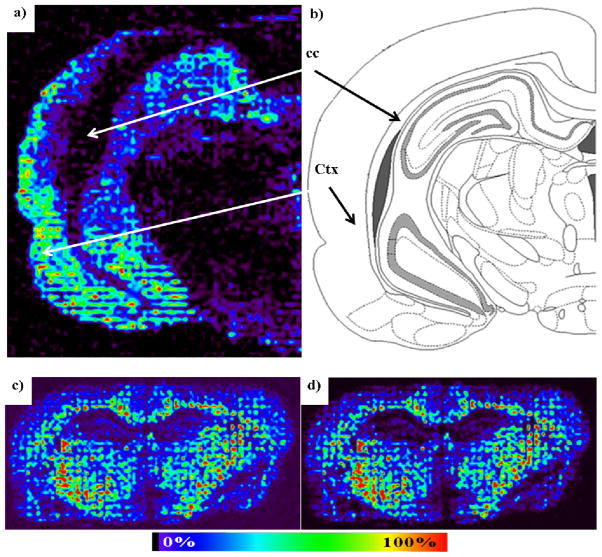
Images were acquired from wild type rodents (Figures 5) with optimized parameters, i.e. 30mg/mL DHB, 15nL/spot, 8 drops/spot/iteration, 200μm between tow spot centers, allowing to print matrix at a rate of approximately 3h/cm2. The rat brain anatomy could easily be identified in Figure 5a) and 5b) from PC 34:1+K image. The phospholipid is clearly localized in the cerebral cortex and absent from the corpus callosum in agreement with previous results17,18. Images were also recorded in negative ion mode in a previous study16 and as shown in Figure 5c) and d) with two sulfatides mapped from a coronal section of mouse brain and in agreement with previous results19 obtained after spraying the matrix.
Figure 5.
Applications of matrix coating using a spotter for MALDI imaging. a) PC 34:1+K (m/z 798.6; ref. 17) mapping in positive ion mode from rat brain tissue using 15nL of 30mg/mL DHB in 50% ethanol per spot with a 200μm distant center-to-center. The matrix was deposited within 2h. b) Map of the distribution of PC 34:1+K in a brain coronal section in the cerebral cortex (Ctx) and corpus callosum (cc; Atlas figure adapted from coronal level 71 of the Rat Brain Atlas in Stereotaxic coordinates, G. Paxinos and C. Watson). c) Images of sulfatides obtained from a coronal mouse brain section using 15nL of 30mg/mL DHB in 50% ethanol per spot with a 200μm distant center-to-center. The matrix was deposited within 2h
Conclusion
Automated matrix printing requires more time than spraying7,12 but is repeatable. It allowed the precise mapping of biomolecules when using appropriate parameters and when coupled to conventional MALDI mass spectrometry. In further studies, tissues containing chlorisondamine and cocaine will be covered by matrix using the spotter for imaging.
Acknowledgments
This research was supported by the Intramural Research Program of the National Institute on Drug Abuse, NIH. The authors acknowledge Steve M. Wishnies and Brian J. Feild of the Shimadzu Corporation for technical advices.
References
- 1.Cole RB, Wiley . Electrospray and MALDI Mass Spectrometry: Fundamentals, Instrumentation, Practicalities, and Biological Applications. 2. 2010. [Google Scholar]
- 2.Schwamborn K, Caprioli RM. Nat Rev Cancer. 2010;10:639–646. doi: 10.1038/nrc2917. [DOI] [PubMed] [Google Scholar]
- 3.Shen H, et al. FASEB J. 2009;23:1958–1968. doi: 10.1096/fj.08-123281. [DOI] [PMC free article] [PubMed] [Google Scholar]
- 4.Chugtai K, Heeren RMA. Chem Rev. 2010;110:3237–3277. doi: 10.1021/cr100012c. [DOI] [PMC free article] [PubMed] [Google Scholar]
- 5.Wang H-YJ, Jackson JN, McEuen J, Woods AS. Anal Chem. 2005;77:6682–6686. doi: 10.1021/ac050868d. [DOI] [PubMed] [Google Scholar]
- 6.Aerni HR, Cornett DS, Caprioli RM. Anal Chem. 2006;78:827–834. doi: 10.1021/ac051534r. [DOI] [PubMed] [Google Scholar]
- 7.Baluya DL, Garrett TJ, Yost RA. Anal Chem. 2007;79:6862–6867. doi: 10.1021/ac070958d. [DOI] [PubMed] [Google Scholar]
- 8.Chen Y, et al. Anal Chem. 2008;80:2780–2788. doi: 10.1021/ac702350g. [DOI] [PubMed] [Google Scholar]
- 9.Franck J, et al. Anal Chem. 2009;81:8193–8202. doi: 10.1021/ac901328p. [DOI] [PubMed] [Google Scholar]
- 10.Trimpin S, et al. Anal Chem. 2010;82:359–367. doi: 10.1021/ac902065u. [DOI] [PubMed] [Google Scholar]
- 11.Landgarf RR, et al. Anal Chem. 2007;79:8170–8175. doi: 10.1021/ac0713555. [DOI] [PubMed] [Google Scholar]
- 12.Gustafsson JOR, et al. Int J Mol Sci. 2011;12:773–794. doi: 10.3390/ijms12010773. [DOI] [PMC free article] [PubMed] [Google Scholar]
- 13.Shimma S, et al. J Mass Spectrom Soc Jpn. 2006;54(4):133–140. [Google Scholar]
- 14.Shimma S, et al. Surf Interface Anal. 2006;38:1712–1714. [Google Scholar]
- 15.Jackson SN, Wang HYJ, Woods AS. Anal Chem. 2005;77:4523–4527. doi: 10.1021/ac050276v. [DOI] [PubMed] [Google Scholar]
- 16.Colsch B, Woods AS. Glycobiology. 2010;20:661–667. doi: 10.1093/glycob/cwq031. [DOI] [PMC free article] [PubMed] [Google Scholar]
- 17.Jackson SN, Wang HYJ, Woods AS. J Am Soc Mass Spec. 2005;16:2052–2056. doi: 10.1016/j.jasms.2005.08.014. [DOI] [PubMed] [Google Scholar]
- 18.Jackson SN, et al. J Mass Spectrom. 2007;42:1093–1098. doi: 10.1002/jms.1245. [DOI] [PMC free article] [PubMed] [Google Scholar]
- 19.Wang HYJ, Jackson SN, Post J, Woods AS. Int J Mass Spec. 2008;278:143–149. doi: 10.1016/j.ijms.2008.04.005. [DOI] [PMC free article] [PubMed] [Google Scholar]


