

Abstract
In animals, scaling relationships between appendages and body size exhibit high interspecific variation but low intraspecific variation. This pattern could result from natural selection for specific allometries or from developmental constraints on patterns of differential growth. We performed artificial selection on the allometry between forewing area and body size in a butterfly to test for developmental constraints, and then used the resultant increased range of phenotypic variation to quantify natural selection on the scaling relationship. Our results show that the short-term evolution of allometries is not limited by developmental constraints. Instead, scaling relationships are shaped by strong natural selection.
Among species, populations, and even sexes, morphological traits exhibit an impressive diversity of scaling relationships with body size; most traits scale positively with body size, although the rate at which trait size changes with overall size often differs from isometry and can even be nonlinear (1, 2). This is particularly true of insects, which exhibit extremes in trait-body size allometries (3). This extreme variation among groups is in marked contrast to the extent of variation within groups; typically, individuals within these groups exhibit low variation around some average allometry, reflecting a tight scaling between body parts and overall size [e.g., (4–7)].
Although these patterns have long been recognized (2, 8), surprisingly little is known about the evolution of scaling relationships (3, 9); in particular, the relative importance of processes shaping their evolution is largely uninvestigated (10). Presumably, tight adherence to particular allometries results from external selection against traits with atypical or nonfunctional relative sizes. Such selection is predicted to favor the evolution of genetic and developmental systems that properly scale the growth of traits across body sizes, maintaining functional size relationships in the face of environmental and genetic variation (11, 12). However, this scenario presents a paradox: The proximate mechanisms that evolve to maintain the relative size of traits will then produce developmental constraints [as defined in (10)] that must be overcome if allometries are to evolve. Here, we present empirical data addressing the relative roles of natural selection and developmental constraints in the evolution of the allometry between forewing area and body size in the butterfly Bicyclus anynana.
In the context of the evolution of allometries among morphological traits, the scaling relationship between wing area and body size (i.e., the ratio of body size to wing area, or “wing loading”) is of interest, because it is ecologically important and taxonomically diverse (13, 14). The size of the wings and flight musculature relative to body mass affects flight performance directly (14), as well as indirectly through thermoregulatory effects while basking or during ectotherm flight (13). Lepidoptera have the lowest average wing loading among flying insects (15) and exhibit lineage-specific, seasonal morph-specific, or sex-specific scaling relationships associated with life historical or behavioral correlates [e.g., (6, 16–20)]. As with most insects, adult body size in B. anynana is a highly plastic trait (21), and forewing area (FW) exhibits a strong, positive phenotypic correlation with total body mass (BS) across the natural range of body size (Pearson correlation coefficient = 0.86, N = 691 stock population females, P = 0.0001). Moreover, artificial selection for changes in FW and pupal mass revealed a genetic correlation between these traits (r 0 0.75) (Fig. 1) (20).
Fig. 1.
Response to artificial selection on absolute trait size. Forewing area (FW, triangles indicate direction of selection) and pupal mass (PM, squares) are shown relative to control means (horizontal line) as a function of the cumulated selected differential. Regression was used to calculate the realized heritability for each trait. Pupal mass increased ~1.5 SD and decreased ~1 SD in six generations. Realized heritabilities were moderate in each direction (+PM h2 = 0.28, −PM h2 = 0.16). FW responded rapidly and asymmetrically to selection, increasing ~1.5 SD and decreasing ~0.5 SD relative to controls. Realized heritabilities were moderate and similar to those for pupal mass [+FW h2 = 0.38, −FW h2 = 0.16; note that these values are twice the slope of the regression for FW because only females were selected in these lineages (20)].
The strong genetic correlation between FW and body size should constrain their independent evolution (22), inhibiting phenotype evolution in a direction perpendicular to that of the wild-type allometry (23). To determine whether such internal constraints limit the short-term evolution of the scaling relationship, we performed artificial selection on the FW/BS allometry (20). The FW/BS allometry evolved rapidly, diverging ~2 SD in each direction relative to that of the control lineage to produce distinct, novel phenotypes [Fig. 2; discriminant function analysis correctly classified 94.8% of females from generation 13 (−2 log likelihood = 107.4; N = 766, replicates pooled)]. The response to selection resulted almost entirely from changes in FW (Fig. 3); BS changed in the appropriate direction in only one lineage (−FW/ lineage E; F1,11 = 5.55, P = 0.038) (20). This extreme asymmetry in the contribution of each trait to the evolution of the allometry was unexpected, as both individual FW and body size exhibited very similar realized heritabilities (Fig. 1), indicating adequate and equivalent genetic variation in both traits. Moreover, the observed pattern of response is not due to differences in the phenotypic variance between the traits, because they were subject to similar indirect selection pressures in all but one case (Fig. 3). A low frequency of alleles in our starting population that affect BS independently of FW or a sieving out of key alleles that affect FW but not BS could account for the pattern. In any case, the rapid evolution of the allometry demonstrates a surprising absence of developmental constraints restricting change in this scaling relationship. However, the pattern of response exhibited by FW and BS indicates a strong bias [or developmental constraint (10)] in how these traits respond indirectly to direct selection on their scaling relationship. Hence, the allometry itself is not developmentally constrained; what does appear to be constrained is the way in which the individual components contribute to the evolution of this complex phenotype.
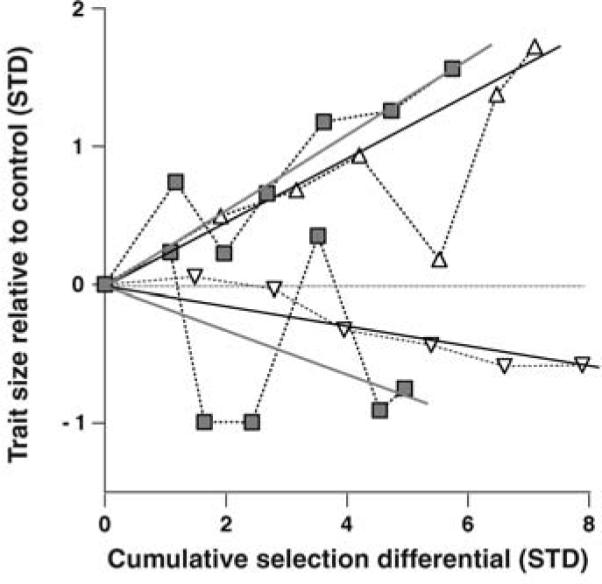
Fig. 2.

Scatterplots of static allometries of individuals from lineages selected for changes in FW/BS and the evolution of the mean allometry. (A) Phenotype distributions of lineages selected for changes in forewing–body size scaling. Each selected population is shown as a different symbol; replicates of a selection direction have the same shading. The mean allometry of each selected direction (replicates combined) is shown as the model II regression through the points and is enclosed by a 95% confidence ellipse. (B) Realized heritabilities of the mean allometries. Mean phenotype (through which the mean allometry passes) for each lineage is shown relative to control values (horizontal dashed line) as a function of the cumulative selection differential. Mean heritabilities (+FW/−HW 0 0.18; −FW/+HW 0 0.24) are equal to twice the slope of the regressions fit to each selected direction (95% confidence intervals shown by dashed lines). Target phenotypes are represented by cartoons in both panels.
Fig. 3.
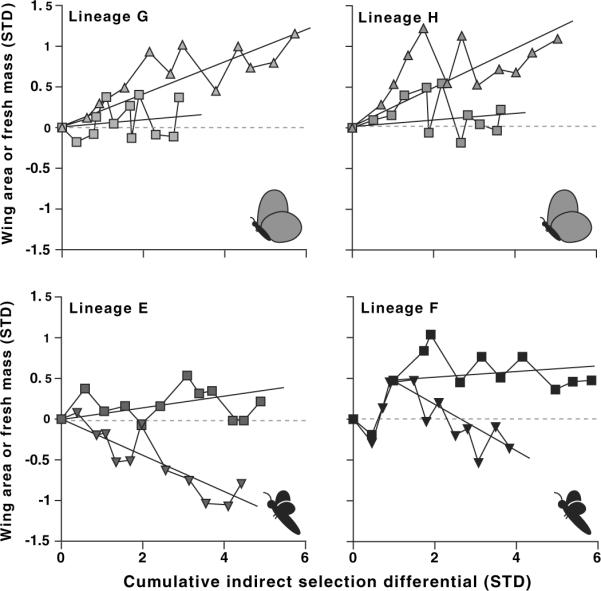
Indirect response of mean forewing area (triangles indicate direction of FW selection relative to fresh mass) and fresh mass (squares) to direct selection on their scaling relationship. Values are plotted relative to control lineage means (horizontal dashed line) as a function of the cumulative indirect selection on each trait. The average indirect response of each trait is shown by the individual regression line for that trait. In lineage F, divergence in the values did not occur until generation 4; hence, the mean indirect response to selection is shown from generation 3 onward for this replicate. Cartoons represent the selected target phenotype.
Our results, together with the few other studies that have used artificial selection to alter scaling relationships between morphological traits in insects (24–26), indicate that even strong genetic correlations do not constrain phenotype evolution in the short term. It seems that the developmental basis of these genetic correlations is more important than their strength in determining the response to selection (27). In particular, under novel selection regimes such as the artificial one we imposed, the developmental program coordinating the growth of the individual traits may influence how these traits and the relationship between them evolves (28).
The lack of developmental constraints on the evolution of the allometry motivated us to determine the pattern of natural selection on wing loading. To examine the fitness consequences of deviating from the wild-type FW/BS scaling relationship, we measured the mating success of competing wild-type control and novel-phenotype males (two treatment male classes, +FW/−BS and −FW/+BS) in a spacious, naturally planted, tropical greenhouse. Treatment and control males taken from reciprocal crosses of the replicated lineages of each selected direction were selected for inclusion in the experiment on the basis of their static allometries (20). Hence, all males came from similarly outcrossed populations, and treatment and control males were drawn from the same genetic background. Mating success was determined by the transfer of phenotype class–specific colored powder from males to females (20, 29). In both trials, males with the wild-type phenotype acquired three times as many matings as did males from both phenotype classes with novel wing loadings (Fig. 4; trial 1, G = 30.2, P < 0.001; trial 2, G = 18.381, P < 0.001). These results demonstrate strong stabilizing selection favoring the natural scaling relationship between forewing and body size in B. anynana.
Fig. 4.

Distributions of static allometries for FW/BS allometries and relative mating success of three male phenotype classes. (A) Distributions of individual males with +FW/−BM, wild type, and +FW/−BM phenotypes included in the experiment (extreme phenotypes are represented by cartoons). Solid circles denote novel phenotype classes; open circles denote wild-type controls. (B) Mating success of each phenotype class. Columns indicate percentage of recaptured females that mated with males in each class and are shown with 95% confidence intervals based on a bimodal distribution. Numbers in the columns indicate the number of males recaptured in each group. Data from replicate trials are indicated by similar shading (shared between panels).
Survival among male phenotype classes (recapture rates) did not differ (trial 1, G = 0.110, P = 0.947; trial 2, G = 0.641, P = 0.726), a finding consistent with results from manipulative studies of wing loading in free-flying butterflies [e.g., (15, 30, 31). Because survival was the same among male phenotypes, the higher fitness of wild-type males must be due to other, nonexclusive, selective factors. In the greenhouse, males engage in prolonged bouts of chasing both other males and females, as they do in nature (29), which suggests that the lower fitness of treatment males may result from decreased locomotor performance (20). Intrasexual competition among male phenotypes may also play a role; +FW/−BS and −FW/+BS males may be excluded from females in the presence of superiorly flying, wild-type males. Alternatively, wild-type males may be selected by females because of favored signals produced during courtship or flight (29) or because treatment males are less appealing visually. In any case, because treatment and wild-type males were drawn from the same outbred populations, any female preference must be largely unrelated to male genetic background in our experiment. Regardless of the cause of the higher fitness of wild-type males, we have documented strong stabilizing selection on male wing loading.
Our findings indicate that it is not internal developmental constraints, but rather external natural selection, that is the primary force shaping the short-term evolution of morphological allometries in insects. However, the surprising bias in the morphological basis of how the allometry evolved suggests that development may strongly influence how individual traits respond to selection on their scaling relationships.
Supplementary Material
Footnotes
Supporting Online Material www.sciencemag.org/cgi/content/full/307/5710/718/DC1
References and Notes
- 1.Thompson DW. On Growth and Form. Cambridge Univ. Press; Cambridge: 1917. [Google Scholar]
- 2.Huxley JS. Problems of Relative Growth. Methuen; London: 1932. [Google Scholar]
- 3.Emlen DJ, Nijhout HF. Annu. Rev. Entomol. 2000;45:661. doi: 10.1146/annurev.ento.45.1.661. [DOI] [PubMed] [Google Scholar]
- 4.Burkhardt D, de la Motte I. Entomol. Gen. 1987;12:221. [Google Scholar]
- 5.Eberhard WG, Gutierrez EE. Evolution. 1991;45:18. doi: 10.1111/j.1558-5646.1991.tb05262.x. [DOI] [PubMed] [Google Scholar]
- 6.Strauss RE. In: Ordination in the Study of Morphology, Evolution, and Systematics of Insects: Applications and Quantitative Genetic Rationales. Sorensen JT, Foottit R, editors. Elsevier Science; Amsterdam: 1992. pp. 157–179. [Google Scholar]
- 7.Emlen DJ. Science. 2001;291:1534. doi: 10.1126/science.1056607. [DOI] [PubMed] [Google Scholar]
- 8.Gould SJ. Biol. Rev. 1966;41:587. doi: 10.1111/j.1469-185x.1966.tb01624.x. [DOI] [PubMed] [Google Scholar]
- 9.Stern DL, Emlen DJ. Development. 1999;126:1091. doi: 10.1242/dev.126.6.1091. [DOI] [PubMed] [Google Scholar]
- 10.Maynard Smith J, et al. Q. Rev. Biol. 1985;60:265. doi: 10.1086/394109. [DOI] [PubMed] [Google Scholar]
- 11.Wagner GP. Am. Zool. 1996;36:36. [Google Scholar]
- 12.Wagner GP, Booth G, Bagheri-Chaichian H. Evolution. 1997;51:329. doi: 10.1111/j.1558-5646.1997.tb02420.x. [DOI] [PubMed] [Google Scholar]
- 13.Dudley R. The Biomechanics of Insect Flight: Form, Function, Evolution. Princeton Univ. Press; Princeton, NJ: 2000. [Google Scholar]
- 14.Vogel S. Comparative Biomechanics. Princeton Univ. Press; Princeton, NJ: 2003. [Google Scholar]
- 15.Kingsolver JG. Evolution. 1999;53:1479. doi: 10.1111/j.1558-5646.1999.tb05412.x. [DOI] [PubMed] [Google Scholar]
- 16.For example, low-flight butterflies such as non-dispersers or perching, sit-and-wait males have lower ratios of flight muscle mass to wing size than do stronger flying butterflies such as dispersing individuals or males that actively patrol for females [reviewed in (19)].
- 17.Strauss RE. Evolution. 1990;44:86. doi: 10.1111/j.1558-5646.1990.tb04281.x. [DOI] [PubMed] [Google Scholar]
- 18.Wickman P. Evolution. 1992;46:1525. doi: 10.1111/j.1558-5646.1992.tb01142.x. [DOI] [PubMed] [Google Scholar]
- 19.Van Dyck H, Matthysen E. Trends Ecol. Evol. 1999;14:172. doi: 10.1016/s0169-5347(99)01610-9. [DOI] [PubMed] [Google Scholar]
- 20.See supporting data on Science Online.
- 21.Kooi RE, Brakefield PM. Entomol. Exp. Appl. 1996;80:149. [Google Scholar]
- 22.Falconer DS, MacKay TFC. Introduction to Quantitative Genetics. Vol. 4. Addison-Wesley Longman; Essex, UK: 1997. [Google Scholar]
- 23.Schluter D. Evolution. 1996;50:1766. doi: 10.1111/j.1558-5646.1996.tb03563.x. [DOI] [PubMed] [Google Scholar]
- 24.Weber KE. Genetics. 1990;126:975. doi: 10.1093/genetics/126.4.975. [DOI] [PMC free article] [PubMed] [Google Scholar]
- 25.Wilkinson GS. Genet. Res. 1993;62:213. [Google Scholar]
- 26.Emlen DJ. Evolution. 1996;50:1219. doi: 10.1111/j.1558-5646.1996.tb02362.x. [DOI] [PubMed] [Google Scholar]
- 27.Wolf JB, Frankino WA, Agrawal AF, Brodie ED, III, Moore AJ. Evolution. 2001;55:232. doi: 10.1111/j.0014-3820.2001.tb01289.x. [DOI] [PubMed] [Google Scholar]
- 28.Rice SH. Evolution. 1998;52:647. doi: 10.1111/j.1558-5646.1998.tb03690.x. [DOI] [PubMed] [Google Scholar]
- 29.Joron M, Brakefield PM. Nature. 2003;424:191. doi: 10.1038/nature01713. [DOI] [PubMed] [Google Scholar]
- 30.Srygley RB, Kingsolver JG. Biol. J. Linn. Soc. 2000;70:707. [Google Scholar]
- 31.Kingsolver JG, Srygley RB. Evol. Ecol. Res. 2000;2:593. [Google Scholar]
- 32.K. Koops provided essential assistance in rearing caterpillars, with N. Wurzer and colleagues providing maize plants. C. Allen, P. Beldade, and R. Repasky made helpful comments on the manuscript; R. Repasky and A. Buerkle helped with statistics and computer code. In Leiden, we thank R. de Jong and the National Museum of Natural History for access to specimens and the Hortus Botanicus for access to the tropical greenhouse. Supported by Leiden University and by a 2001 NSF Bioinformatics Postdoctoral Fellowship (W.A.F.).
Associated Data
This section collects any data citations, data availability statements, or supplementary materials included in this article.